RNA matrix models with external interactions and their asymptotic behaviour
Abstract
We study a matrix model of RNA in which an external perturbation acts on n nucleotides of the polymer chain. The effect of the perturbation appears in the exponential generating function of the partition function as a factor [where is the ratio of strengths of the original to the perturbed term and L is length of the chain]. The asymptotic behaviour of the genus distribution functions for the extended matrix model are analyzed numerically when (i) and (ii) . In these matrix models of RNA, as is increased from 0 to 1, it is found that the universality of the number of diagrams at a fixed length L and genus g changes from to ( when ) and the asymptotic expression of the total number of diagrams at a fixed length L but independent of genus g, changes in the factor to ( when ).
pacs:
02.10.Yn, 87.14.gn, 11.10.Jj, 87.15.-vI INTRODUCTION
Improved understanding of the process of folding of RNA finds its ultimate use in the prediction of the fully folded, partially folded and completely unfolded structures under physiological conditions 1 . Under these conditions, unfolding is a very slow process as compared to folding in the presence of a force. Application of a force increases the unfolding rate and we can therefore get the unfolded structures from the folded ones (1 and references therein). Experimental techniques of force induced measurements have proved successful in probing properties related to different aspects of RNA folding and unfolding, domain unfolding in proteins, in polysachharides and nucleic acids (2 and references therein). Experiments have been performed on the double helixed DNAs to study their elastic and structural properties using electric field, hydrodynamic flow among other methods of force application (3 and references therein). The advent of AFM technique served as an important tool in the study of the basic underlying framework of molecular structural biology. Over the years, optical tweezers and AFM (atomic force microscopy) techniques have been employed to study the physical, elastic and structural properties of the biomolecules by recording their force extension curves (FECs) and studying the force dependent dynamics and folding landscapes of the molecules (4 ; 5 ; 6 ; 7 ; 8 ; 9 and references therein). The conformations of biopolymers (DNA, RNA and proteins) which are otherwise not accesible from the conventional methods of measurements: NMR spectroscopy and X-ray crystallography, are possible with the use of AFMs. These conformations help in revealing the underlying mechanical framework of the biological systems (2 and references therein). Mechanical unfolding and refolding of single RNA has been studied using force-ramp, hopping and force-jump methods (10 and references therein). In mechanical unfolding experiments, it has been observed that at a critical value of the applied force, the hairpin structure toggles between the folded and the unfolded states 11 ; 12 ; 13 . In these experiments, ionic concentrations play an important role. Experiments of Bustamante et al 12 ; 13 have shown that the denaturation of RNA by a constant force involves multiple trajectories (for RNA hairpins and Tetrahymena thermophila ribozyme) while undergoing a transition from the folded structure state to the unfolded state. These trajectories depend on the point at which the force is applied 1 ; 14 . This diverseness in the folding-unfolding pathways is due to the rugged energy landscape of RNA (consisting of many minima). Controlled/monitored force loading and unloading rates can be used to manipulate the single molecules of RNA into either their native or misfolded pathways. Different force unloading rates in experiments on TAR RNA molecules showed different types of trajectories associated with particular refolding characteristics (15 and references therein).
We discuss here very briefly, a generalization of the extended random matrix model of RNA folding proposed in 16 where the external perturbation acts on a single nucleotide () and on n nucleotides () in the polymer chain (we will refer to the two RNA models as 1-NP RNA model, with NP being Nucleotide Perturbation and n-NP RNA model respectively). In 16 , the external perturbation acted on all the nucleotides in the polymer chain (i.e., , n is the number of bases on which the force is acting). We briskly outline the extended matrix model of 16 for completeness and understanding and follow it up with results and comparative discussion for the 1-NP and n-NP models. Further, we present a detailed numerical analysis for the asymptotics of the extended matrix model of RNA with perturbation on all the nucleotides in the polymer chain. The genus distribution functions: the total number of diagrams at a fixed length L but independent of genus g, and the number of diagrams at a fixed length L and genus g, of the matrix model of RNA in 17 ; 18 are found to change in the presence of the external perturbation. We extend our numerical asymptotic analysis to the n-NP RNA model as well.
II EXTENDED MATRIX MODELS OF RNA
We review here, the effect when a perturbation acts on all the nucleotides in the polymer chain () studied in 16 . The nucleotide-nucleotide interaction partition function of the polymer chain with a perturbation on all the bases is
| (1) |
where is the normalization constant, is the perturbation term, is an (LL) symmetric matrix containing information on the interactions between the L nucleotides at positions i and j in the polymer chain, are L independent (NN) hermitian matrices and the observable is an ordered product over ’s. We consider and where v gives the strength of interaction between the nucleotides at positions i and j (in these models, interaction between any two nucleotides of the chain is considered the same and equal to v) and w gives the strength of the perturbation. Carrying out a series of Hubbard Stratonovich Transformations, the integral over L matrices in eq. (1) reduces to an integral over a single (NN) hermitian matrix
| (2) |
where . Following the algebra in 16 (from eq.5 to eq.15), the exponential generating function of the partition function is
| (3) |
where gives the ratio of strengths of the original to the perturbed term.
For , the extended matrix model of RNA folding reduces to the random matrix model in 18 . However, for it is observed that the partition function for odd lengths of the polymer chain vanishes completely. In the extended matrix model, each unpaired base of the polymer chain in the contact diagrams is associated with a factor which becomes zero when thus removing structures with any unpaired bases. We can therefore divide the structures into two regimes: (i) comprising of both the unpaired and paired base structures and (ii) comprising of only completely paired base structures (where only structures with fully paired bases remain whereas structures with any unpaired bases are suppressed) 16 . The genus distributions for the extended matrix model are therefore significantly different for different ’s, especially for [where for odd lengths of the polymer chain] as compared with the model of 18 . The addition of a perturbation has thus changed the genus distributions and the overall enumeration of the structures given by this model.
II.1 EXTENDED MATRIX MODEL OF RNA WITH PERTURBATION ON A SINGLE BASE (1-NP) AND n BASES (n-NP)
We now consider a generalization of the extended matrix model proposed in 16 by adding a perturbation to a single nucleotide in the polymer chain only, (1-NP). The motivation comes from the force induced experiments in obtaining important characteristics of folding and unfolding of RNAs discussed in the introduction 1 ; 2 ; 3 ; 4 ; 5 ; 6 ; 7 ; 8 ; 9 ; 10 ; 11 ; 12 ; 13 ; 14 ; 15 . We keep all the assumptions the same as for the model in 16 . The interaction partition function for 1-NP will be given by eq. (1) with the perturbation term now being and the normalization constant given by =. Carrying out a similar mathematical analysis employed in going from eq. (1) to eq. (3) above we can write the exponential generating function of the partition function as in eq. (3) with the only difference being that in eq. (3) gets replaced by for the 1-NP. This implies that when i.e., no perturbation is acting, we get the matrix model of 18 . When , we get the extended matrix model with perturbation on all the bases 16 . The 1-NP partition functions for different L can be found exactly from the exponential generating function [eq. (3) with being replaced by ] by equating the coefficients of powers of t on both the sides of the equation. In general, if the number of bases with the perturbation is n then is replaced by . When , we get the extended matrix model with perturbation on all the bases, discussed briefly here, [eq. (1)-eq. (3)] and in detail in 16 .
The diagrammatic representation of the n-NP differs from the diagrammatics of the model with perturbation on all the nucleotides in the factor associated with each unpaired base which replaces the factor in the contact diagrams of figure 1 in 16 .
III ASYMPTOTICS OF THE EXTENDED MATRIX MODELS FROM NUMERICS
The asymptotic behaviour of the genus distribution functions for the matrix model of RNA studied in 18 showed universal characteristics. We investigate here numerically, the changes that the genus distribution functions: (i) the total number of diagrams at a fixed length L but independent of genus g, [defined as =] and (ii) the number of diagrams at a fixed length L and genus g, [defined through =] of the model in 18 undergo when a perturbation is added to these models. The asymptotics of the genus distribution functions are computed for the extended matrix model (i) with perturbation on all the bases, 16 and (ii) with perturbation on n bases, (n-NP). We will represent the genus distribution functions for the different matrix models as follows: (i) and will represent the asymptotic formulae for the model in 18 , (ii) and will represent the new asymptotic formulae for the extended matrix model of RNA 16 and (iii) and will represent the numerical values of the genus distribution functions for different ’s. We start with the exact asymptotic expressions (i) and (ii) from 18 and compare the behaviour of and for the extended matrix model for lengths upto for different values of . We begin by studying and for the extended models with perturbation on all the bases ().
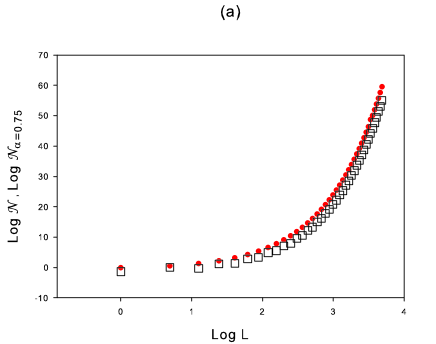
() The new asymptotic formula of (red dotted curve) for the extended matrix model of RNA 16 is plotted with the numerical values for different lengths L for (boxed curve).
III.0.1 Asymptotics for
Figure 1(a) shows the combined plot of the asymptotic expression of (red dotted curve) with the numerically computed values for (boxed curve). We have shown here for illustration, the plot for only . It is observed that as is increased from 0 to 1, the boxed curves (for different ’s) shift downward continuously indicating an dependence in for the extended matrix model of RNA. We investigate this dependence in the following numerical analysis.
| Slope 1 | Slope 1(a) | Slope 2 | Slope 2(a) | |
|---|---|---|---|---|
| 0 | ||||
| 0.25 | ||||
| 0.5 | ||||
| 0.75 | ||||
| 1 |
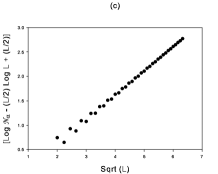
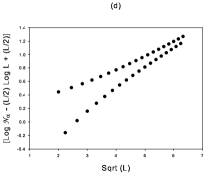
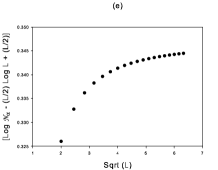
Taking Log of we get: . We are interested in the large length L behaviour and we see that the dependence of Log on L is strongest in LLogL. We linearly fit the plots (i) () verses LLogL (Slope 1, table 1), (ii) () verses L (Slope 2, table 1) and (iii) () verses (fig. 2) for different and find their slopes. We find that there is a continuous decrease in the slopes as goes from 0 to 1 in the linearly fitted plots of (i) and (ii) (Slope 1 and Slope 2 respectively of table 1), strongly suggesting a dependence of on . In the fitted plots of (iii) we observe a remarkable behaviour for and plots [fig. 2(d) and fig. 2(e)]. In the plot [fig. 2(d)], the points for odd and even lengths separate out into two very distinct curves and for the plot [fig. 2(e)], the odd lengths vanish completely leaving only the even length points in the figure. This indicates that () verses is very sensitive to changes in .
We try a factor of with the term in the exponent of the expression and then fit the plots: (i) verses LLogL [Slope 1(a), table 1] and (ii) verses L [Slope 2(a), table 1] for different values of . We observe that now all the slopes are nearly the same and equal to + and - for (i) and (ii) respectively. This proves that the factor of with the term in the exponent of is the correct choice. We can therefore write the new asymptotic expression of the total number of diagrams at a fixed length L and but independent of genus g, for the extended matrix model as
| (4) |
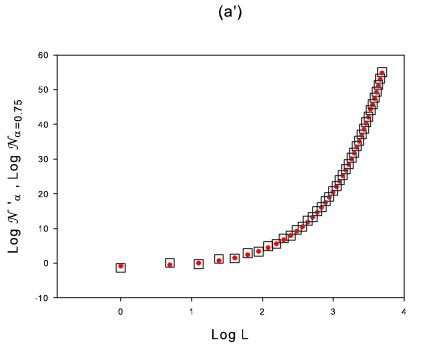
We see from eq. (4) that the total number of structures for the extended matrix model changes considerably for example, when the term vanishes from the exponent. We repeat the exercise as before and plot the new asymptotic formula for the extended matrix model of RNA given by eq. (4) [fig. 1(), red dotted curve] with the numerically obtained values for different ’s (represented by boxed curve, shown here for only ). The plot for the new asymptotic formula coincides with the numerical data confirming the new formula.
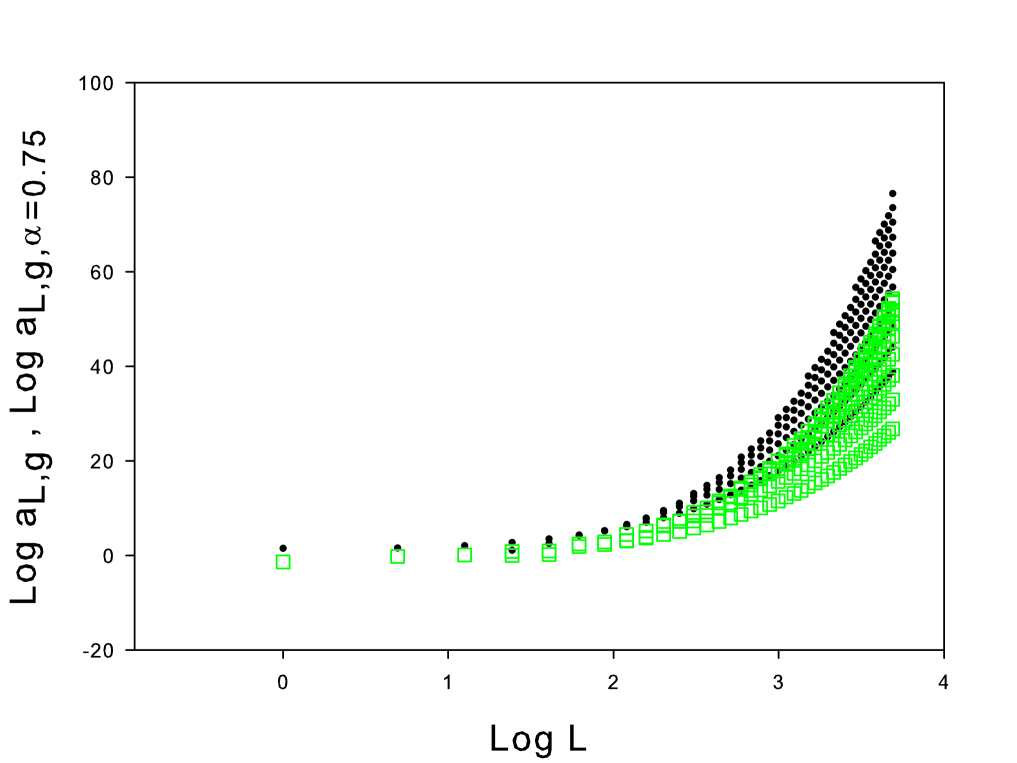
Note: The figure plots ’s for all genii corresponding to a particular length L of the polymer chain. The lowest curve (black dotted or green boxed) corresponds to genus for all the lengths (0 to 40) and the successive curves in the upward direction correspond to next higher genii with the maximum genus given by .
III.0.2 Asymptotics for
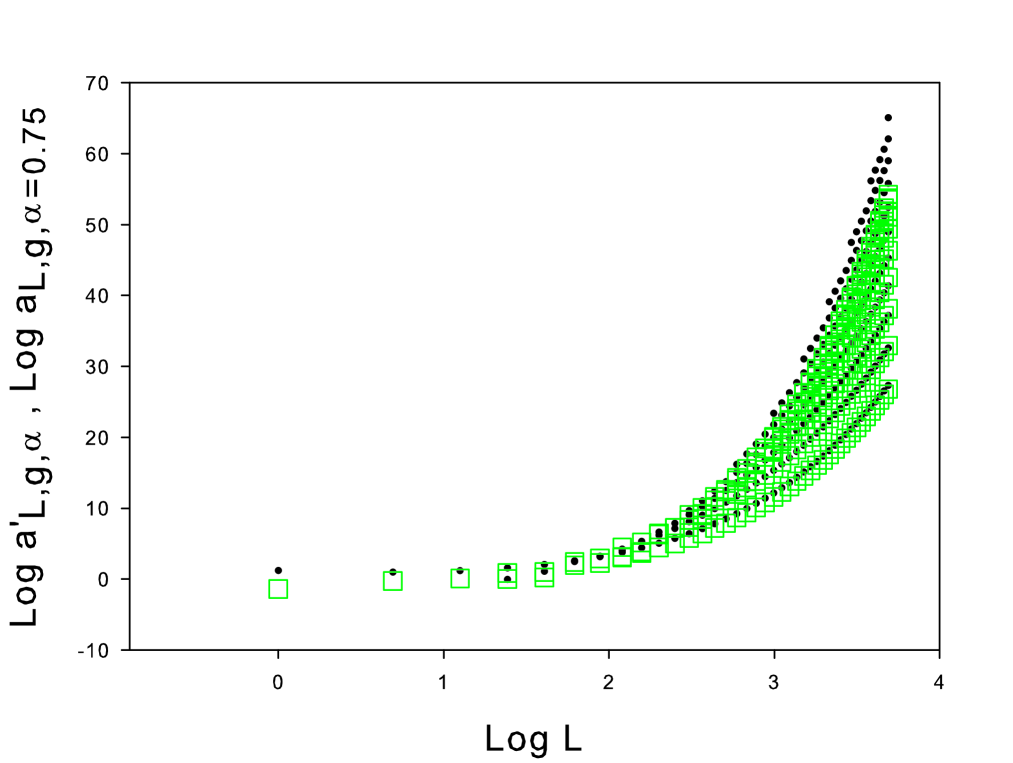
The plot (fig. 3) of the asymptotic formula for (black dotted curve) with the numerically calculated values (green boxed curve) for different ’s (shown for ) clearly indicates that the asymptotic formula of the model in 18 needs to be changed to give the asymptotic behaviour of the extended matrix model of RNA folding 16 . The curves for different ’s (shown here for only , fig. 3) move further and further away from the asymptotic expression curve 18 as goes from 0 to 1. This behaviour is studied and the correct asymptotic expression for the extended matrix model is found.
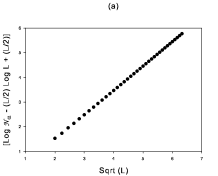
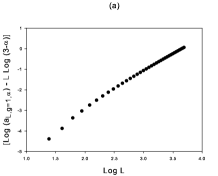
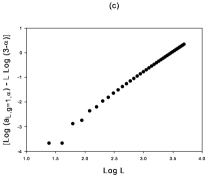
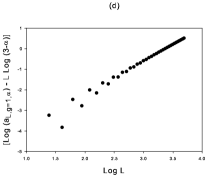
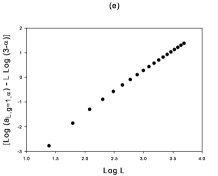
We start with the asymptotic expression of , where . Taking Log on both of the sides and fixing (for simplicity) we get . In Log (), L dependence is present in the form of L and LogL. We are interested in the large L behaviour so we first look for the dominant L dependence. The linear fits to the plots of verses L in table 2 (Slope 1) shows that the slopes of the numerical curves for different ’s are not the same and not equal to the slope of the asymptotic curve (slope should be Log 3 for a plot between and L according to 18 ). This indicates an dependence in the factor 3 of the universal part of which we represent by in table 2 [where ]. We write the asymptotic formula by replacing 3 with . The expression for after taking Log on both of the sides becomes . To determine the form of x(), we plot verses which is a straight line with and . In the same way as the asymptotic expression for in 18 had the universal term , we find to be for all . We therefore have . The universal part in the 18 has been modified to for the extended matrix model 16 . The asymptotic formula gets modified to .
| Slope 1 | Slope 2 | ||
|---|---|---|---|
| 0 | 1.198 | 3.313 | 1.646 |
| 0.25 | 1.109 | 3.03 | 1.639 |
| 0.5 | 1.012 | 2.75 | 1.633 |
| 0.75 | 0.9065 | 2.476 | 1.623 |
| 1 | 0.7891 | 2.2 | 1.655 |
| Analytical | 1.24 | 3.4556 | 1.495 |
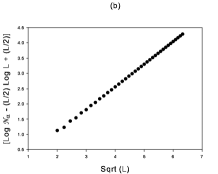
Analyzing the Log(L) dependence now, we assume that there exists an dependence in the exponent of L which we represent by . We can therefore write from the modified equation after taking Log on both the sides and substituting , . Linear fitted plots of [] verses Log (L) for different values is shown in fig. 4. The figure shows a continuous separation of data points belonging to the even and odd lengths as is increased from 0 to 1. There are two distinct lines at small lengths L which merge into a single line at higher lengths L. For the points for odd lengths vanish completely from the plot. The slopes [table 2, Slope 2] show that the difference between analytical and numerical values for different is 0.01, which is small. The Log(L) term therefore shows no significant dependence. So we fix . This gives the asymptotic formula of the number of diagrams at a fixed length L, genus g and , for the extended matrix model of RNA as
| (5) |
The asymptotic formula [eq. (5)] thus obtained is plotted with the numerically found values for different ’s [fig. 5, shown here for only ] and it is seen that the formula matches with the numerical results for large L. To verify the final form of the formula, we substitute different ’s and in eq. (5) and plot verses LogL. The slopes are found to be 1.495 in all the cases. This result will hold for any genus g, though we have shown here the result for only . It is interesting to note here that the universality of for the extended matrix model changes from in 18 to when (the completely paired base region).
The asymptotic behaviour of and for the model with perturbation on n bases is the same as for the model with perturbation on all the bases except that is replaced by [as is evident from the expression of the exponential generating function given by eq. (3) with in place of ]. Thus we can write the asymptotic expressions of the genus distribution functions for a perturbation acting on n bases as
| (6) |
and,
| (7) |
The asymptotics for the extended matrix models therefore show marked changes in the presence of the perturbation in the universal term of and in the total number of structures of the model in 18 .

IV CONCLUSIONS
In this work, we develop on the footsteps of the extended matrix model of RNA folding proposed in 16 , the effect of an external perturbation on only one nucleotide in the polymer chain of length L. We argue that in the exponential generating function of the partition function of model in 16 will be replaced by if perturbation acts on only one nucleotide in the chain. Further, we generalize this result to a finite number of perturbations on the nucleotides of the chain, where in the exponential generating function of the partition function gets replaced by , eq. (3).
Next, we find numerically the asymptotic behaviour of the genus distribution functions for the extended matrix model of RNA folding in 16 and the n-NP model. We find from the numerical analysis that the universality of , found in 18 , changes to when the perturbation acts on all the bases in the polymer chain [which becomes when the perturbation is on n bases]. The power law term of 18 remains the same for the asymptotic formula of in the extended matrix models with perturbation on all the bases 16 and on n bases. The total number of diagrams also changes from its form in 18 to with the term in 18 changing to for the matrix model with perturbation on all the bases [which becomes when the perturbation is on n bases]. The most striking change found in the universality of is when takes the value 1 (and ) as the universality goes from to and in the term in the exponent of which goes to zero when and . It is shown in fig. 2 and fig. 4 that as is increased from 0 to 1 in steps of 0.25, the points corresponding to even and odd lengths of the chain start splitting up into two different curves at small lengths, but converge into a single linear curve as the length is increased. Note that at small lengths, this difference is most pronounced for , for both and . The plots of and [fig. 2(e) and fig. 4(e) respectively] show the absence of odd length data points. It is interesting to note that the genus distributions show different behaviour at small and large lengths (analysis has been done for ). The large L (asymptotic) behaviour of the distribution functions [eq. (4), (5), (6) and (7)] found for the RNA matrix model with external perturbation show prominent changes.
We have studied the effect of an external perturbation on the RNA matrix model. In order to compare the results of the matrix model of RNA folding with external perturbations (discussed here and in 16 ) with experiments (where the perturbations may be due to the constant forces discussed in the introduction or due to natural processes like transcription and translation taking place inside a living cell), a more detailed study will be undertaken.
ACKNOWLEDGEMENTS
We would like to thank Profs. H. Orland and G. Vernizzi for very valuable and encouraging e-discussions. The work was financially supported by CSIR Project No. .
References
- (1) B. Onoa and I. Tinoco Jr., Curr. Opin. Struct. Biol. 14, 374-379 (2004).
- (2) T. E. Fisher, P. E. Marszalak and J. M. Fernandez, Nature Struct. Biol. 7, 719-724 (2000).
- (3) J. F. Marko and E. D. Siggia, Macromolecules 28, 8759-8770 (1995).
- (4) U. Bockelmann, B. Essevaz-Roulet and F. Heslot, Phys. Rev. Lett. 79, 4489-4492 (1997); Phys. Rev. E 58, 2386-2394 (1998).
- (5) B. Essevaz-Roulet, U. Bockelmann and F. Heslot, Proc. Natl. Acad. Sci. USA 94, 11935-11940 (1997).
- (6) A. D. Mehta, M. Rief, J. A. Spudich, D. A. Smith and R. M. Simmons, Science 283, 1689-1695 (1999).
- (7) U. Gerland, R. Bundschuh and T. Hwa, Biophys. J. 81, 1324-1332 (2001).
- (8) U. Gerland, R. Bundschuh and T. Hwa, Phys. Biol. 1, 19-26 (2004).
- (9) C. Hyeon, G. Morrison and D. Thirumalai, cond-mat.soft/0808.0480.
- (10) P. T. X. Li, D. Collin, S. B. Smith, C. Bustamante and I. Tinoco Jr., Biophys. J. 90, 250-260 (2006).
- (11) C. Hyeon and D. Thirumalai, Proc. Natl. Acad. Sci. USA 102, 6789-6794 (2005).
- (12) J. Liphardt, B. Onoa, S. B. Smith, I. Tinoco and C. Bustamante, Science 292, 733-737 (2001).
- (13) J. Liphardt, S. Dumont, S. B. Smith, I. Tinoco and C. Bustamante, Science 296, 1832-1835 (2002).
- (14) B. Onoa, S. Dumont, J. Liphardt, S. B. Smith and I. Tinoco Jr., Science 299, 1892-1895 (2003).
- (15) P. T. X. Li, C. Bustamante and I. Tinoco Jr., Proc. Natl. Acad. Sci. USA 104, 7039-7044 (2007).
- (16) I. Garg and N. Deo, cond-mat/0802.2440v2.
- (17) H. Orland and A. Zee, Nucl. Phys. B 620[FS], 456 (2002).
- (18) G. Vernizzi, H. Orland and A. Zee, Phys. Rev. Lett. 94, 168103 (2005).