A large area plastic scintillator detector array for fast neutron measurements
Abstract
A large area plastic scintillator detector array( 11 m2) has been set up for fast neutron spectroscopy at the BARC-TIFR Pelletron laboratory, Mumbai. The energy, time and position response has been measured for electrons using radioactive sources and for mono-energetic neutrons using the 7Li(p,n1)7Be*(0.429 MeV) reaction at proton energies between 6.3 and 19 MeV. A Monte Carlo simulation of the energy dependent efficiency of the array for neutron detection is in agreement with the 7Li(p,n1) measurements. The array has been used to measure the neutron spectrum, in the energy range of 4-12 MeV, in the reaction 12C+ 93Nb at E(12C)= 40 MeV. This is in reasonable agreement with a statistical model calculation.
keywords:
Plastic scintillator detector array for fast neutrons, TOF technique, measured neutron spectra in 7Li(p,n1)7Be∗(0.429 MeV) at Ep = 6.3 to 19 MeV and 12C+93Nb at E(12C) = 40 MeV., , , , , , and
1 Introduction
The measurement of neutron spectra is important in many nuclear reaction studies. One example is the study of the statistical decay of compound nuclei populated in low energy fusion reactions. In particular, it would be interesting to make a measurement in the 12C+93Nb reaction because an unusual structure has been reported in the angular momentum gated proton and alpha spectra in this reaction at E(12C) = 40 and 42.5 MeV [1, 2]. This would require measurements of neutron spectra down to 0.1 b sr-1 MeV-1 with an energy resolution EFWHM/E 10. A large area neutron detector is needed to meet these requirements. Another example of interest is the study of shell effects, and their damping with excitation energy, on the nuclear level density(NLD) in the region of doubly closed shell nuclei. The variation of NLD for a wide range of the N/Z ratio, where N and Z are the neutron and proton numbers in a nucleus, using radioactive ion beams is an interesting topic that can be addressed. A large neutron detector array would also be useful in coincidence measurements involving neutrons, e.g. study of fission dynamics and neutron decay following the transfer reaction.
Plastic scintillators have been widely used for neutron measurements by the time of flight (TOF) technique because of their fast response and the relatively low cost, enabling the construction of a large detector system. A long scintillator detector with photomultiplier tubes (PMTs) at either end was first used by Charpak et al.[3]. While economizing on the number of PMTs for a given areal coverage, the detector was shown to have good TOF and position resolution using the timing information from both the PMTs. An array consisting of a number of such long scintillators stacked one above the other is a cheaper and simpler alternative to an array of a larger number of discrete detectors with a comparable efficiency. For example a 1 m2 array with 16 bars of cross section 6 cm 6 cm needs 32 PMTs of 5 cm diameter. An array of similar overall dimensions but more granularity could have 256 plastic scintillators each of size 6 cm6 cm and would require 256 PMTs. An array of 49 square plastic scintillators of size 14 cm14 cm could be viewed by 12.7 cm diameter PMTs or 5 cm diameter PMTs with light guides. Either option would increase the complexity and cost of the detector system. We have chosen to set up a 1 m1 m plastic detector array consisting of 16 long scintillators.
The paper is organized in four sections. The first section gives details of the detector array. In the next section the measured time, position and energy response to electrons and monoenergetic neutrons is described. The electron measurements were carried out using radioactive sources while those for neutrons were done using the 7Li(p,n1)7Be* (0.429 MeV) reaction at proton energies from 6.3 to 19 MeV. The third section outlines the Monte Carlo simulation of the response of the plastic detector to fast neutrons. Finally, an example of a measured neutron spectrum in the reaction 12C+93Nb at E(12C) = 40 MeV is presented to demonstrate the capability of the neutron detector array.
2 Description of Neutron Detector Array
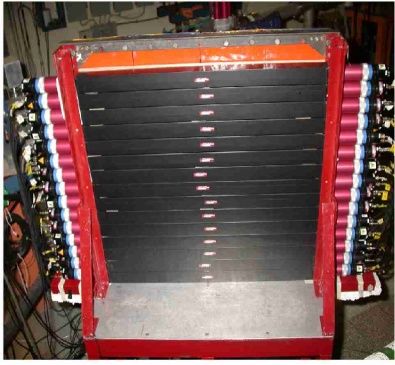
The neutron detector array consists of 16 plastic scintillator bars (equivalent to Bicron BC-408 and procured from SCIONIX, Holland) of square cross section[4]. Each bar has a dimension 6 cm6 cm100 cm and is coupled to two 5 cm diameter XP2020 PMTs, one each at either end. The scintillator has a light output of 65% compared to that of anthracene, a scintillation decay time of 4 ns and a bulk attenuation length 3 m. The polyvinyl toluene based plastic scintillator has a carbon to hydrogen ratio of 1:1.1. The density and refractive index of the scintillator are 1.03 gm/cm3 and 1.58, respectively. The spectral sensitivity of the XP2020 PMT peaks at 420 nm, with a quantum efficiency of 25 %, and matches the emission spectrum of the plastic scintillator. The PMTs have a fast response time (rise time 1.3 ns) and a gain of 107 at about 2 kV bias voltage. The PMTs are powered by a 32 channel programmable high voltage power supply developed in-house [5]. The plastic scintillators are stacked one above the other on a stand with wheels for horizontal movement of the array and a four bolt arrangement to adjust the height and level. A photograph of the array is shown in Fig. 1.
Lead (Pb) sheets of total thickness 25 mm can be placed in front of the array to reduce the low energy -ray background while not significantly attenuating the neutrons from the target. Apart from the target neutrons directly reaching the detector, there are those following a circuitous path, such as scattering from various materials in the experimental hall. In order to compare the contributions from these two sources, a 30 cm thick mild steel (MS) shield consisting of several plates of increasing transverse dimension was fabricated. This can be placed near the target to block the target neutrons from reaching the array. The measurements with and without the MS shield allows an estimation of the contribution due to the scattered neutrons that are not in the line of sight of the target.

3 Time, position and energy response
The important parameters deduced from the time and integrated charge
of the PMT signals are as follows
(a) The time of flight(TOF), derived from left and right PMT trigger times (TL, TR), with respect to a reference time, is given by
| (1) |
where Toffset is independent of the position of the interaction point.
(b) The position (X) of interaction point is obtained from the time difference between TL and TR
| (2) |
In addition, the position information can also be obtained from the integrated charges of the left and right PMT signals (QL, QR) as
| (3) |
(c) The integrated charge information is necessary for the determination of neutron detection efficiency. The geometrical mean of two signals
| (4) |
is roughly independent of the position and is proportional to the energy deposited in the detector (see for example Ref.[6]).
3.1 Response to electrons
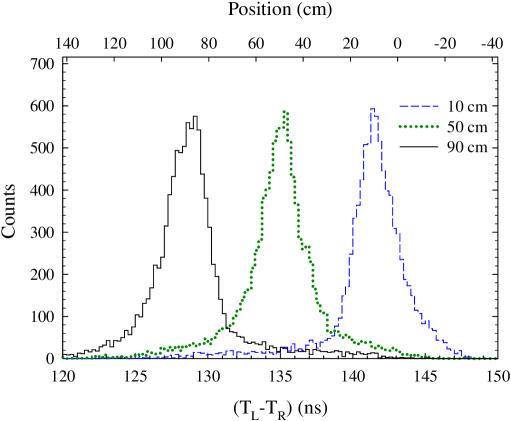
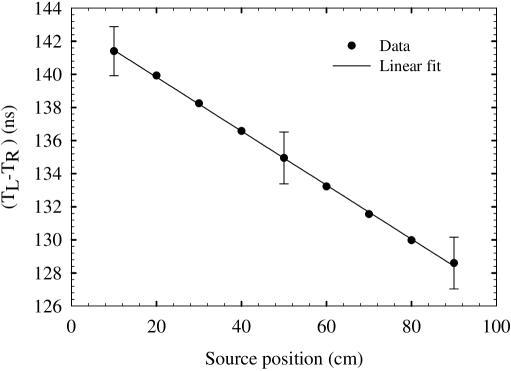
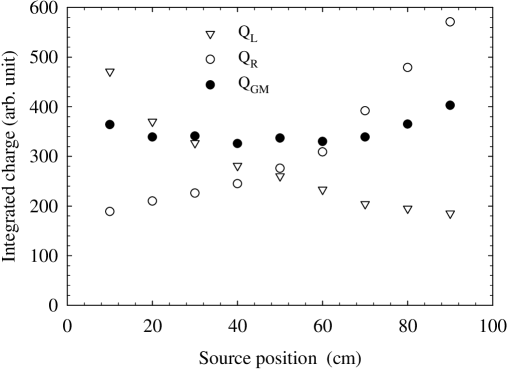
The time, position and energy response of the plastic scintillator was measured with collimated -rays from various radioactive sources. The 511 keV -ray from 22Na was detected in a plastic bar in coincidence with the complementary 511 keV -ray detected in a 8 cm thick BaF2 detector with a hexagonal cross section and having a face to face distance of 6 cm. Both TL and TR, measured with respect to BaF2, were recorded. The TOF and position information were extracted using the expressions given earlier. The TOF spectrum obtained is shown in Fig. 2. The full width at half maximum (FWHM) is 1.4 ns, which includes the contribution from the electronics as well as the transit time spread of PMTs. Fig. 3 shows the position spectrum derived from TL and TR. The position resolution is 20 cm and the response is linear as shown in Fig. 4. For a given amount of energy deposition the integrated charge from a PMT varies by a factor of 3 from one end to other as shown in Fig. 5. The geometric mean is almost independent of position, within 5%, except at the ends where it increases up to 15%.
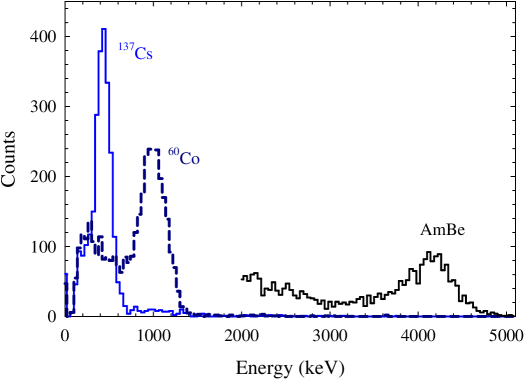
The energy resolution for mono-energetic electrons produced within the plastic scintillator was measured using the response to a recoiling electron in the Compton scattering of -rays. The back scattered photon was detected in a BaF2 detector for tagging on the energy of the electron. -rays from radioactive sources 137Cs, 60Co and 241Am-Be were collimated using appropriately placed lead bricks to illuminate a 2 cm wide portion of the plastic scintillator.
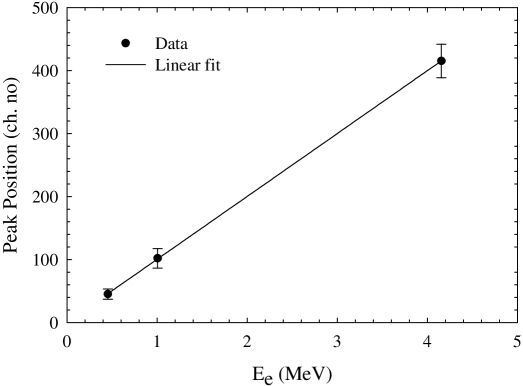
The source and collimator assembly was moved along the length of the plastic to measure the position dependence of the response. The measured energy spectra of the electrons for the central source position are shown in Fig. 6. The energy response is linear as shown in Fig. 7. The EFWHM/E was measured to be 35% and 12% for 450 keV and 4.15 MeV electrons, respectively, produced at the centre of the plastic scintillator. This was almost independent of the position in the plastic. The finite size of the BaF2 detector and the illuminated zone in the plastic had an insignificant contribution to the measured energy resolution.
3.2 Response to monoenergetic neutrons
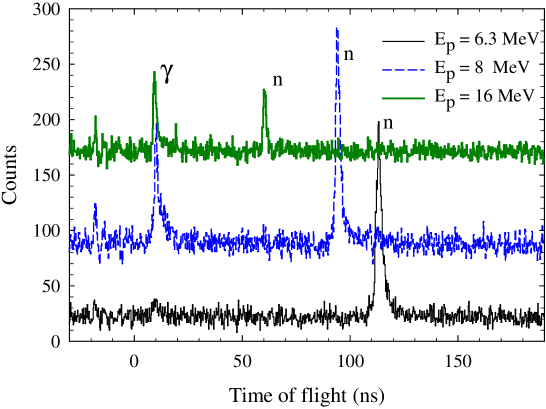
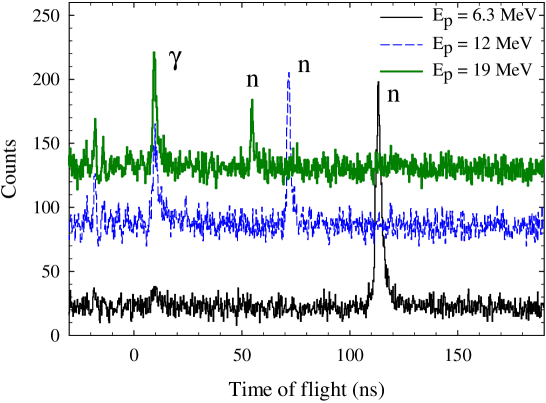
Monoenergetic neutrons were produced by bombarding a 2 mg/cm2 thick natLi metal target with proton beams of energies 6.3, 8, 12, 16 and 19 MeV from the Mumbai Pelletron. The neutrons produced in the reaction 7Li(p,n1)7Be∗ were detected by one of the plastic scintillators in coincidence with the 429 keV -ray emitted from the first excited state of 7Be. The -ray was measured in the BaF2 detector, mentioned earlier, placed at 2 cm from the target. The plastic scintillator detector was placed at a distance of 3 m from the target and at 45∘ with respect to the beam direction. The TOF of the events in the plastic scintillator was measured with respect to the BaF2 detector using time to amplitude converters (TAC) calibrated using a high precision time calibrator.
The measured TOF spectra for the neutron group populating directly the 0.429 MeV excited state in 7Be are shown in Figs. 8 and 9. The peaks in the TOF spectra correspond to neutrons of energies 3.7, 5.3, 9.0, 12.7, 15.4 MeV, respectively. The relative time differences between the neutrons and -ray peaks decrease with increase in neutron energy and agree with the expected values within 2%.
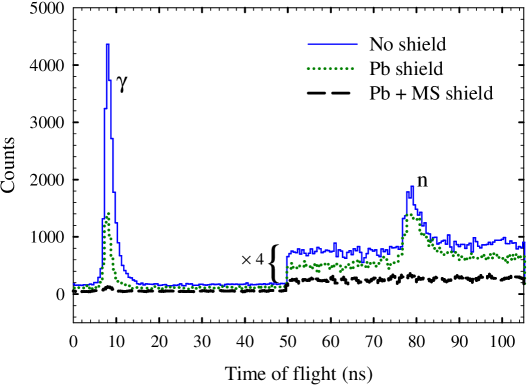
In order to assess the attenuation of neutron and -rays by the lead shield a measurement was made at Ep=6.3 MeV. In the same measurement the contribution of scattered neutrons were assessed by placing the MS shield near the target. The TOF spectra are shown in Fig. 10. A comparison of the spectra shows that the lead shield attenuates the neutron group by 10% and the -rays by 70%. Moreover, the contribution from the scattered neutrons is negligible (with an upper limit of 5%).
3.3 Efficiency measurement for monoenergetic neutrons
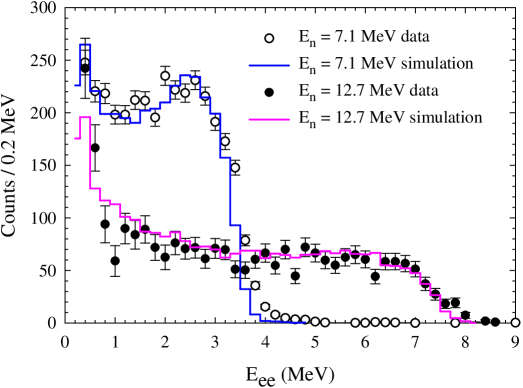
The efficiency of plastic detector for monoenergetic neutrons was measured using the same reaction. The proton beam energies were 10 and 16 MeV corresponding to neutron energies of 7.1 and 12.7 MeV, respectively. One plastic bar was used to measure neutrons in coincidence with 429 keV -rays detected in an array of seven close-packed hexagonal BaF2 detectors of dimensions mentioned earlier. The plastic detector was placed at 45∘ with respect to the beam and 1.5 m from the target. The BaF2 array was placed 2 cm from the target. The anode signal from PMT of each BaF2 detector was amplified and split to measure energy and pileup. The split signals were fed to two charge sensitive analog to digital converters (QDC) with gate widths of 2 s and 200 ns. The dynode signals from both left and right PMTs of the plastic scintillator were amplified for pulse height response and the anode signals were processed to measure TOF with respect to the logical OR of BaF2 timing signals. The energy calibrations of plastic and BaF2 detectors were done using 137Cs and 60Co -ray sources. The energy spectrum of the plastic detector for a given neutron energy was obtained by gating on the corresponding peak in the TOF spectrum and subtracting the random contribution. These are shown in Fig. 11. Here the energy corresponds to the electron equivalent energy () of the charged particles produced by neutron interaction in the scintillator.
The efficiencies of the plastic scintillator for the two neutron energy groups mentioned above were estimated as follows. In the data analysis the number (M) of BaF2 detectors detecting the 429 keV -ray in coincidence was generated event by event. The events with M1 obviously correspond to random events. The yield of the n1 group at each proton energy was obtained from the TOF spectra for the condition of M=1 and E250 keV. The neutron detection efficiencies were obtained from these yields, the target thickness and the angle dependent cross section of the n1 group. This cross section was taken from Poppe et al. [7]. The target thickness was obtained from the singles -yield in all seven BaF2 detectors measured at 16 MeV proton energy. The efficiency of the BaF2 array for 429 keV -rays was calculated as 26.7 % using the Electron Gamma Shower (EGS) simulation program [8]. The target thickness extracted using the angle integrated cross section from Ref.[7] was 2.8 0.3 mg/cm2. The neutron detection efficiencies estimated from the above procedure were divided by the geometrical efficiency of the detector to get the intrinsic efficiencies. These are shown in Table 1. These measured efficiencies, however, include the contributions of the scattered neutrons from the BaF2 array. This effect was estimated to be 7% from the Monte Carlo simulation discussed in the next section.
| En(MeV) | Measured | Simulated | Simulated |
|---|---|---|---|
| efficiency (%) | efficiency(%) (A) | efficiency(%) (B) | |
| 7.1 | 27.4 2.8 | 26.4 | 27.2 |
| 12.7 | 22.7 3.2 | 20.8 | 22.3 |
4 Monte Carlo simulation of the neutron detector array
The simulation of the response of the plastic detector array to fast neutrons has been performed by a Monte Carlo program developed in our laboratory. The processes by which neutrons of energy up to 20 MeV interact with the detector material were taken as (a) elastic scattering on hydrogen and 12C, (b) inelastic scattering to the 4.4 and 7.6 MeV states in 12C and (c) 12C(n,), 12C(n,p) reactions. Among these the first process is the dominant one. The cross sections were taken from Ref. [9].
In the program, neutrons of a given energy are made incident on the plastic array, placed at a certain distance from the source, assuming angular isotropy. The energy dependent total interaction cross section determines whether the neutron scores a hit in the detector. If it scores a hit, the interaction process is chosen randomly on the basis of the relative magnitude of the respective cross section. If the process is elastic scattering on hydrogen, the scattering angle in the centre of mass (c.m.) system is chosen randomly. This decides the energy of the recoiling proton which is assumed to be fully deposited in the detector. In (n,p), (n,) and (n,n processes, the energy of p and were calculated assuming isotropic emission in the c.m. system. For the (n,n process, the 4.4 MeV -ray deposits energy depending on the attenuation length and the available path in the scintillator for a given propagation direction. The electron energy equivalent (Eee) of the deposited energy for heavy charged particles are obtained using the following empirical expression
| (5) |
The choice of the parameters a1 to a4 was guided by those given by Cecil et al. [9] with some fine tuning. These are presented in Table 2.
| Particles | a1 | a2 | a3 | a4 |
|---|---|---|---|---|
| Proton | 0.97 | 7.6 | 0.1 | 0.90 |
| Alpha | 0.41 | 5.9 | 0.065 | 1.01 |
The light output due to recoiling 12C nuclei is small and therefore neglected. The time of occurrence of the PMT signal was derived from the neutron flight times and the scintillation photon propagation time. The simulated left and right PMT times (TL, TR) and Eee from each event were used to generate TOF and Eee spectra provided Eee is greater than the experimental threshold. The TOF spectrum for a given neutron energy shows a peak with a width arising from the intrinsic time resolution of the plastic scintillator as well as the variation in the interaction position. The shapes of the simulated Eee spectra at neutron energies of 7.1 and 12.7 MeV compare well with the experiment as shown in Fig. 11.
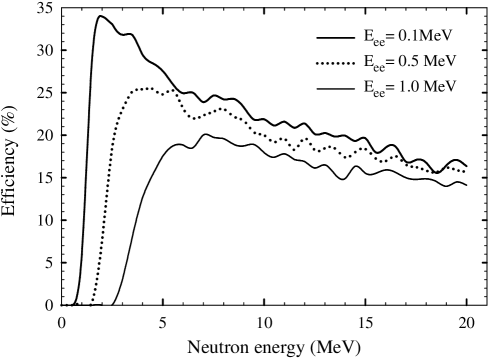
The ratio of detected events to the number of incident neutrons gives the intrinsic neutron efficiency. The simulated intrinsic efficiencies of one plastic scintillator for neutrons of energies 7.1 and 12.7 MeV were obtained for the experimental threshold (Eee) of 250 keV. These are shown in the third column of Table 1. The energy dependent neutron efficiencies for various thresholds are shown in Fig. 12 for a single plastic scintillator with the lead shield in front. It can be seen that while an increase in Eee does not substantially change the neutron detection efficiency at higher energies, it increases the effective threshold energy for neutron detection.
The presence of the BaF2 array near the target is a source of scattered neutrons, some of which reach the plastic detector. In order to estimate their contribution to the measured efficiencies, the simulation program was extended to include the elastic and non-elastic processes from Ba and F in BaF2. The increase in the TOF of the elastically scattered neutrons is too small to distinguish from that of the neutrons directly reaching the plastic. The non-elastic processes lead either to a loss of neutrons as in the (n,p), (n,), (n,) reactions or to a low energy neutrons from the (n,n′) and (n,2n) reactions. These processes, therefore, do not contribute to the counts in the TOF peak. The intrinsic efficiencies in the presence of BaF2 are renormalised by the extra contribution in the TOF peak essentially due to elastic scattering. These are shown in the last column of Table 1. The renormalised efficiencies are increased by 7%. These are however the upper limits because we have assumed isotropy in the scattering processes whereas the limited elastic scattering data shows forward peaked distribution (see for example Ref. [10]). It may be mentioned that the elastic scattering process on BaF2 does not lead to any significant change in energy spectrum shown in Fig. 11.
5 Measurement of neutron spectrum in 12C + 93Nb reaction at E(12C) = 40 MeV
A collimated, pulsed 12C beam (9.4 MHz) of 40 MeV from the Mumbai Pelletron bombarded a self supporting 93Nb target of thickness 0.5 mg/cm2. Neutron spectra were measured with 15 of the 16 plastic scintillators. The detector array was placed at 2.2 m from the target and at 135∘ with respect to the beam direction. It was covered with a 25 mm thick lead shield. The beam collimators and the beam dump were shielded with lead bricks and borated paraffin blocks to reduce the gamma and neutron background. The measurements were made in coincidence with low energy -rays originating from the yrast transitions of the fusion residues. These -rays were detected in an array of 14 bismuth germanate (BGO) detectors [1]. The BGOs were shielded from background gamma rays coming from the collimators and beam dump with suitably placed lead bricks. The schematic experimental setup is shown in Fig. 13.

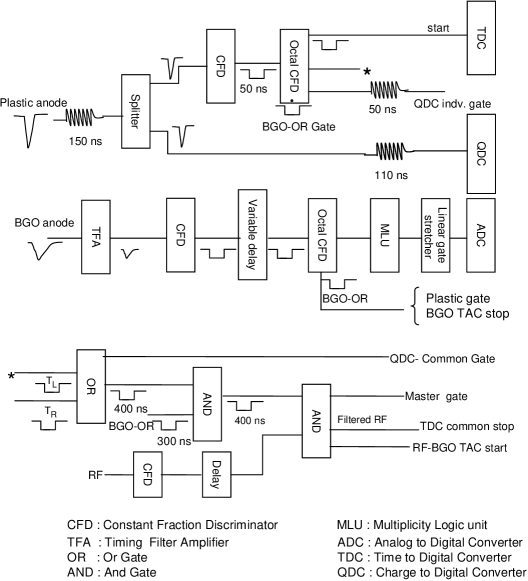
The total efficiency of BGO array for 662 keV -ray, measured using a 137Cs source kept at the target position, was 65%. The schematic electronic block diagram is shown in Fig. 14. The high voltage applied to the PMTs of individual plastic scintillator detectors was adjusted to provide the same pulse height for 4.44 MeV -ray from 241Am-Be source placed at the centre of the detector. The full energy range was Eee 28 MeV. The signal from the anode was split into two parts. One was fed to a QDC for the energy measurement and the other was sent to a constant fraction discriminator (CFD) to generate the timing signal. The CFD thresholds were set at 100 keV. One of the CFD outputs was sent to the corresponding start channel of the time to digital converter (TDC) filtered through the condition that at least one of the BGO detectors fire. The second CFD output was used to generate the QDC gate. The third output was used to define a valid event by combining signals from all the scintillators in a logic OR unit. This OR output (Plastic-OR) was used for the common QDC gate.
The timing signals from the BGO detectors were time matched and sent to a multiplicity logic unit (MLU) [11]. The time matched OR-output (BGO-OR) was used to filter the plastic CFD signals as mentioned above. A coincidence between the BGO-OR and the Plastic-OR was used to filter the RF signal derived from the beam pulsing system. The filtered RF was used as the common stop for all the TDC channels. The left and right times of each plastic scintillator were measured with respect to the filtered RF. In addition, the integrated charges (QL, QR), number of BGO detectors firing simultaneously (fold) and the RF-BGO time were recorded in an event by event mode. The time and energy calibrations were done as mentioned earlier.
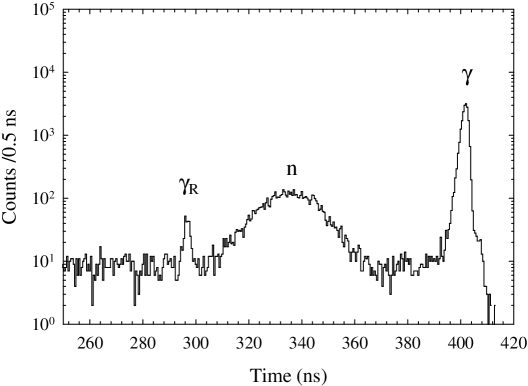
In the offline analysis, the TOF was derived from TL and TR. The zero of the time scale was determined from the prompt gamma peak in the TOF spectrum. The position information was obtained from the difference between the left and right time. Four position gates were decided by inspecting the position spectra. A TOF spectrum for a typical plastic scintillator with position gating on a quarter of its length and at least one BGO in coincidence is shown in Fig. 15. The random background reduces drastically with the BGO coincidence requirement allowing the measurement of neutrons with low production cross section. The fold gated neutron time of flight spectra, after subtracting the random background for each position cut, were converted to energy spectra.
The energy dependent efficiencies of the neutron detectors of the array for different position gates were calculated using the Monte Carlo simulation program mentioned earlier. The energy threshold used in the simulation was the same as that used in deriving the experimental spectra. The calculated efficiencies were used to obtain the energy differential cross-sections in the c.m. system. The c.m. spectrum for each fold was derived as the average of the corresponding spectra from all the 15 detectors and four positions. The energy differential cross sections in the c.m. system for fold 1 is shown in Fig. 16.

A statistical model calculation using the simulated Monte Carlo CASCADE (SMCC) [12] code was performed to compare with the measured spectra. The calculation, done for the projectile energy 39.5 MeV (at the centre of the target) and a fusion cross-section of 188 mb, yielded the population matrix where refers to the residue spin. The to F (fold) response function was calculated using a Monte Carlo program with BGO efficiency and inter-detector cross talks as inputs and assuming the multiplicity with =1.4. Using this response function, the fold gated neutron spectra were obtained from . The shape of the experimental fold gated neutron spectra agree well with those given by the SMCC calculation for a level density parameter of A/8.5 MeV-1. This level density parameter is similar to that derived from the analysis of the proton spectra from an earlier measurement in the same system [1]. Fig. 16 shows the calculation for F1 with an overall multiplication factor of 0.7.
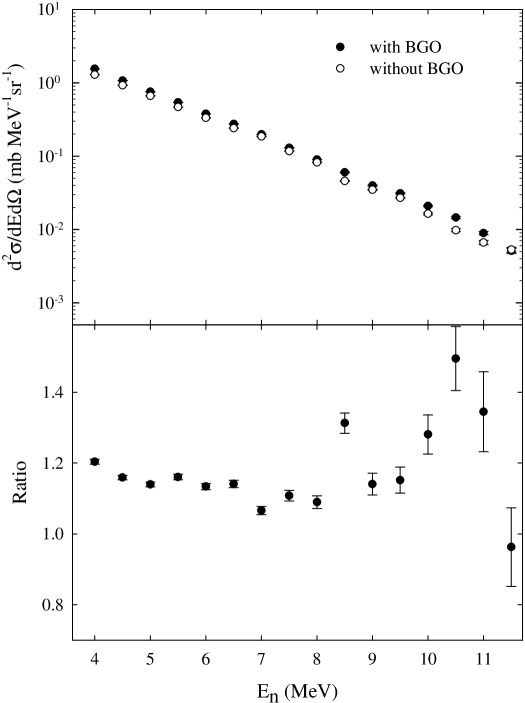
The presence of the BGO detector array also contributes to scattered neutrons some of which are detected in the plastic array. In order to assess this contribution, the neutron TOF measurements were performed with and without the top BGO detector array. Only the lower BGO array was used to generate the gamma ray multiplicity in both the cases. The measured differential neutron cross sections and their ratio for these two cases are shown in Fig 17. The presence of the top BGO array gives rise to an additional 13% contribution, almost independent of neutron energy, which is in reasonable agreement with the Monte Carlo simulation. This implies an additional 26% contribution due to the presence of the full BGO -multiplicity array. Thus the measured cross sections shown in Fig. 16 get reduced by a factor of 1.26 and become 1.8 times lower than the calculated values. This discrepancy could arise from 1) the uncertainty in fusion cross section used in the SMCC calculation and 2) the presence of low energy electromagnetic transitions in the residues which are detected with poor efficiency and, hence, affect the Jres to M prescription used in the calculation.
6 Summary
In summary, we have set up a 11 m2 plastic detector array for neutron time of flight measurements at the BARC-TIFR Pelletron laboratory. We have measured the response of the detector to electrons using radioactive sources and mono-energetic neutrons using the 7Li(p,n1) reaction. A Monte Carlo simulation program has been developed to simulate the response of the detector for neutrons and is in agreement with our measurements. The detector array was used to measure the energy differential neutron cross sections in the reaction 12C + 93Nb at E(12C) = 40 MeV in coincidence with a 14-BGO gamma multiplicity array. The measured spectral shape is in reasonable agreement with a statistical model calculation.
Acknowledgements
We thank the Pelletron staff for accelerator operation, Mechanical
Design and Prototype Development Section, BARC, for fabricating the
mechanical stand and the lead shield and H. H. Oza and M. S. Pose
for their help during the experiment. We would also like to thank
the anonymous referee for his critical comments.
References
- [1] A. Mitra et al., Nucl. Phys. A 765 (2006) 277; ibid A 707 (2002) 343.
- [2] A. Mitra et al., Proc. DAE-BRNS Symp. on Nucl. Phys. 47B (2004) 220.
- [3] G. Charpak, L. Dick, L. Feuvrais, Nucl. Instr. and Meth. 15 (1962) 323.
- [4] see SCIONIX website http://www.scionix.nl
- [5] A. Manna, A. Mishra, S.G. Thombare, P.K. Mukhopadhyay, J. Bhattacharya, Proc. National Symp. on Nuclear Instrumentation, IGCAR, Kalpakkam, India (2004)p93
- [6] L. Karsch, A. Bhm, K. -Th. Brinkmann, L. Demirrs, M. Pfuff, Nucl. Instr. and Meth. A 460 (2001) 362.
- [7] C.H. Poppe, J.D. Anderson, J.C. Davis, S.M. Grimes, C. Wong, Phys. Rev. C 14 (1976) 438.
- [8] W. Nelson, H. Hirayama, D. Roger, Stanford University Report SLAC-265 1985.
- [9] R.A. Cecil, B.D. Anderson, R. Madey, Nucl. Instr. and Meth. 161 (1979) 439.
- [10] P. Kuijper, J.C. Veefkind and C.C.Jonker, Nucl. Phys. A 181 (1972) 545.
- [11] D.A. Gothe, V. Nanal, R.G. Pillay, Proc. DAE-BRNS Symp. on Nucl. Phys. 46B (2003) 506.
- [12] D.R. Chakrabarty, Nucl. Instr. and Meth. A 560 (2006) 546.