What Makes an Accretion-Powered Millisecond Pulsar?
Abstract
We investigate the dependence of pulse amplitudes of accreting millisecond pulsars on the masses of the neutron stars. Because the pulsation amplitudes are suppressed as the neutron stars become more massive, the probability of detection of pulsations decreases in systems that have been accreting for a long time. However, the probability of detectable pulsations is higher in transient systems where the mass accretion is sporadic and the neutron star is likely to have a low mass. We propose this mechanism as the explanation of the small number of millisecond X-ray pulsars found to date, as well as their emergence as fast pulsars mostly in transient, low- systems. This mechanism can also quantitatively explain the lack of pulsars in the majority of LMXBs.
1 Introduction
The scarcity of accreting neutron stars with detectable millisecond spin frequencies has been a puzzle since the suggestion of Alpar et al. (1982) and Radhakrishnan & Srinivasan (1982) that the millisecond radio pulsars are spun-up remnants of neutron stars in low-mass X-ray binaries (LMXBs). Given the magnetic field distribution of recycled radio pulsars between G, these progenitors are expected to possess a field of comparable strength, which plays a dynamically important role in the accretion process. In particular, accretion is likely to proceed by channeling matter onto the polar caps, which can then result in modulations in the X-ray lightcurves of the accreting neutron stars that can be detected as millisecond X-ray pulsars (hereafter ms pulsars). However, deep searches until 1998 yielded no sign of these progenitors.
The discovery of a small number of ms pulsar sources (e.g., Wijnands & van der Klis 1998; Markwardt et al. 2002; Galloway et al. 2002, 2005) gave the first solid support to the idea of recycling. To date, there are eight accreting neutron stars that show periodic modulations in their persistent X-ray lightcurves, with frequencies ranging between 182 and 599 Hz (see Table 2; see also the discussion for detections of intermittent pulsations in the bulk LMXB population). These discoveries, at the same time, raised numerous questions, two of which are important for the present paper: What conditions lead to the generation of a ms pulsar? How do these sources differ from the remaining population of LMXBs?
A potential clue into their nature comes from the fact that companions of all the discovered ms pulsars have peculiar properties that distinguish them from the general population of LMXBs, of which are known (Liu et al. 2007). Specifically, the companions have extremely low masses and are found in tight binary orbits (40 min4 h), where mass transfer is gravitationally driven, resulting in very low time-averaged mass accretion rates. This is corroborated by the X-ray observations of their weak and sporadic outbursts. If the mass accretion rates have remained low over the lifetime of the binary, then the overall effect is a very small amount of mass accreted onto the neutron star.
Several possible explanations have been proposed for the absence of pulsations from the bulk of the LMXB population (Brainerd & Lamb 1987; Kylafis & Phinney 1988; Mezsaros, Riffert, & Berthiaume 1988; also see Göğüş, Alpar, & Gilfanov 2007). None of the mechanisms rely on, or explain, the fact that all ms pulsars have been observed only in particular types of binary systems. The growing number of ms pulsars known today make it highly unlikely that this is coincidental. The low inferred time-averaged mass accretion rates led to one possible explanation that the magnetic fields in ms pulsars do not decay to as low values as they do in the general LMXB population (Cumming, Zweibel, & Bildsten 2001) and hence can channel the accretion flow and produce visible pulsations. Within this scenario, it is difficult to understand the striking similarities in the spectra and broadband timing properties of the ms pulsars and the LMXBs when they have similar accretion rates (Psaltis & Chakrabarty 1998), as well as the detection of intermittent pulsations from two LMXBs.
In this paper, we propose an alternative explanation for the presence of detectable pulsations in this small number of binaries. As neutron stars accrete matter, their masses increase while, for most of the neutron-star matter equations of state, their radii remain approximately constant (or even decrease). This results in a rapid increase in the compactness of the neutron stars and very efficiently suppresses the amplitudes of pulsations due to gravitational light bending. When all binary and observer configurations are taken into account, the statistical probability of detecting pulsations from such a source thus decreases rapidly as the amount of accreted mass on the neutron star increases. We show that this mechanism can explain quantitatively the lack of pulsations in the majority of LMXBs that have been accreting at high rates while allowing for ms pulsations to be detected from the low accretion rate systems.
2 Pulse Amplitudes of Accreting Neutron Stars
Pulsations originating from the surface of a neutron star are subject to strong gravitational lensing. General relativistic bending of light in the strong stellar gravitational field of the neutron star suppresses the modulations of the observed lightcurves (Pechenick, Ftaclas, & Cohen 1983). For rapidly rotating neutron stars, time delays and Doppler boosts also affect the lightcurves seen by an observer at infinity. In such cases, both of these phenomena render the lightcurves asymmetric and more peaked, giving rise to higher amplitudes of pulsations both at the spin frequency and its harmonics (Braje, Romani, & Rauch 2000; Weinberg, Miller, & Lamb 2001; Muno, Özel, & Chakrabarty 2002).
The flux modulations observed in the lightcurves of accreting X-ray pulsars are attributed to the hot polar caps where the accretion columns hit the stellar surface. Therefore, all these relativistic effects play a role in determining the pulsation amplitudes and thus the observability of ms pulsars. To calculate the trajectories of the photons reaching the observer taking into account light bending, time delays and Doppler boosts, we use the numerical code described in Muno et al. (2002).
Our primary goal is to investigate the dependence of pulsations on the properties of the neutron star, and in particular, on its increasing mass as accretion proceeds. However, a number of other phenomena affect positively or negatively the pulsation amplitudes of ms pulsars. For example, as the spin frequency increases, so does the opening angle of the accretion column (see below), which reduces the amplitudes. On the other hand, Doppler and time delay effects, which increase the pulsation amplitudes, are more pronounced in fast rotators. In our present examples, we take into account both of these effects when we specify the properties of the neutron star systems.
We assume that the accretion onto the millisecond pulsars proceeds via a geometrically thin disk that is truncated near but inside the outer corotation radius. At this “loading” radius, matter is attached onto and follows the field lines onto the neutron star surface. A large fraction of the X-ray emission, especially in the soft X-rays, is thought to originate at localized polar caps on the stellar surface where the accretion columns terminate. We assume that the polar caps are circular and denote their opening angle by . The corotation radius is given by
| (1) | |||||
| (2) |
We estimate the opening angles of each polar cap by noting that the quantity remains constant along the field lines, yielding
| (3) |
and thus . Therefore, we use two antipodal regions of when calculating the amplitude of pulsations from the millisecond X-ray pulsars. Clearly, for a variable mass accretion rate on a given source, the corotation radius, the loading radius, and, thus, the size of the polar caps are also subject to variations.
Another important factor that affects the amplitudes of pulsations is the angular dependence (beaming) of the emission from the poles and the accretion column. The angular dependence is unique to the emission process and can be affected by variables such as the magnetic field strength or the temperature of the poles. The spectra of the millisecond pulsars suggest that the keV emission results from the Comptonization of the photons that are emitted at the boundary between the accretion column and the stellar surface. In the present calculations, we use a Hopf function to describe the beaming of emission, which is appropriate for energy-independent scattering in unmagnetized media. This can be justified for the following two reasons. First, the fact that the timing properties are largely independent of the photon energy in the observed energy range (e.g., Cui et al. 1999) indicate that in this range, all photons have experienced multiple scatterings and that the energy change in the scatterings probably has little effect on the angular distribution. Second, Psaltis & Chakrabarty (1999) estimate the magnetic field strength of SAX J1808.43658 to be G based on timing arguments. This yields an electron cyclotron energy that is much below the photon energy range of the observations, and therefore the magnetic field has no effect on the properties of the emission. We note that detailed modeling of the pulse profile and the source variability also point to Comptonization in the accretion columns and yield similar beaming functions as the one used here (Poutanen & Gierlinski 2003).
Figure 1 shows the dependence of the fundamental and first harmonic rms pulse amplitudes on the mass of the accreting neutron star, assuming a constant stellar radius of km and for a rotational frequency of Hz. Note that for most equations of state of neutron star matter, there is a characteristic mass-radius relationship such that the stellar radius remains constant for a large range of mass values (e.g., Glendenning 2000). Therefore, as the neutron star accretes matter, its compactness ratio increases and leads to a rapid suppression of pulsation amplitudes (e.g., Pechenick, Ftaclas, & Cohen 1983; Özel 2002). The spin frequency of 300 Hz is a representative value for the range Hz observed to date in ms pulsars. This figure demonstrates that the rms amplitudes are suppressed by a factor of for an increase in the stellar mass of about . Such a drastic suppression is also seen for a wide range of values for the stellar radii and spin frequencies, as well as the thicknesses of the accretion columns.
The apperance of the pulsations depends strongly on the two angles and that specify the inclination of the magnetic axis and the line-of-sight of a distant observer with respect to the rotation axis, respectively. In Figure 1, we chose an average set of values of for these angles. In the next section, we present a statistical treatment for the entire range of the magnetic inclination and the observer’s inclination and determine the fraction of binary systems that would be visible as pulsars.
3 Detection Probabilities
We now address pulsation amplitudes statistically for low-mass and high-mass accreting neutron stars. We calculate rms pulse amplitudes taking into account a population of neutron stars uniformly distributed in their geometrical quantities; i.e., their magnetic inclinations and observer’s inclinations. Our aim is to determine the detection probabilities for these systems.
We keep other intrinsic neutron star properties fixed at values specified in the previous section. For the neutron star mass-radius relation, we choose an equation of state commonly referred to as UU (see Cook, Shapiro, & Teukolsky 1994), which (i) corresponds to a radius of approximately 12 km in the mass range of interest (ii) has a maximum mass of and can thus support the heavier neutron stars formed by accretion and for which there is recent observational evidence (Muñoz-Darias, Casares, & Mart nez-Pais 2005; Özel 2006; Cornelisse et al. 2007), and (iii) is not excluded to date by any other probes of neutron-star matter. Note that there are several alternative equations of state of neutron star matter that give quite similar mass-radius relations for the range of masses under consideration (e.g., Lattimer & Prakash 2007).
In Figure 2, we show the fraction of systems that appear as a pulsar with an amplitude given on the x-axis for two values of the neutron star mass. As in the particular example shown in Figure 1, when the neutron star mass is low, the pulse amplitudes are higher and a significantly larger fraction of systems are visible as pulsars, with amplitudes as large as in a few cases. When the mass is higher, however, rms amplitudes are much lower, and the fraction of systems that are detectable as pulsars with a given amplitude drops rapidly.
Based on the accretion histories observed in these systems, we propose a connection between low-mass () systems and the accreting millisecond X-ray pulsars from which amplitude pulsations can be detected in roughly of the time. On the other hand, the probability of detecting pulsations from a high-mass neutron star, such as those that can emerge in a persistent, high LMXB, drops to about for a pulse amplitude. Note that no such system appears with a pulse amplitude .
4 Discussion and Conclusions
In this paper, we have attributed the difference between pulsing and non-pulsing neutron stars in LMXBs to their masses. There are several mechanisms that contribute to the evolution of binaries and determine the mass transfer rate (see, e.g., Verbunt 1993). In binaries with orbital periods greater than d, evolved giant companions lose mass rapidly, giving rise to high mass accretion rates. On the other hand, binaries with smaller orbital periods evolve because of loss of orbital angular momentum. For companion stars more massive than , the dominant magnetic braking mechanism can drive mass losses of order . For less massive companions with , it is thought that the lack of a convective envelope results in the evolution of the binary solely due to the emission of gravitational waves. In this regime, time averaged mass accretion rates are only yr-1, or less than . Binaries harboring the ms pulsars most probably belong to this last category, where very short binary periods point to very small mass, degenerate, or even brown dwarf, companions (e.g., Bildsten & Chakrabarty 2001).
We looked for observational evidence of these different accretion rates in the bulk LMXB population and the ms pulsars using the Rossi X-ray Timing Explorer (RXTE) All Sky Monitor lightcurves. Members of both of these populations show outbursts on the timescale of months, while a large number of LMXBs are persistent sources. We integrated their X-ray countrates over the entire period spanning January 1996 to December 2007 over which they have been observed and converted these to X-ray fluxes taking into account the fact that 1 Crab erg cm-2 s ASM count s-1. Using distances estimated from photospheric radius-expansion bursts for each source (Galloway et al. 2008), we obtained a distribution of X-ray luminosities and converted these values into time-averaged mass accretion rates (see Table 1). Figure 3 shows the histogram of mass accretion rates for both populations. As expected from theoretical arguments, the sources that appear as ms pulsars occupy the lowest end of the distribution of time-averaged accretion rates, which span four orders of magnitude. This implies that ms pulsars on average indeed accrete much less mass than the average LMXB, assuming that the trends observed by RXTE can be extrapolated over the lifetimes of the binaries.
The histogram in Figure 3 includes only four of the eight ms pulsars and a subset of the LMXBs because the calculation of the accretion rate requires a distance estimate to each source. Since we used distance estimates based on photospheric radius expansion bursts, which occur predominantly at low accretion rates, we expect that our distribution underestimates the number of high -sources. Correcting for this, however, would only accentuate the difference between the pulsing and non-pulsing sources.
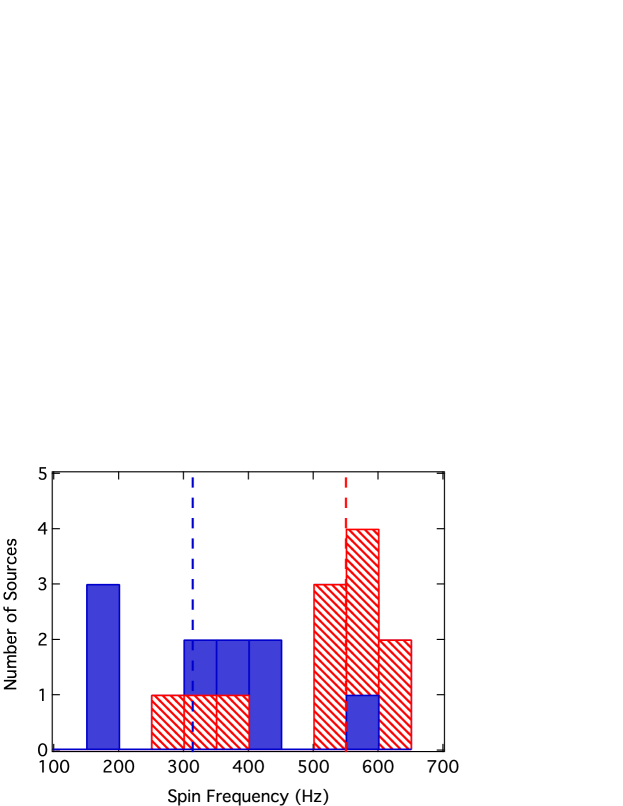
Differences in the mass accretion rates in the two populations may be expected to lead to differences in their spin frequency distributions if the latter are determined by magnetic spin equilibrium. If the distributions in the magnetic field strength are similar between the two populations, then the millisecond pulsars should have a spin frequency distribution that is displaced towards lower values compared to that of the non-pulsing LMXBs. Given the orders of magnitude difference in the average mass accretion rates between the two populations (Fig. 3), and a disk-magnetosphere interaction model that best describes the pulse behavior of SAX J1808.43658 (the 1R model in Psaltis & Chakrabarty 1999 that has a dependence), the mean spin frequency of the pulsing sources should be a factor of lower than those of non-pulsing LMXBs. Figure 4 shows the spin frequency distributions of both populations together with their median values. Indeed, the distribution of the pulsing sources, with a median of 314 Hz, is systematically lower than that of the non-pulsing sources that has a median of 550 Hz.
An independent argument for the presence of massive neutron stars in LMXBs comes from dynamical and spectroscopic mass measurements. X1822371 (Muñoz-Darias et al. 2005); Aql X-1 (Cornelisse et al. 2007), 2S 0921-630 (Shahbaz et al. 2004; Jonker et al. 2005), and EXO 0748676 (Özel 2006) all have inferred neutron star masses exceeding . Conversely, a detailed pulse profile modeling of the ms pulsar SAX J1808.43658 yields a neutron star mass of (Poutanen & Gierlinski 2003).
If the eight observed ms pulsars are a representative sample of the distribution over the observer’s inclination and the magnetic inclination, then the observed cumulative distribution of their pulse amplitudes should follow the trend shown in Figure 2 down to a limiting amplitude. Table 2 shows the rms amplitudes of the ms pulsars observed to date. In Figure 2, we compare the observed cumulative distribution of pulse amplitudes, assuming that it is complete down to 1%, to the theoretical expectation obtained for the set of representative parameters discussed earlier. The remarkable qualitative agreement provides additional support to the mechanism proposed here.
This mechanism suggests that a fraction of the LMXB population should also show millisecond pulsations at the level of , assuming no other processes play a role in determining pulsation amplitudes. Current upper limits on the amplitudes of periodic oscillations in LMXBs range from for the most luminous Z sources to a few percent for the less luminous atoll sources. Most of these limits come from studies with Ginga, which has been used to carry out the only systematic search for the pulsations in LMXBs (see Vaughan et al. 1994 and references therein). Eleven out of the fifteen sources studied have very high mass accretion rates, which is likely to result in very small rms amplitudes in our model. This is both because the disk penetrates very close to the star at high mass accretion rates, leading to very large cap opening angles, and also because the neutron star can become very massive over its lifetime. Three out of the remaining four sources have spin frequencies higher than the Nyquist frequency of these observations (the timing resolution of this instrument sets an upper limit to the detectable spin frequency of Hz).
There have not been any published systematic studies with the Rossi X-ray Timing Explorer to detect or place upper limits on the pulsations of the LMXB sample statistically, which would serve as an excellent test for the predictions we present here. However, there have been isolated deep investigations, which yielded varying results. One well-studied case is 4U 1820-30 (Dib et al. 2005) with an upper limit of on the pulsation amplitude. The studies of the numerous archival observations of two other LMXBs, in constrast, resulted in the detections of pulsations: Aql X-1 showed pulsations in a single, 150 s interval of data, with an amplitude of (Casella et al. 2008), while SAX J1748.92021 showed 442 Hz intermittent pulsations with an amplitude of (Altamirano et al. 2008; also see below for a discussion of intermittent pulsations). This has led to the categorization of the latter source as the ninth accretion powered ms pulsar, with the largest orbital period (8.9 hr) in that sample. However, given all its other characteristics, within our model, SAX J1748.92021 belongs to the bulk of the LMXB population with higher mass accretion rates that actually survives as a low amplitude pulsar.
While the general relativistic suppression of pulsation amplitudes for neutron stars with higher masses is inevitable, the precise values of the amplitudes depend on the assumed parameters of the accretion column. As discussed in §2, we chose physically motivated values based on the assumption of spin equilibrium for this study. The excellent agreement between the observed distribution of ms pulsar periods and those expected from the calculations support these assumptions. However, somewhat different values of the column opening angles as well as the details of the radiation beam can affect the quantitative results. In addition, if high mass accretion rates indeed lead to magnetic field decay, this can further attenuate pulsation amplitudes (Cumming et al. 2001).
The intermittent appearance of detectable pulsations recently seen in Aql X-1 (Casella et al. 2007), HETE J1900.1-2455 (Galloway et al. 2007), and SAX J1748.92021 (Altamirano et al. 2008) may also be related to the changing properties of the accretion disk and column over short timescales. In particular, high mass accretion rates lead to a larger opening angle of the accretion column, which leads to lower pulsation amplitudes. This is true even for small fluctuations in the mass accretion rate in the annulus where magnetic field lines are loaded, which is shown to be variable and turbulent (Romanova, Kulkarni, & Lovelace 2008) and can move the loading radius around its equilibrium position. Alternatively, this can be a result of more dramatic events in the accretion process, such as a thermonuclear (Type-I) burst clearing the inner disk and moving the loading radius outwards. If so, there may be correlated changes between the appearance of pulsations and flux levels, spectral properties, and/or bursting activity. The suggested correlation between the Type-I thermonuclear bursts and the subsequent appearance of pulsations (Galloway et al. 2007; Altamirano et al. 2008) is very intriguing in this respect.
Finally, we address the presence of detectable flux oscillations during thermonuclear bursts in a number of LMXBs. These so-called burst oscillations appear during either the rise or the cooling phase of the bursts and have rms amplitudes ranging from . Even for LMXBs that are massive enough to suppress persistent pulsations, burst oscillations may occur with these relatively high amplitudes because they are thought to arise from one spot as opposed to the two caps present during persistent emission. Specifically, the one hotspot is thought to correspond to a burning front a mode in the burst rise, or a mode in the burst tail. Pulsation amplitudes are significantly lower and fall off faster with two caps (see, e.g., Muno et al. 2003), making persistent pulsations much harder to detect than burst oscillations.
References
- Alpar et al. (1982) Alpar, M. A., Cheng, A. F., Ruderman, M. A., & Shaham, J. 1982, Nature, 300, 728 bibitem[Altamirano et al.(2008)]2008ApJ…674L..45A Altamirano, D., Casella, P., Patruno, A., Wijnands, R., & van der Klis, M. 2008, ApJ, 674, L45
- Bildsten & Chakrabarty (2001) Bildsten, L., & Chakrabarty, D. 2001, ApJ, 557, 292
- Brainerd & Lamb (1987) Brainerd, J., & Lamb, F. K. 1987, ApJ, 317, L33
- Braje et al. (2000) Braje, T. M., Romani, R. W., & Rauch, K. P. 2000, ApJ, 531, 447
- Casella et al. (2008) Casella, P., Altamirano, D., Patruno, A., Wijnands, R., & van der Klis, M. 2008, ApJ, 674, L41
- Cook et al. (1994) Cook, G. B., Shapiro, S. L., & Teukolsky, S. A. 1994, ApJ, 424, 823
- Cornelisse et al. (2007) Cornelisse, R., Casares, J., Steeghs, D., Barnes, A. D., Charles, P. A., Hynes, R. I., & O’Brien, K. 2007, MNRAS, 375, 1463
- Cui et al. (1998) Cui, W., Morgan, E. H., & Titarchuk, L. G. 1998, ApJ, 504, L27
- Cumming et al. (2001) Cumming, A., Zweibel, E., & Bildsten, L. 2001, ApJ, 557, 958
- Dib et al. (2005) Dib, R., Ransom, S. M., Ray, P. S., Kaspi, V. M., & Archibald, A. M. 2005, ApJ, 626, 333
- Galloway et al. (2002) Galloway, D. K., Chakrabarty, D., Morgan, E. H., & Remillard, R. A. 2002, ApJ, 576, L137
- Galloway et al. (2005) Galloway, D. K., Markwardt, C. B., Morgan, E. H., Chakrabarty, D., & Strohmayer, T. E. 2005, ApJ, 622, L45
- Galloway et al. (2007) Galloway, D. K., Morgan, E. H., Krauss, M. I., Kaaret, P., & Chakrabarty, D. 2007, ApJ, 654, L73
- Galloway et al. (2008) Galloway, D. K., Muno, M. P., Hartman, J. M., Savov, P., Psaltis, D., & Chakrabarty, D. 2008, ApJS, in press, arXiv:astro-ph/0608259
- Gogus et al. (2007) Göğüş, E., Alpar, M. A., & Gilfanov, M. 2007, ApJ, 659, 580
- Jonker et al. (2005) Jonker, P. G., Steeghs, D., Nelemans, G., & van der Klis, M. 2005, MNRAS, 356, 621
- Kirsch et al. (2004) Kirsch, M. G. F., Mukerjee, K., Breitfellner, M. G., Djavidnia, S., Freyberg, M. J., Kendziorra, E., & Smith, M. J. S. 2004, A&A, 423, L9
- Krimm et al. (2007) Krimm, H. A., et al. 2007, ApJ, 668, L147
- Kylafis & Phinney (1989) Kylafis, N. D., & Phinney, E. S. 1989, Timing Neutron Stars, 731
- Lattimer & Prakash (2007) Lattimer, J. M., & Prakash, M. 2007, Phys. Rep., 442, 109
- Liu et al. (2007) Liu, Q. Z., van Paradijs, J., & van den Heuvel, E. P. J. 2007, A&A, 469, 807
- Markwardt et al. (2002) Markwardt, C. B., Swank, J. H., Strohmayer, T. E., Zand, J. J. M. i., & Marshall, F. E. 2002, ApJ, 575, L21
- Meszaros et al. (1988) Meszaros, P., Riffert, H., & Berthiaume, G. 1988, ApJ, 325, 204
- Muno et al. (2002) Muno, M. P., Özel, F., & Chakrabarty, D. 2002, ApJ, 581, 550
- Muñoz-Darias et al. (2005) Muñoz-Darias, T., Casares, J., & Martínez-Pais, I. G. 2005, ApJ, 635, 502
- Özel (2002) Özel, F. 2002, ApJ, 575, 397
- Özel (2006) ———. 2006, Nature, 441, 1115
- Pechenick et al. (1983) Pechenick, K. R., Ftaclas, C., & Cohen, J. M. 1983, ApJ, 274, 846
- Psaltis & Chakrabarty (1999) Psaltis, D., & Chakrabarty, D. 1999, ApJ, 521, 332
- Poutanen & Gierliński (2003) Poutanen, J., & Gierliński, M. 2003, MNRAS, 343, 1301
- Radhakrishnan & Srinivasan (1982) Radhakrishnan, V., & Srinivasan, G. 1982, Current Science, 51, 1096
- Romanova et al. (2008) Romanova, M. M., Kulkarni, A. K., & Lovelace, R. V. E. 2008, ApJ, 673, L171
- Shahbaz et al. (2004) Shahbaz, T., Casares, J., Watson, C. A., Charles, P. A., Hynes, R. I., Shih, S. C., & Steeghs, D. 2004, ApJ, 616, L123
- Vaughan et al. (1994) Vaughan, B. A., et al. 1994, ApJ, 435, 362
- Verbunt (1993) Verbunt, F. 1993, ARA&A, 31, 93
- Watts et al. (2005) Watts, A. L., Strohmayer, T. E., & Markwardt, C. B. 2005, ApJ, 634, 547
- Weinberg et al. (2001) Weinberg, N., Miller, M. C., & Lamb, D. Q. 2001, ApJ, 546, 1098
- Wijnands & van der Klis (1998) Wijnands, R., & van der Klis, M. 1998, Nature, 394, 344
| Source | Distance | ASM countrate | Luminosity | |
|---|---|---|---|---|
| (kpc) | (ct ) | (erg s-1) | ( yr-1) | |
| GX 17+2 | 9.8 | 44.9 | 1.38 | 1.16 |
| Cyg X-2 | 10 | 37.6 | 1.20 | 1.01 |
| Ser X-1 | 7.7 | 16.52 | 3.13 | 2.63 |
| 4U 1735–44 | 6.5 | 13.95 | 1.88 | 1.59 |
| GX 3+1 | 5 | 21.49 | 1.72 | 1.44 |
| 4U 1746–37 | 16 | 2.068 | 1.69 | 1.42 |
| 3A1820–303 | 4.9 | 20.7 | 1.59 | 1.34 |
| 4U 1705–44 | 5.8 | 11.08 | 1.19 | 1.00 |
| 4U 1636–536 | 5.9 | 9.78 | 1.11 | 9.31 |
| KS 1731–260 | 5.6 | 3.66 | 3.67 | 3.09 |
| 4U 1728–34 | 4 | 6.84 | 3.49 | 2.94 |
| GRS 1741.9–2853 | 6 | 1.376 | 1.58 | 1.33 |
| MXB 1659–298 | 9 | 0.527 | 1.37 | 1.15 |
| 4U 1702–429 | 4.2 | 2.378 | 1.33 | 1.12 |
| 4U 1608–52 | 3.2 | 3.76 | 1.23 | 1.04 |
| Aql X-1 | 3.9 | 1.864 | 9.07 | 7.63 |
| 4U 1916–053 | 6.8 | 0.581 | 8.59 | 7.23 |
| GRS 1747–312 | 9 | 0.298 | 7.72 | 6.49 |
| XTEJ1710–281 | 12 | 0.1104 | 5.08 | 4.28 |
| EXO 0748–676 | 5.7 | 0.38 | 3.95 | 3.32 |
| XB 1832–330 | 6.7 | 0.1836 | 2.64 | 2.22 |
| EXO 1754–248 | 4.7 | 0.363 | 2.59 | 2.18 |
| 4U 1724–307 | 5 | 0.269 | 2.15 | 1.81 |
| SAX J1747.0–2853 | 5.2 | 0.174 | 1.50 | 1.27 |
| 4U 0919–54 | 4 | 0.255 | 1.30 | 1.10 |
| HETE J1900.1–2455 | 3.6 | 0.2842 | 1.18 | 9.91 |
| SAX J1750.8–2900 | 5.2 | 0.1169 | 1.01 | 8.53 |
| XTE J1814–338 | 7.9 | 0.0446 | 8.90 | 7.49 |
| SAX J1808.4–3658 | 2.8 | 0.118 | 2.89 | 2.44 |
| 4U 2129+12 | 5.8 | 0.0125 | 1.34 | 1.13 |
| IGR J00291+5934 | 4 | 0.02102 | 1.07 | 9.05 |
| Source | Spin Freq. (Hz) | Porb | rms Amplitude | Referencea |
|---|---|---|---|---|
| SAX J1808.4-3658 | 401 | 2.01 hr | 4.17% | 1 |
| XTE J1751-305 | 435 | 42.4 min | 3.5% | 2 |
| XTE J0929-314 | 185 | 43.6 min | 37% | 3 |
| XTE J1807-294 | 191 | 41.0 min | 3.15.99% | 4 |
| XTE J1814-338 | 314 | 4.27 hr | 12% | 5 |
| IGR J00291+5934 | 599 | 2.46 hr | 8% | 6 |
| HETE J1900.1-2455 | 377 | 83.25 min | 12/3% | 7 |
| SWIFT J1756.9-2508 | 182 | 54.7 min | 4.2 % | 8 |