The properties of the host galaxy and the immediate environment of GRB 980425 / SN 1998bw from the multi-wavelength spectral energy distribution
Abstract
We present an analysis of the spectral energy distribution (SED) of the galaxy ESO 184-G82, the host of the closest known long gamma-ray burst (GRB) 980425 and its associated supernova (SN) 1998bw. We use our observations obtained at the Australia Telescope Compact Array (the third radio detection of a GRB host) as well as archival infrared and ultraviolet (UV) observations to estimate its star formation state. We find that ESO 184-G82 has a UV star formation rate (SFR) and stellar mass consistent with the population of cosmological GRB hosts and of local dwarf galaxies. However, it has a higher specific SFR (per unit stellar mass) than luminous spiral galaxies. The mass of ESO 184-G82 is dominated by an older stellar population in contrast to the majority of GRB hosts. The Wolf-Rayet region pc from the SN site experienced a starburst episode during which the majority of its stellar population was built up. Unlike that of the entire galaxy, its SED is similar to those of cosmological submillimeter/radio-bright GRB hosts with hot dust content. These findings add to the picture that in general, the environments of GRBs on 1–3 kpc scales are associated with high specific SFR and hot dust.
Subject headings:
dust, extinction — galaxies: evolution — galaxies: ISM — galaxies: starburst — gamma-ray: burst1. Introduction
Long gamma-ray bursts (GRBs) are associated with the death of massive stars (e.g. Galama et al., 1998; Hjorth et al., 2003b; Stanek et al., 2003). This makes them of special interest in cosmology because they possibly trace the evolution of the rate of star formation in the Universe (e.g. Lamb & Reichart, 2000; Jakobsson et al., 2005, 2006b). Indirect evidence of the nature of GRBs was found by studying their host galaxies (e.g. Bloom et al., 1998; Christensen et al., 2004; Sollerman et al., 2005; Castro Cerón et al., 2009; Savaglio et al., 2009).
Moreover, several studies on the immediate environments of GRBs suggest a close connection of long GRBs with regions of star formation, and therefore that their progenitors are likely massive stars. Fruchter et al. (2006) found that GRBs trace the ultraviolet (UV) brightest parts of their host (see also Bloom et al., 2002). Thöne et al. (2008) studied in detail the environment (in kpc bins) of GRB 060505 (catalog ), concluding that it originated in the youngest, most metal-poor and most intense star-forming region in the host galaxy. Similarly, Östlin et al. (2008) found that the kpc environment of GRB 030329 (catalog ) is much younger than the entire galaxy and its estimated age suggests a conservative lower limit on the mass of the GRB progenitor equal to . Finally, a significant number of other GRBs were reported to reside in dense star-forming regions (Castro-Tirado et al., 1999; Holland & Hjorth, 1999; Hjorth et al., 2003a; Savaglio et al., 2003; Vreeswijk et al., 2004; Chen et al., 2005, 2006; Fynbo et al., 2006a; Watson et al., 2006, 2007; Prochaska et al., 2007a, b; Ruiz-Velasco et al., 2007) and molecular clouds (Galama & Wijers, 2001; Stratta et al., 2004; Jakobsson et al., 2006a; Campana et al., 2007; Prochaska et al., 2008).
GRB 980425 (catalog ) is the closest known GRB (; Tinney et al., 1998), therefore it is an excellent laboratory for local GRB studies. Galama et al. (1998) reported the Type Ic supernova (SN) 1998bw (catalog SN 1998bw) exploding inside the error box of GRB 980425 (catalog ). Its lightcurve was well modeled by an explosion of a Wolf-Rayet (WR) star (Iwamoto et al., 1998), which is a highly evolved and massive star that has lost its outer hydrogen layers. Up to now, three other GRBs have also been spectroscopically confirmed to be associated with SNe: GRB 030329 (catalog ) (Hjorth et al., 2003b; Matheson et al., 2003; Stanek et al., 2003), 031203 (catalog GRB 031203) (Cobb et al., 2004; Gal-Yam et al., 2004; Malesani et al., 2004; Thomsen et al., 2004) and 060218 (catalog GRB 060218) (Ferrero et al., 2006; Mirabal et al., 2006; Modjaz et al., 2006; Pian et al., 2006; Soderberg et al., 2006; Sollerman et al., 2006), while two GRBs were confirmed to be SN-less: GRB 060505 (catalog GRB 060505) and 060614 (catalog GRB 060614) (Fynbo et al., 2006b; Della Valle et al., 2006; Gal-Yam et al., 2006).
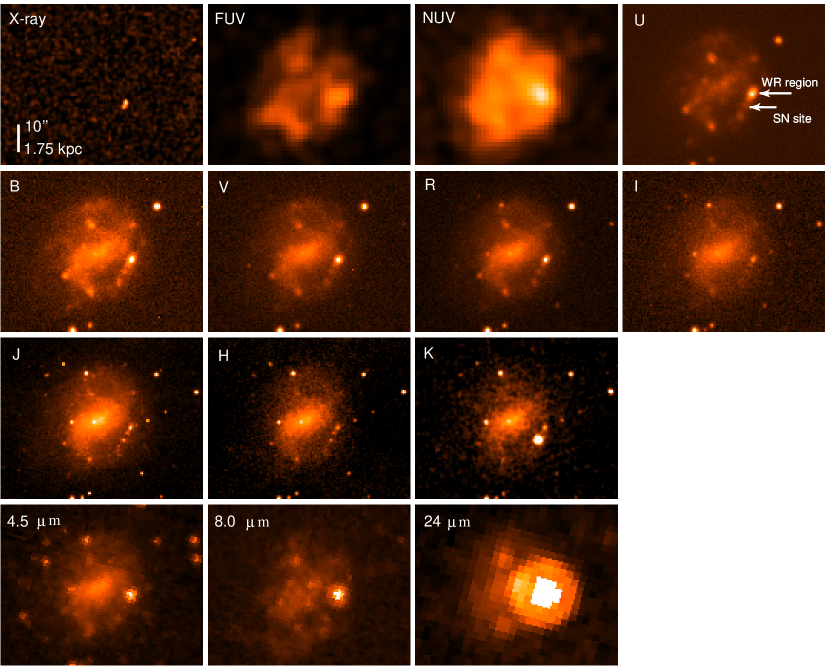
The host galaxy of GRB 980425 (catalog ) / SN 1998bw (catalog ) (ESO 184-G82 (catalog ); Holmberg et al., 1977) is a dwarf ( of the characteristic blue luminosity, ; Fynbo et al., 2000) barred spiral (SBc; Fynbo et al., 2000) with axis diameters of and kpc (down to mag arcsec-2; Sollerman et al., 2005), dominated by a large number of star-forming regions (Fynbo et al., 2000; Sollerman et al., 2005). SN 1998bw (catalog ) occurred inside one of these, pc southeast of a region displaying a Wolf-Rayet type signature spectrum (hereafter: WR region; Hammer et al., 2006). The WR region dominates the galaxy’s emission at (Le Floc’h et al., 2006) and is the youngest region within the host exhibiting very low metallicity (Christensen et al., 2008).
In this paper we present fits to the spectral energy distribution (SED) of ESO 184-G82 (catalog ) and the WR region and compare their properties to other galaxies. Section 2 lists the data sources (including the third radio detection of a GRB host after those reported by Berger et al., 2001, 2003) used for the SED modeling of Section 3. We derive properties of the host galaxy and WR region in Section 4, discussing their implications in Section 5. Section 6 closes with our conclusions. We use a cosmological model with km s-1 Mpc-1, and , so ESO 184-G82 (catalog ) is at a luminosity distance of Mpc and corresponds to 175 pc at its redshift.
2. Data
| Filter | X-ray | FUV | NUV | Spitzer | ATCA | |||||||||||
|---|---|---|---|---|---|---|---|---|---|---|---|---|---|---|---|---|
| (µm) | keV | 0.1516 | 0.2267 | 0.36 | 0.428 | 0.553 | 0.656 | 0.767 | 1.25 | 1.64 | 2.17 | 4.5 | 8.0 | 24 | 3 cm | 6 cm |
| Host | 3.6 | 1.26 | 1.54 | 2.44 | 4.5 | 5.56 | 6.80 | 8.21 | 9.8 | 8.8 | 6.5 | 2.95 | 11.9 | 27.3 | 0.42 | |
| Error | 1.6 | 0.13 | 0.16 | 0.26 | … | … | … | … | 0.4 | 0.5 | 0.4 | 0.10 | 0.3 | 0.2 | … | 0.05 |
| WR | … | 0.095 | 0.120 | 0.170 | 0.116 | 0.162 | 0.135 | 0.0690 | 0.078 | 0.071 | 0.044 | 0.22 | 1.815 | 21 | … | … |
| Error | … | 0.023 | 0.017 | 0.016 | 0.006 | 0.008 | 0.006 | 0.0034 | 0.013 | 0.012 | 0.009 | … | … | … | … | … |
| (%) | … | 7.5 | 7.8 | 7.0 | 2.6 | 2.9 | 2.0 | 0.8 | 0.8 | 0.8 | 0.7 | 7.5 | 15.3 | 76.9 | … | … |
| Ref. | 1 | 2 | 2,3 | 2 | 2,4 | 2,4 | 2,4 | 2,4 | 2 | 2 | 2,3 | 5 | 5 | 5 | 2 | 2 |
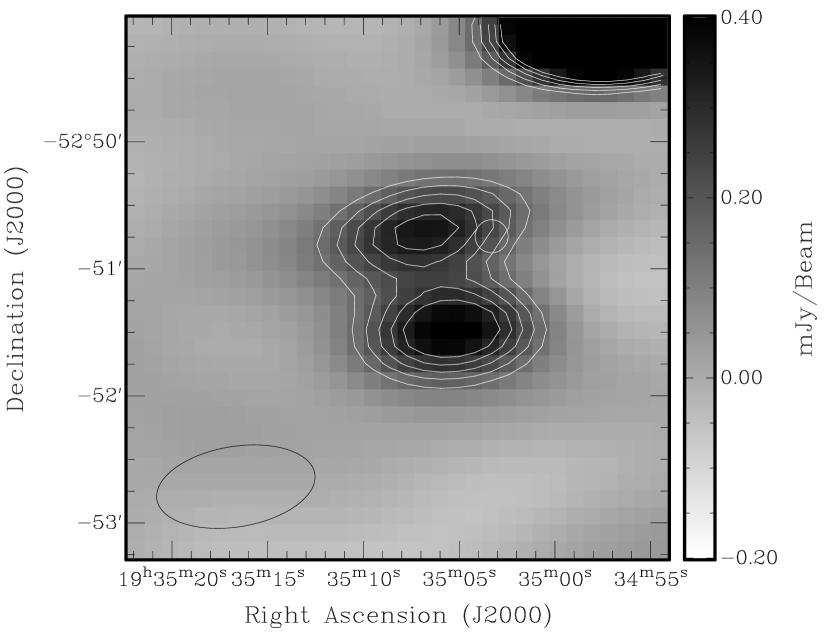
We undertook deep radio observations of the host galaxy of GRB 980425 on 2007 August 18 using the Australia Telescope Compact Array (proposal no. C1651, PI: Michałowski) using the hybrid H168 configuration, with antennas positioned on both east-west and north-south tracks, and baselines of 60–4500 m. Simultaneous observations were made at 6 cm (4.8 GHz) and 3 cm (8.64 GHz), with a bandwidth of 128 MHz at each frequency. A total of 10.5 hr of data were obtained. Calibrator source PKS B1934-638 (catalog ) was utilized to set the absolute flux calibration of the array as well as to calibrate phases and gains. Data reduction and analysis was done using the MIRIAD package (Sault & Killeen, 2004). Antenna #1 was excluded from the analysis due to phase instabilities, thus reducing the number of possible baselines from 15 to 10. Calibrated visibilities were Fourier transformed using “robust weighting”, which combines high signal-to-noise ratio with enhanced sidelobe suppression. The final synthesized beam sizes for 6 and 3 cm images were and , respectively, with root-mean-square (rms) values of and Jy beam-1. The host galaxy, ESO 184-G82 (catalog ), was only detected at 6 cm. This is only the third radio detection of a GRB host, after those of GRB 980703 (catalog ) and GRB 000418 (catalog ) (Berger et al., 2001, 2003). Note that the radio observations of GRB 000301C (catalog ) and GRB 000911 (catalog ) were also reported to be detection, but after removal of the afterglow signal, the significance of the host detections drops below . As ESO 184-G82 (catalog ) slightly overlaps Galaxy A, reported by Foley et al. (2006), south (see Figure 1), its flux density was estimated by simultaneous fitting of two two-dimensional Gaussian functions to the data with their centroids, sizes, and orientations as free parameters. The lack of residuals left after the subtraction of these two Gaussians rules out a significant contamination of the Galaxy A to the measured flux of the host. ESO 184-G82 (catalog ) was not detected at 3 cm down to a limiting flux of mJy.
We obtained -band photometry on the Danish 1.5m Telescope on La Silla during the period 2007 May-June. In total 3.75 hr were spent on the target. The data were reduced in a standard manner using IRAF (Tody, 1986, 1993).
We performed photometry on archival images from NTT/SofI (Patat et al., 2001), VLT/ISAAC (Sollerman et al., 2002) and Two Micron All Sky Survey (2MASS Jarrett et al., 2000)1112MASS XSC Final Release (Two Micron All Sky Survey Extended Source Catalog) released on 2003 March 25; http://www.ipac.caltech.edu/2mass/, as well as images from VLT/FORS1 (Sollerman et al., 2005) and UV images from GALEX (Martin et al., 2003, 2005)222Galaxy Evolution Explorer; http://galex.stsci.edu/. The flux was measured in an aperture of diameter for the whole galaxy and 2.4–3.6” (depending on the seeing of the particular image) for the WR region. The results of our photometry and the fluxes obtained from the literature are presented in Table 1 and a mosaic of images is shown in Figure 2.
Finally we analyzed the X-ray (2–10 keV) image from Kouveliotou et al. (2004). It was, however, not used in the modeling since our SED templates do not cover this wavelength regime.
3. SED Modeling
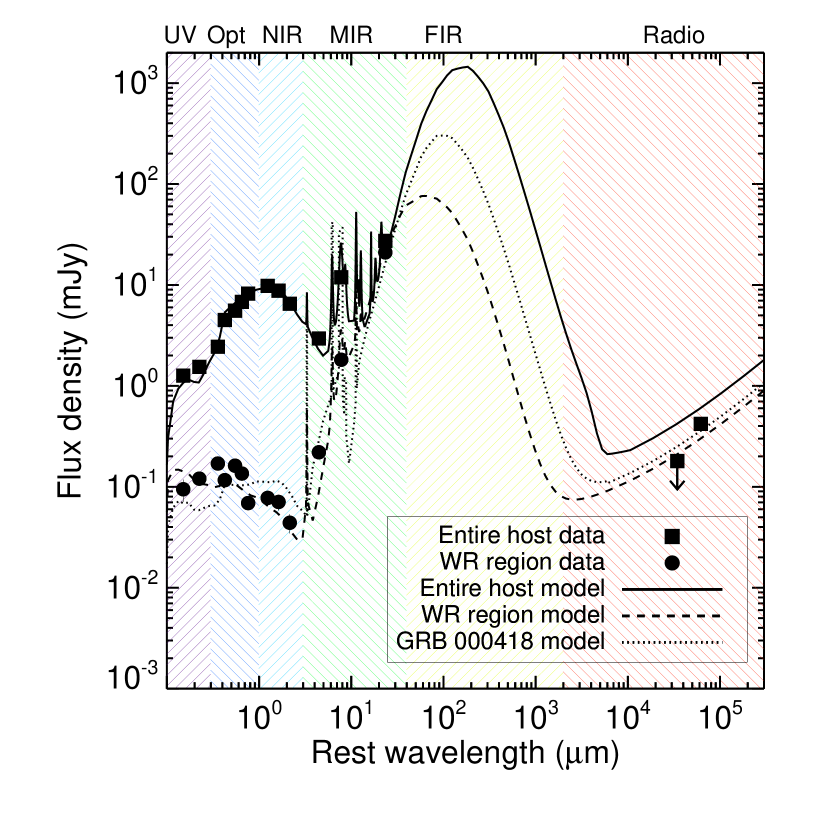
In order to model the SEDs of ESO 184-G82 (catalog ) and of the WR region we utilized the set of 35 000 SED models from Iglesias-Páramo et al. (2007) developed in GRASIL (Silva et al., 1998)333http://adlibitum.oat.ts.astro.it/silva/default.html. based on numerical calculations of the radiative transfer within a galaxy. They cover a broad range of galaxy properties from quiescent to starburst. We scaled all the SEDs to match the observational data and chose the one with the lowest to derive the galaxy characteristics.
The radio parts of model SEDs were scaled down by an appropriate factor to account for the decreased efficiency of nonthermal radio emission of dwarf galaxies (see Equation (1) and discussion in Section 4.2 and in Bell, 2003). Namely a dwarf galaxy has a lower radio flux than it would result from scaling down the high-luminosity SED template and the GRASIL model does not take into account this effect. From the SFR–radio flux relation of Bell (2003, see equation (1) below) we inferred that the radio part of the SED template corresponding to ESO 184-G82 (catalog ) should be times lower than in the original template. Anyway, even such corrected templates overpredict the value of radio data points so we excluded them from the fitting (see Section 5.2 for a discussion).
4. Results
| Age | SFRSED | SFRUV | SFRIR | SFRradio | ||||||||
|---|---|---|---|---|---|---|---|---|---|---|---|---|
| Region | (Gyr) | () | ( yr-1) | ( yr-1) | ( yr-1) | ( yr-1) | () | () | () | (K) | (mag) | (mag) |
| (1) | (2) | (3) | (4) | (5) | (6) | (7) | (8) | (9) | (10) | (11) | (12) | (13) |
| Host | … | |||||||||||
| WR | … | |||||||||||
| (%) | … | … | … | 0.2 | … | … | … |
4.1. Stellar Masses
The broadband SED of the host of GRB 980425 (catalog ) is consistent with that of a galaxy with an old stellar population (the time since the beginning of the galaxy evolution is equal to Gyr, see Column 2 of Table 2) built up quiescently without any starburst episode (consistent with the conclusion of Sollerman et al., 2005) at a rate comparable to the present value. The age estimate is however uncertain due to degeneracy between age and dust extinction as well as metallicity, namely that if one increases the assumed metallicity or decreases the extinction then the resulting age will increase. The derived stellar mass agrees with previous estimates (Castro Cerón et al., 2009; Savaglio et al., 2009).
On the other hand, the comparison of Columns 8 and 9 of Table 2 reveals that the stellar mass of the WR region is dominated by a starburst episode, so that it has built up a negligible fraction of the stellar mass before the starburst. According to our SED model, this starburst is still ongoing and started Myr ago. Interestingly this is the starburst age predicted for GRB hosts by Lapi et al. (2008) based on the argument that for older starbursts the metallicity becomes too high to produce a GRB.
4.2. Star Formation Rates
The SFR of the entire galaxy, as well as that of the WR region, was calculated from UV and infrared (IR) fluxes (Table 1) using the conversions of Kennicutt (1998). The radio SFR ( yr-1) was calculated from the radio luminosity (erg s-1 Hz-1) using the method proposed by Bell (2003):
| (1) |
where erg s-1 Hz-1 is a critical luminosity (see below). This relation was derived based on a sample of 249 galaxies spanning a wide range in luminosities including normal and intensely star-forming galaxies, starbursts, ultraluminous IR galaxies and blue compact dwarfs. The luminosity at the rest frequency of GHz, (erg s-1 Hz-1), of a galaxy at redshift and luminosity distance (cm), can be calculated from the flux density (Jy) at the observed radio frequency (GHz) assuming the radio spectral slope (Yun & Carilli, 2002):
| (2) |
This relation (Equation (1)) diverges significantly from the usual methods (Condon, 1992; Yun & Carilli, 2002) for low-luminosity galaxies, because the nonthermal radio emission is not effective in such galaxies and the relation between SFR and radio luminosity becomes nonlinear below (SFR yr-1). This effect is likely caused either by the fact that cosmic-ray electrons responsible for the radio emission escape from galaxies of small sizes (Bell, 2003) or that the ordered magnetic field in dwarf galaxies is weaker and therefore magnetic field due to SNe (responsible for acceleration of electrons) is less efficient because it results from contraction and amplification of the global field.
The SFR derived from SED modeling (Column 4 of Table 2) agrees (within a factor of 2) with the estimates derived from UV, IR, and radio for the entire galaxy, suggesting little extinction (see also Section 4.3). All the estimates are also consistent with the X-ray SFR upper limit of yr-1 derived by Watson et al. (2004).
As noted by Le Floc’h et al. (2006) the contribution of the WR region to the galaxy luminosity at µm is % (see Table 1 and Figure 3). However, according to our SED fit, it only emits 15% of the total IR luminosity (it would require high-resolution far-IR or submillimeter imaging to confirm this result). Under the assumption that the total IR luminosity is proportional to the SFR (Kennicutt, 1998), this is consistent within a factor of 2 with the finding of Sollerman et al. (2005) and Christensen et al. (2008) that the WR region harbors about one-third of the host star formation (as also suggested by the SFRs derived directly from SED fits, see Column 4 of Table 2).
4.3. Dust Properties
We derived the dust temperature by fitting a graybody curve to the model SED near the dust peak (as in Michałowski et al., 2008). The dust in the WR region is much hotter than the average over the entire galaxy (see Column 11 of Table 2 and note on Figure 3 that the SED of the WR region peaks at shorter wavelengths than that of the entire galaxy). This hints at a very intense starburst episode and a strong radiation field, consistent with the discussion in Section 4.1. High dust temperatures are not uncommon for GRB hosts. They were found for higher-redshift (–) GRBs with similar conclusions about their origin (Michałowski et al., 2008). Moreover, Bloom et al. (2003) and Djorgovski et al. (2001) noted that high flux ratios between the [Ne III] and [O II] lines in GRB hosts suggest the presence of very hot H II regions.
The total dust mass, , was estimated using the method of Taylor et al. (2005) based on the formalism developed by Hildebrand (1983):
| (3) |
where is the flux density (either observed or interpolated from an SED model) at the rest frequency dominated by dust thermal emission (), is the Planck function, is dust temperature, is the mass absorption coefficient
| (4) |
and is the emissivity index. Equations (3) and (4) can be combined into the following easy-to-use formula where the resulting dust mass () is computed from the quantities in the following units: (Jy), (cm), (GHz), and (K):
| (5) |
We estimated the flux at µm from the SED models. The results of dust masses are given in Column 10 of Table 2 assuming . There exists a degeneracy between the value of this parameter and resulting dust mass in a way that more dust is expected if lower is assumed. The uncertainties quoted in Table 2 are large, because we allowed a broad range of (; Yun & Carilli, 2002).
Hatsukade et al. (2007) derived an upper limit on the molecular mass of the host of GRB 980425 (catalog ) . Therefore from our dust mass estimate we derive a molecular gas-to-dust ratio . This value is lower than the molecular gas-to-dust ratio for the Milky Way (; Sodroski et al., 1997; Draine et al., 2007) and other spirals (; Devereux & Young, 1990; Stevens et al., 2005), but consistent with the values for high-redshift submillimeter galaxies (; Kovács et al., 2006), and for the nuclear regions of local luminous IR galaxies (LIRGs), ultraluminous IR galaxies (ULIRGs) (; Wilson et al., 2008) and of local, far-IR-selected galaxies (; Seaquist et al., 2004). It indicates that the host of GRB 980425 (catalog ) harbors a relatively large amount of dust, or that its gas reservoir is significantly depleted. However this conclusion is based on an uncertain dust mass estimate, so should be checked with deep submillimeter observations.
Our SED fits are consistent with negligible extinction for both the entire galaxy and the WR region (Column 13 of Table 2). Very low reddening for the entire galaxy was also found by Patat et al. (2001) and Sollerman et al. (2005) from the width of the Na I D doublet and SED fitting, respectively. On the other hand, using the Balmer decrement, Savaglio et al. (2009) and Christensen et al. (2008) derived and , respectively, for the entire galaxy, whereas Hammer et al. (2006) and Christensen et al. (2008) obtained and , respectively, for the WR region. However, extinction derived from emission lines of the H II regions is usually higher than from the SED modeling (Savaglio et al., 2009).
5. Discussion
5.1. The Host Galaxy
From the SED modeling it is apparent that ESO 184-G82 (catalog ), the host galaxy of GRB 980425 (catalog ) / SN 1998bw (catalog ), is a normal dwarf star-forming spiral. None of its properties (Table 2) are exceptionally high or low. In particular its mass, SFR, and size are broadly consistent with the range obtained for a sample of local dwarf galaxies (Fiigures 5 and 17 of Woo et al., 2008, in this respect ESO 184-G82 (catalog ) is very similar to the Large Magellanic Cloud (catalog )) and for a sample of local blue compact galaxies (Figure 2 of Sollerman et al., 2005).
Its specific SFR ( Gyr-1) is consistent with the range of found for other GRB hosts by Castro Cerón et al. (2009) based on UV (but lower than for a subsample detected in mid-IR; Castro Cerón et al., 2006). However its is higher than for the majority of nearby spiral galaxies hosting SNe (see Figure 8 of Thöne et al., 2009). High for other GRB hosts were also reported by, e.g., Christensen et al. (2004) and predicted theoretically by Courty et al. (2004, 2007) and Lapi et al. (2008). This is in agreement with the finding of Iglesias-Páramo et al. (2006, 2007) and Zheng et al. (2007) that low-mass galaxies in general have high .
As stated in Section 4.1, the SED of ESO 184-G82 (catalog ) is consistent with being of a nonstarburst nature. This is also supported by its stellar building time ( Gyr) being not much less than the Hubble time and low SFR per unit area equal to yr-1 kpc-2 (see the relevant discussion in Heckman, 2005).
ESO 184-G82 (catalog ) is the only GRB host with a clear bump in the SED (compare Figure 3 with Figure 4 of Savaglio et al., 2009). According to Sawicki (2002) this feature starts to be apparent for a galaxy older than Myr (see his Figure 1). The preference of not having the bump for other GRB hosts likely indicates that on average they are very young galaxies, although we stress that in many cases the optical and near-IR data presented by Savaglio et al. (2009) do not cover the wavelengths into where the bump is redshifted.
5.2. Radio Detection
The SED model presented in Figure 3 (solid line) overpredicts the radio fluxes by a factor of () in the () cm band. We suggest that this may result from the following effect. Radio wavelengths probe current star formation activity ( yr; Condon, 1992; Cannon & Skillman, 2004), unlike UV (Kennicutt, 1998; Christensen et al., 2004) and IR (Calzetti et al., 2007), at which even older galaxies can be luminous. Therefore it seems likely that only a limited part of the galaxy is younger than yr, so the galaxy is fainter in radio than its UV and IR fluxes would imply. This is supported by Sollerman et al. (2005) who noticed that the colors of the GRB 980425 (catalog ) host are consistent with a constant SFR over 5–7 Gyr without any starburst episode. Therefore if we assume that the IR probes the total SFR, then the radio data point would be a factor of () higher if the radio were also sensitive to star formation older than yr.
We calculated the radio spectral index defined as , so . The radio SED of ESO 184-G82 (catalog ) (see Table 1) is very steep with . This is consistent with the steepest slopes in the sample of ULIRGs discussed by Clemens et al. (2008) and interpreted as an indication of spectral aging of relativistic electrons (the lifetime of high-energy electrons emitting high-frequency radiation is shorter than for low-energy electrons). The same conclusion is drawn by Hirashita & Hunt (2006) who predicted a steepening of the radio slope Myr after a starburst when synchrotron radiation starts to dominate over free-free emission from H II regions (see also Bressan et al., 2002; Cannon & Skillman, 2004). In summary, such a steep radio slope indicates that the bulk of star formation activity in the host of GRB 980425 (catalog ) is not recent.
As mentioned in Section 4.2 the radio SFR for dwarf galaxies can underpredict the true value if derived using usual methods. Since GRB hosts are in general subluminous at all wavelengths (Hogg & Fruchter, 1999; Hanlon et al., 2000; Hjorth et al., 2000, 2002; Vreeswijk et al., 2001; Fynbo et al., 2002, 2003, 2006b; Berger et al., 2003; Le Floc’h et al., 2003, 2006; Christensen et al., 2004; Courty et al., 2004; Tanvir et al., 2004, 2008; Jakobsson et al., 2005; Sollerman et al., 2005, 2006; Fruchter et al., 2006; Priddey et al., 2006; Chary et al., 2007; Ovaldsen et al., 2007; Thöne et al., 2007; Wiersema et al., 2007; Castro Cerón et al., 2009; Savaglio et al., 2009) we suggest that the Bell (2003) relation (Equation (1)) should be used to calculate their radio SFRs. Indeed, in the case of the host of GRB 980425 (catalog ), one would get a value of yr-1 using the method of Yun & Carilli (2002), a value much smaller than the UV SFR. The radio luminosity is supposed to trace both unobscured and obscured SFRs (because radio is not affected by dust), so such a low value is clearly an underestimation of the true SFR. The relation of Bell (2003) is however not necessary (but gives reasonable results) for the high-luminosity subsample of GRB hosts where usual methods result in radio SFRs consistent with other diagnostics (see Table 1 of Michałowski & Hjorth, 2007).
5.3. WR Region
The WR region emits % of the host’s UV flux. Its contribution falls to below % in the near-IR and rises steeply to % in the mid-IR. As mentioned in Sections 4.1 and 4.3, an intense starburst episode together with low stellar mass provide a consistent explanation of the shape of the SED. Indeed our SED fit suggests that the WR region harbors as much as 12–26% of the total star formation activity, but its contribution to the galaxy stellar and dust masses is negligible (see Columns 8 and 10 of Table 2).
The of the WR region is Gyr-1. High in the immediate environment of GRBs was also found by Thöne et al. (2008, see their Figure 4; the spatial resolution was kpc in this case) and is consistent with the findings of Fruchter et al. (2006). We stress that we do not claim here that GRB 980425 is physically connected with the WR region, just that it occurred in the most intense star-forming part of the galaxy (note in Figure 2 that the Southern spiral arm is the only part of the galaxy where X-ray point sources are found, indicative of intense star formation; Kouveliotou et al., 2004). Because of the proximity of the SN region to the WR region, it is very likely that their star formation was triggered by the same mechanism and therefore that the nature of their star formation is similar.
The starburst nature of the WR region is confirmed by its stellar building time ( Myr) being much less than the Hubble time, and its very high SFR per unit area equal to yr-1 kpc-2 (Heckman, 2005).
It is worth noting that the SED of the WR region is qualitatively similar to the SEDs presented by Michałowski et al. (2008) for submillimeter/radio-bright GRB hosts: blue in the optical, luminous in the mid-IR, and indicating hot dust content. The similarities are highlighted in Figure 3 where the WR region model (dashed line) and the model corresponding to GRB 000418 (catalog ) (dotted line) are compared. The agreement is striking, but note that in order to suppress the very high IR luminosity of the host of GRB 000418 (catalog ), we needed to modify the SED model presented by Michałowski et al. (2008) by changing the escape parameter from to Myr (the time after which stars begin to escape from molecular clouds; see Panuzzo et al., 2007, for a discussion of this parameter).
The WR region was also found to be similar to high- GRB hosts with respect to emission line ratios (indicative of age and metallicity), unlike the entire host galaxy ESO 184-G82 (catalog ), which appears to be older than other GRB hosts (Christensen et al., 2008).
The picture that emerges from these findings is that the 1–3 kpc scale environment of a GRB represents the youngest and most intensely star-forming region of a host galaxy, harboring the hottest dust. If present at high redshifts such regions may dominate the emission (and therefore, derived properties) of distant GRB hosts.
6. Conclusions
In this paper we have presented the UV-to-radio SED fitting of the host galaxy of GRB 980425 (catalog ) / SN 1998bw (catalog ) and of the WR region close to the SN position.
The host galaxy of GRB 980425 (catalog ) is a normal dwarf spiral galaxy with somewhat elevated star formation activity compared to other spirals (though it is not necessary to invoke any starburst episode to explain its SED). The steep radio slope and the presence of the bump in the SED indicate the existence of an old stellar population. Its low radio luminosity can be explained by the suppression of synchrotron emission in dwarf galaxies and the fact that radio is only sensitive to recent star formation.
The emission of the WR region close to the GRB position is dominated by an ongoing starburst episode, during which almost all of its stars were formed. It contributes significantly to the star formation of the entire galaxy. In many aspects the WR region is similar to high-redshift GRB hosts: it is a blue, young region of intense star formation containing hot dust. The presence of the GRB close to this region indicates that GRBs appear to be associated with regions of high specific SFR and high dust temperatures.
References
- Bell (2003) Bell E.F., 2003, ApJ, 586, 794
- Berger et al. (2001) Berger E., Kulkarni S.R., Frail D.A., 2001, ApJ, 560, 652
- Berger et al. (2003) Berger E., Cowie L.L., Kulkarni S.R., Frail D.A., Aussel H., Barger A.J., 2003, ApJ, 588, 99
- Bloom et al. (1998) Bloom J.S., Djorgovski S.G., Kulkarni S.R., Frail D.A., 1998, ApJ, 507, L25
- Bloom et al. (2002) Bloom J.S., Kulkarni S.R., Djorgovski S.G., 2002, AJ, 123, 1111
- Bloom et al. (2003) Bloom J.S., Berger E., Kulkarni S.R., Djorgovski S.G., Frail D.A., 2003, AJ, 125, 999
- Bressan et al. (2002) Bressan A., Silva L., Granato G.L., 2002, A&A, 392, 377
- Calzetti et al. (2007) Calzetti D., et al., 2007, ApJ, 666, 870
- Campana et al. (2007) Campana S., et al., 2007, ApJ, 654, L17
- Cannon & Skillman (2004) Cannon J.M., Skillman E.D., 2004, ApJ, 610, 772
- Cardelli et al. (1989) Cardelli J.A., Clayton G.C., Mathis J.S., 1989, ApJ, 345, 245
- Castro Cerón et al. (2006) Castro Cerón J.M., Michałowski M., Hjorth J., Watson D.J., Fynbo J.P.U., Gorosabel J., 2006, ApJL, 653, L85
- Castro Cerón et al. (2009) Castro Cerón J.M., Michałowski M.J., Hjorth J., Malesani D., Gorosabel J., Watson D., Fynbo J.P.U., 2009, ApJ, submitted, arXiv:0803.2235v1 [astro-ph]
- Castro-Tirado et al. (1999) Castro-Tirado A.J., et al., 1999, ApJ, 511, L85
- Chary et al. (2007) Chary R., Berger E., Cowie L., 2007, ApJ, 671, 272
- Chen et al. (2005) Chen H.W., Prochaska J.X., Bloom J.S., Thompson I.B., 2005, ApJ, 634, L25
- Chen et al. (2006) Chen S.L., Li A., Wei D.M., 2006, ApJ, 647, L13
- Christensen et al. (2004) Christensen L., Hjorth J., Gorosabel J., 2004, A&A, 425, 913
- Christensen et al. (2008) Christensen L., Vreeswijk P.M., Sollerman J., Thöne C.C., Le Floc’h E., Wiersema K., 2008, A&A, 490, 45
- Clemens et al. (2008) Clemens M.S., Vega O., Bressan A., Granato G.L., Silva L., Panuzzo P., 2008, A&A, 477, 95
- Cobb et al. (2004) Cobb B.E., Bailyn C.D., van Dokkum P.G., Buxton M.M., Bloom J.S., 2004, ApJ, 608, L93
- Condon (1992) Condon J.J., 1992, ARA&A, 30, 575
- Courty et al. (2004) Courty S., Björnsson G., Gudmundsson E.H., 2004, MNRAS, 354, 581
- Courty et al. (2007) Courty S., Björnsson G., Gudmundsson E.H., 2007, MNRAS, 376, 1375
- Della Valle et al. (2006) Della Valle M., et al., 2006, Nature, 444, 1050
- Devereux & Young (1990) Devereux N.A., Young J.S., 1990, ApJ, 359, 42
- Djorgovski et al. (2001) Djorgovski S.G., Frail D.A., Kulkarni S.R., Bloom J.S., Odewahn S.C., Diercks A., 2001, ApJ, 562, 654
- Draine et al. (2007) Draine B.T., et al., 2007, ApJ, 663, 866
- Ferrero et al. (2006) Ferrero P., et al., 2006, A&A, 457, 857
- Foley et al. (2006) Foley S., Watson D., Gorosabel J., Fynbo J.P.U., Sollerman J., McGlynn S., McBreen B., Hjorth J., 2006, A&A, 447, 891
- Fruchter et al. (2006) Fruchter A.S., et al., 2006, Nature, 441, 463
- Fynbo et al. (2000) Fynbo J.P.U., et al., 2000, ApJ, 542, L89
- Fynbo et al. (2002) Fynbo J.P.U., et al., 2002, A&A, 388, 425
- Fynbo et al. (2003) Fynbo J.P.U., et al., 2003, A&A, 406, L63
- Fynbo et al. (2006a) Fynbo J.P.U., et al., 2006a, A&A, 451, L47
- Fynbo et al. (2006b) Fynbo J.P.U., et al., 2006b, Nature, 444, 1047
- Gal-Yam et al. (2004) Gal-Yam A., et al., 2004, ApJ, 609, L59
- Gal-Yam et al. (2006) Gal-Yam A., et al., 2006, Nature, 444, 1053
- Galama & Wijers (2001) Galama T.J., Wijers R.A.M.J., 2001, ApJ, 549, L209
- Galama et al. (1998) Galama T.J., et al., 1998, Nature, 395, 670
- Hammer et al. (2006) Hammer F., Flores H., Schaerer D., Dessauges-Zavadsky M., Le Floc’h E., Puech M., 2006, A&A, 454, 103
- Hanlon et al. (2000) Hanlon L., et al., 2000, A&A, 359, 941
- Hatsukade et al. (2007) Hatsukade B., et al., 2007, PASJ, 59, 67
- Heckman (2005) Heckman T.M., 2005, In: de Grijs R., González Delgado R.M. (eds.) Starbursts: From 30 Doradus to Lyman Break Galaxies, vol. 329 of Astrophysics and Space Science Library, 3
- Hildebrand (1983) Hildebrand R.H., 1983, QJRAS, 24, 267
- Hirashita & Hunt (2006) Hirashita H., Hunt L.K., 2006, A&A, 460, 67
- Hjorth et al. (2000) Hjorth J., Holland S., Courbin F., Dar A., Olsen L.F., Scodeggio M., 2000, ApJ, 534, L147
- Hjorth et al. (2002) Hjorth J., et al., 2002, ApJ, 576, 113
- Hjorth et al. (2003a) Hjorth J., et al., 2003a, ApJ, 597, 699
- Hjorth et al. (2003b) Hjorth J., et al., 2003b, Nature, 423, 847
- Hogg & Fruchter (1999) Hogg D.W., Fruchter A.S., 1999, ApJ, 520, 54
- Holland & Hjorth (1999) Holland S., Hjorth J., 1999, A&A, 344, L67
- Holmberg et al. (1977) Holmberg E.B., Lauberts A., Schuster H.E., West R.M., 1977, A&AS, 27, 295
- Iglesias-Páramo et al. (2006) Iglesias-Páramo J., et al., 2006, ApJS, 164, 38
- Iglesias-Páramo et al. (2007) Iglesias-Páramo J., et al., 2007, ApJ, 670, 279
- Iwamoto et al. (1998) Iwamoto K., et al., 1998, Nature, 395, 672
- Jakobsson et al. (2005) Jakobsson P., et al., 2005, MNRAS, 362, 245
- Jakobsson et al. (2006a) Jakobsson P., et al., 2006a, A&A, 460, L13
- Jakobsson et al. (2006b) Jakobsson P., et al., 2006b, A&A, 447, 897
- Jarrett et al. (2000) Jarrett T.H., Chester T., Cutri R., Schneider S., Skrutskie M., Huchra J.P., 2000, AJ, 119, 2498
- Kennicutt (1998) Kennicutt R.C., 1998, ARA&A, 36, 189
- Kouveliotou et al. (2004) Kouveliotou C., et al., 2004, ApJ, 608, 872
- Kovács et al. (2006) Kovács A., Chapman S.C., Dowell C.D., Blain A.W., Ivison R.J., Smail I., Phillips T.G., 2006, ApJ, 650, 592
- Lamb & Reichart (2000) Lamb D.Q., Reichart D.E., 2000, ApJ, 536, 1
- Lapi et al. (2008) Lapi A., Kawakatu N., Bosnjak Z., Celotti A., Bressan A., Granato G.L., Danese L., 2008, MNRAS, 386, 608
- Le Floc’h et al. (2003) Le Floc’h E., et al., 2003, A&A, 400, 499
- Le Floc’h et al. (2006) Le Floc’h E., Charmandaris V., Forrest W.J., Mirabel I.F., Armus L., Devost D., 2006, ApJ, 642, 636
- Malesani et al. (2004) Malesani D., et al., 2004, ApJ, 609, L5
- Martin et al. (2003) Martin C., et al., 2003, In: Blades J.C., Siegmund O.H.W. (eds.) Future EUV/UV and Visible Space Astrophysics Missions and Instrumentation. Edited by J. Chris Blades, Oswald H. W. Siegmund. Proceedings of the SPIE, Volume 4854, pp. 336-350 (2003)., vol. 4854 of Presented at the Society of Photo-Optical Instrumentation Engineers (SPIE) Conference, 336–350
- Martin et al. (2005) Martin D.C., et al., 2005, ApJ, 619, L1
- Matheson et al. (2003) Matheson T., et al., 2003, ApJ, 599, 394
- Michałowski & Hjorth (2007) Michałowski M.J., Hjorth J., 2007, AIPC, 924, 143
- Michałowski et al. (2008) Michałowski M.J., Hjorth J., Castro Cerón J.M., Watson D., 2008, ApJ, 672, 817
- Mirabal et al. (2006) Mirabal N., Halpern J.P., An D., Thorstensen J.R., Terndrup D.M., 2006, ApJ, 643, L99
- Modjaz et al. (2006) Modjaz M., et al., 2006, ApJ, 645, L21
- Östlin et al. (2008) Östlin G., Zackrisson E., Sollerman J., Mattila S., Hayes M., 2008, MNRAS, 387, 1227
- Ovaldsen et al. (2007) Ovaldsen J.E., et al., 2007, ApJ, 662, 294
- Panuzzo et al. (2007) Panuzzo P., Granato G.L., Buat V., Inoue A.K., Silva L., Iglesias-Páramo J., Bressan A., 2007, MNRAS, 375, 640
- Patat et al. (2001) Patat F., et al., 2001, ApJ, 555, 900
- Pian et al. (2006) Pian E., et al., 2006, Nature, 442, 1011
- Priddey et al. (2006) Priddey R.S., Tanvir N.R., Levan A.J., Fruchter A.S., Kouveliotou C., Smith I.A., Wijers R.A.M.J., 2006, MNRAS, 369, 1189
- Prochaska et al. (2007a) Prochaska J.X., et al., 2007a, ApJS, 168, 231
- Prochaska et al. (2007b) Prochaska J.X., Chen H.W., Dessauges-Zavadsky M., Bloom J.S., 2007b, ApJ, 666, 267
- Prochaska et al. (2008) Prochaska J.X., Dessauges-Zavadsky M., Ramirez-Ruiz E., Chen H.W., 2008, ApJ, 685, 344
- Ruiz-Velasco et al. (2007) Ruiz-Velasco A.E., et al., 2007, ApJ, 669, 1
- Sault & Killeen (2004) Sault R.J., Killeen N.E.B., 2004, The Miriad User’s Guide. Australia Telescope National Facility, Sydney, (http://www.atnf.csiro.au/computing/software/miriad/)
- Savaglio et al. (2003) Savaglio S., Fall S.M., Fiore F., 2003, ApJ, 585, 638
- Savaglio et al. (2009) Savaglio S., Glazebrook K., LeBorgne D., 2009, ApJ, 691, 182
- Sawicki (2002) Sawicki M., 2002, AJ, 124, 3050
- Schlegel et al. (1998) Schlegel D.J., Finkbeiner D.P., Davis M., 1998, ApJ, 500, 525
- Seaquist et al. (2004) Seaquist E., Yao L., Dunne L., Cameron H., 2004, MNRAS, 349, 1428
- Silva et al. (1998) Silva L., Granato G.L., Bressan A., Danese L., 1998, ApJ, 509, 103
- Soderberg et al. (2006) Soderberg A.M., et al., 2006, Nature, 442, 1014
- Sodroski et al. (1997) Sodroski T.J., Odegard N., Arendt R.G., Dwek E., Weiland J.L., Hauser M.G., Kelsall T., 1997, ApJ, 480, 173
- Sollerman et al. (2002) Sollerman J., et al., 2002, A&A, 386, 944
- Sollerman et al. (2005) Sollerman J., Östlin G., Fynbo J.P.U., Hjorth J., Fruchter A., Pedersen K., 2005, New Astronomy, 11, 103
- Sollerman et al. (2006) Sollerman J., et al., 2006, A&A, 454, 503
- Stanek et al. (2003) Stanek K.Z., et al., 2003, ApJ, 591, L17
- Stevens et al. (2005) Stevens J.A., Amure M., Gear W.K., 2005, MNRAS, 357, 361
- Stratta et al. (2004) Stratta G., Fiore F., Antonelli L.A., Piro L., De Pasquale M., 2004, ApJ, 608, 846
- Tanvir et al. (2004) Tanvir N.R., et al., 2004, MNRAS, 352, 1073
- Tanvir et al. (2008) Tanvir N.R., et al., 2008, MNRAS, 388, 1743
- Taylor et al. (2005) Taylor E.L., et al., 2005, MNRAS, 361, 1352
- Thomsen et al. (2004) Thomsen B., et al., 2004, A&A, 419, L21
- Thöne et al. (2007) Thöne C.C., Greiner J., Savaglio S., Jehin E., 2007, ApJ, 671, 628
- Thöne et al. (2008) Thöne C.C., et al., 2008, ApJ, 676, 1151
- Thöne et al. (2009) Thöne C.C., Michałowski M.J., Leloudas G., Cox N.L.J., Fynbo J.P.U., Sollerman J., Hjorth J., Vreeswijk P.M., 2009, ApJ, submitted, arXiv:0807.0473v1 [astro-ph]
- Tinney et al. (1998) Tinney C., et al., 1998, IAU Circ., 6896, 1
- Tody (1986) Tody D., 1986, In: Crawford D.L. (ed.) Instrumentation in astronomy VI; Proceedings of the Meeting, Tucson, AZ, Mar. 4-8, 1986. Part 2 (A87-36376 15-35). Bellingham, WA, Society of Photo-Optical Instrumentation Engineers, 1986, p. 733., vol. 627 of Presented at the Society of Photo-Optical Instrumentation Engineers (SPIE) Conference, 733
- Tody (1993) Tody D., 1993, In: Hanisch R.J., Brissenden R.J.V., Barnes J. (eds.) Astronomical Data Analysis Software and Systems II, vol. 52 of Astronomical Society of the Pacific Conference Series, 173
- Vreeswijk et al. (2001) Vreeswijk P.M., et al., 2001, ApJ, 546, 672
- Vreeswijk et al. (2004) Vreeswijk P.M., et al., 2004, A&A, 419, 927
- Watson et al. (2004) Watson D., Hjorth J., Jakobsson P., Pedersen K., Patel S., Kouveliotou C., 2004, A&A, 425, L33
- Watson et al. (2006) Watson D., et al., 2006, ApJ, 652, 1011
- Watson et al. (2007) Watson D., Hjorth J., Fynbo J.P.U., Jakobsson P., Foley S., Sollerman J., Wijers R.A.M.J., 2007, ApJ, 660, L101
- Wiersema et al. (2007) Wiersema K., et al., 2007, A&A, 464, 529
- Wilson et al. (2008) Wilson C.D., et al., 2008, ApJS, 178, 189
- Woo et al. (2008) Woo J., Courteau S., Dekel A., 2008, MNRAS, 390, 1453
- Yun & Carilli (2002) Yun M.S., Carilli C.L., 2002, ApJ, 568, 88
- Zheng et al. (2007) Zheng X.Z., Bell E.F., Papovich C., Wolf C., Meisenheimer K., Rix H.W., Rieke G.H., Somerville R., 2007, ApJ, 661, L41