The Nearest OB Association: Scorpius-Centaurus (Sco OB2)
Abstract
We summarize observational results on the stellar population and star formation history of the Scorpius-Centaurus OB Association (Sco OB2), the nearest region of recent massive star formation. It consists of three subgroups, Upper Scorpius (US), Upper Centaurus-Lupus (UCL), and Lower Centaurus-Crux (LCC) which have ages of about 5, 17, and Myr. While the high- and intermediate mass association members have been studied for several decades, the low-mass population remained mainly unexplored until rather recently.
In Upper Scorpius, numerous studies, in particular large multi-object spectroscopic surveys, have recently revealed hundreds of low-mass association members, including dozens of brown dwarfs. The investigation of a large representative sample of association members provided detailed information about the stellar population and the star formation history. The empirical mass function could be established over the full stellar mass range from up to , and was found to be consistent with recent determinations of the field initial mass function. A narrow range of ages around 5 Myr was found for the low-mass stars, the same age as had previously (and independently) been derived for the high-mass members. This supports earlier indications that the star formation process in US was triggered, and agrees with previous conjectures that the triggering event was a supernova- and wind-driven shock-wave originating from the nearby UCL group.
In the older UCL and LCC regions, large numbers of low-mass members have recently been identified among X-ray and proper-motion selected candidates. In both subgroups, low-mass members have also been serendipitously discovered through investigations of X-ray sources in the vicinity of better known regions (primarily the Lupus and TW Hya associations). While both subgroups appear to have mean ages of 16 Myr, they both show signs of having substructure. Their star-formation histories may be more complex than that of the younger, more compact US group.
Sco-Cen is an important “astrophysics laboratory” for detailed studies of recently formed stars. For example, the ages of the sub-groups of 5 Myr and Myr are ideal for studying how circumstellar disks evolve. While no more than a few percent of the Sco-Cen members appear to be accreting from a circumstellar disk, recent Spitzer results suggest that at least 35% still have cold, dusty, debris disks.
Max-Planck-Institut für Radioastronomie, Auf dem
Hügel 69, D–53121 Bonn, Germany
Universitäts-Sternwarte München,
Scheinerstr. 1, D-81679 München, Germany
Harvard-Smithsonian Center for Astrophysics, 60 Garden Street, MS-42, Cambridge, MA 02138, USA
1. Star Formation in OB Associations
OB associations were first recognized by Blaauw (1946) and Ambartsumian (1947) as extended moving groups of blue luminous stars. They are defined as loose stellar systems (stellar mass density of ) containing O- and/or early B-type stars (for a recent review see Briceno et al. 2007). At such low densities, the associations are unstable against Galactic tidal forces, and therefore it follows from their definition that OB associations must be young ( Myr) entities. Most of their low-mass members are therefore still in their pre-main sequence (PMS) phase.
There are different models for the origin of OB associations. One possibility is that they start as initially dense clusters, which get unbound and expand quickly as soon as the massive stars expel the gas (see Kroupa et al. 2001). An alternative model assumes that OB associations originate from unbound turbulent giant molecular clouds (see Clark et al. 2005), i.e. start already in a spatially extended configuration and thus form in a fundamentally different way than dense, gravitationally bound clusters. Many well investigated OB associations show remarkably small internal velocity dispersions (often km/sec), which are in some cases much smaller than required to explain the large present-day size (typically tens of parsecs) by expansion over the age of the association. This excludes the expanding cluster model and provides strong support for an origin as an extended unbound cloud for these associations.
The considerable number of OB associations in the solar neighborhood (e.g., de Zeeuw et al. 1999) suggests that they account for a large, maybe the dominant, fraction of the total Galactic star formation. A good knowledge of their stellar content is thus essential in order to understand the nature of the star formation process not only in OB associations but also on Galactic scales.
For many years star formation was supposed to be a bimodal process (e.g. Larson 1986; Shu & Lizano 1988) according to which high- and low-mass stars should form in totally different sites. Although it has been long established that low-mass stars can form alongside their high-mass siblings in nearby OB associations (e.g. Herbig 1962), it is still not well known what quantities of low-mass stars are produced in OB environments. There have been many claims that high-mass star forming regions have a truncated initial mass function (IMF), i.e. contain much smaller numbers of low-mass stars than expected from the field IMF (see, e.g., Slawson & Landstreet 1992; Leitherer 1998; Smith et al. 2001; Stolte et al. 2005). Possible explanations for such an effect are often based on the strong radiation and winds from the massive stars. For example, increased radiative heating of molecular clouds may raise the Jeans mass; lower-mass cloud cores may be completely dispersed by photoevaporation before low-mass protostars can even begin to form; the radiative destruction of CO molecules should lead to a change in the equation of state of the cloud material, affecting the fragmentation processes and ultimately leading to the formation of a few massive stars rather than the “normal” IMF which is dominated by low-mass stars (e.g. Li et al. 2003). However, several well investigated massive star forming regions show no evidence for an IMF cutoff (see, e.g., Brandl et al. 1999; Brandner et al. 2001; Sabbi et al. 2008, for the cases of NGC 3603, 30 Dor, and NGC 346, respectively), and notorious difficulties in IMF determinations of distant regions may easily lead to wrong conclusions about IMF variations (see, e.g., discussion in Selman & Melnick 2005; Zinnecker, McCaughrean, & Wilking 1993).
If the IMF in OB associations is not truncated and similar to the field IMF, it would follow that most of the total stellar mass is found in low-mass stars. This would then imply that most of the current Galactic star formation is taking place in OB associations (as initially suggested by Miller & Scalo 1978), and the typical environment for forming stars (and planets) would be close to massive stars and not in isolated regions like Taurus. The presence of nearby massive stars affects the evolution of young stellar objects and their protoplanetary disks in OB environments. For example, photoevaporation by intense UV radiation can remove a considerable amount of circumstellar material around young stellar objects (e.g., Bally et al. 1998; Richling & Yorke 1998), and these objects will therefore ultimately end up with smaller final masses than if they were located in isolated regions (Whitworth & Zinnecker 2004). Although generally considered to be a threat for forming planetary systems, photoevaporation may actually help to form planets, as it seems to play an important role in the formation of planetesimals (Throop & Bally 2005).
OB associations provide excellent targets to investigate these effects on the formation and evolution of low-mass stars (and their forming planetary systems) during ages between a few Myr and a few ten Myr. However, before one can study the low-mass members, one first has to find them. Although this statement sounds trivial, the major obstacle on the way towards a reliable knowledge of the low-mass population in OB associations is the problem to identify the individual low-mass members. Unlike stellar clusters, which can be easily recognized on the sky, OB associations are generally very inconspicuous: since they extend over huge areas in the sky (often several hundred square-degrees for the nearest examples), most stars in the area actually are unrelated foreground or background stars. Finding the association members among these field stars is often like finding needles in a haystack. As the low-mass members are often too faint for proper-motion studies, the only reliable sign to discern between low-mass association members and unrelated, much older field stars is the strength of the 6708 Å lithium line in the stellar spectrum: at ages of Myr, the low-mass association members still have most of their initial Li preserved and show a strong Li line, whereas the older foreground and background field stars do not show this line since they have already depleted their primordial Li (e.g., D’Antona & Mazzitelli 1994). However, an accurate measurement of Li line width requires at least intermediate resolution spectroscopy, and thus the observational effort to identify the widespread population of PMS stars among the many thousands of field stars is huge. Many empirical IMF determinations are therefore based on photometric data only; while this strategy rather easily provides a complete spatial coverage and allows one to work with large samples, photometry alone cannot give completely reliable membership information. Most studies with spectroscopically identified member samples, on the other hand, include only very small fractions of the total stellar population and are strongly affected by small number statistics and the necessity of using large extrapolation factors. Therefore, most studies dealing with OB associations have been restricted to estimating the number-ratio of low-mass versus high-mass members (e.g. Walter et al. 1994; Dolan & Mathieu 2002; Sherry et al. 2004).
During the last years, new and very powerful multiple-object spectrographs like 2dF at the Anglo-Australian Telescope (see Lewis et al. 2002) made large spectroscopic surveys for low-mass PMS members feasible. In combination with the Hipparcos results, which allowed the complete identification of the high- and intermediate-mass stellar population in many nearby associations (see de Zeeuw et al. 1999), studies of the complete stellar population in OB associations are now possible, enabling us to investigate in detail the spatial and temporal relationships between high- and low-mass members.
In this chapter, we review the state of knowledge regarding the stellar populations of the nearest OB association: Scorpius-Centaurus (Sco OB2). We structure this chapter in the following manner. Section 2 gives a general, and historical, overview of the association and its subgroups. Sections 3, 4, and 5 discuss the surveys for the members of the three primary subgroups of Sco-Cen: Upper Scorpius, Upper Centaurus-Lupus, and Lower Centaurus-Crux, respectively. Readers uninterested in the individual surveys may want to skip ahead to Section 6, where we discuss the astrophysical ramifications, and interpretations, of studies of the Sco-Cen members.
2. The Scorpius-Centaurus OB Association
2.1. Morphology and Nomenclature of the Subgroups
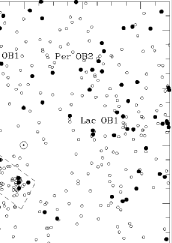
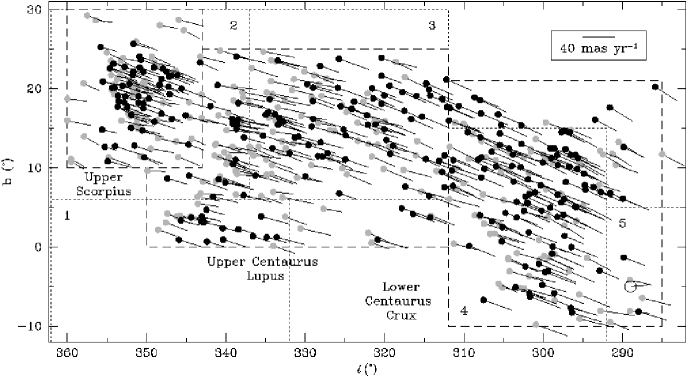
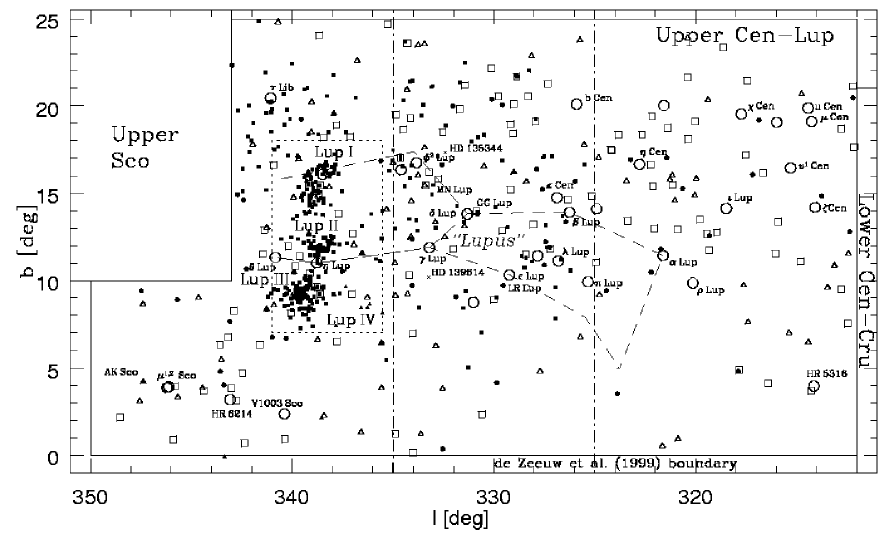
The Scorpius-Centaurus (Sco-Cen) association is the OB association nearest to the Sun (see Fig. 1). It contains at least 150 B stars which concentrate in the three subgroups Upper Scorpius (US111As a historical note, in pre-1960s literature, one also finds that Upper Scorpius was called II Sco (Morgan et al. 1953), Collinder 302, or the Antares Moving Group (Collinder 1931). All three names have fallen into disuse.), Upper Centaurus-Lupus (UCL), and Lower Centaurus-Crux (LCC; Fig. 2; cf. Blaauw 1964, 1991; de Zeeuw et al. 1999). There is one O-type star associated with Sco-Cen: the runaway O9V star Oph. The currently recognized Sco OB2 subgroups were defined by Blaauw (1946): Subgroup #2 is US, #3 is UCL, and #4 is LCC. de Geus, de Zeeuw, & Lub (1989) derived ages for the B-type stars in the different subgroups from the main sequence turnoff in the HR diagram and found that Upper Scorpius is the youngest subgroup ( Myr), whereas Lower Centaurus Crux ( Myr) and Upper Centaurus-Lupus ( Myr) are considerably older222Note that Mamajek et al. (2002) revised these ages to Myr for Lower Centaurus-Crux and Myr for Upper Centaurus-Lupus..
2.2. A Century of Sco-Cen Research
Although the focus of our review is the low-mass membership of Sco-Cen, it is worth reviewing the history regarding the unveiling of the group’s membership333Much of the early research on Sco-Cen is not yet electronically available through ADS (http://adsabs.harvard.edu/). The most valuable list of pre-1973 references on Sco-Cen is in the “Alter” files accessible through Vizier (http://vizier.u-strasbg.fr/, catalogs VII/31B and VII/101A), which complement the “Catalogue of Star Clusters and Associations” (Ruprecht, Balazs, & White 1982, 1983). Relevant Sco-Cen references are given under “Sco OB2” and “Collinder 302”. For most of the past century “Sco-Cen” was studied as a single entity, and only the highest mass members (earlier than B5-type) were called “members” with any degree of confidence. The discovery of the low-mass population (FGKM stars) in large numbers has only recently become technically feasible. Many early studies of Sco-Cen involved isolating the members from the field population through kinematic and photometric means. Sco-Cen contained a large sample of B-type stars with large, convergent proper motions, which provided a critical lower rung in the Galactic (and cosmic) distance ladder (e.g. Morgan et al. 1953). Our brief historical review here is not exhaustive, but complements the recent summary by de Zeeuw et al. (1999, their Sect. 4.1).
Around 1910, large compilations of proper motion and spectral type data were becoming available for Galactic structure investigations – primarily Lewis Boss’s (1910) Preliminary General Catalog and the spectral type compilations from the Henry Draper Memorial project (e.g. Cannon & Pickering 1901). Kapteyn (1914) appears to have been the first to make a convincing case that the B-type “helium” stars in the Scorpius-Centaurus region demonstrate convergent proper motions, and constituted a moving group. Subsequent work on the association during the early 20th century revolved around testing the reality of the group, ascertaining its membership, and (most importantly for the rest of the astronomical community) estimating the group’s distance. The importance of understanding, and exploiting, this conspicuous group of bright B-type stars was not lost on Kapteyn (1914): “The real question of importance is this: is the parallelism and equality of motion in this part of the sky [Sco-Cen] of such a nature that we can derive individual parallaxes?”
The reality of Sco-Cen as a moving group was challenged, most notably, by Smart (1936, 1939), and Petrie (1962). Some primary objections raised by these authors were that (1) the convergent point of the Sco-Cen proper motions was so close to the solar antapex that it could be construed simply as solar reflex motion on unrelated B-type stars in the field, (2) the group was so dispersed that it should disintegrate on a short time scale, and (3) the Sco-Cen space motion varied as one isolated different subsamples within the group, enough so to cast doubt on the derived cluster parallaxes for the constituent stars. Many of the kinematic objections by Smart and others were addressed by Adriaan Blaauw (1946) in his PhD thesis, which concluded that Sco-Cen was indeed a true moving group. Perhaps Blaauw’s (1946) most amusing retort was in telling the Regius Chair of Astronomy at Glasgow to simply look up (p. 19): “Smart has not paid attention to the fact that the existence of the cluster is evident from the apparent distribution of the bright stars in the sky.”
In hindsight, the first objection is understandable as the young stars in the solar neighborhood form from molecular gas which itself has small peculiar motions with respect to the LSR (Stark & Brand 1989). The last two objections are symptomatic of OB associations in general, when compared to the more coherent kinematic groups like the Hyades cluster. As one of the few nearby OB associations with appreciable proper motion, the kinematic studies of Blaauw, and others, were critical to understanding the dynamical state of OB associations in general. The modern consensus (e.g. Blaauw 1964; de Zeeuw et al. 1999) is that Sco-Cen constitutes a moving group, but that it has subgroups isolated by position, age, and space motion, and that these structures are young and unbound. Investigations of the expansion of the Sco-Cen subgroups have been undertaken by Bertiau (1958), Jones (1971), and Madsen et al. (2002). A modern study using the radial velocities of the low-mass members is sorely needed to confirm, and build upon, these findings.
The most recent investigation of the membership of high-mass stars in Scorpius-Centaurus was carried out by de Zeeuw et al. (1999). They used Hipparcos proper motions and parallaxes in conjunction with two moving group methods in order to accurately establish the high-mass (and sometimes intermediate mass) stellar content of 12 nearby OB associations. In Sco-Cen the membership of nearly 8000 Hipparcos Catalogue stars was investigated. A total of 120 stars in US, 221 stars in UCL, and 180 stars in LCC were identified as high probability members. The mean distances of the subgroups, derived from the Hipparcos parallaxes, are 145 pc for US, 140 pc for UCL, and 118 pc for LCC.
2.3. The Sco-Cen Complex
The vicinity of Sco-Cen is rich with well-studied sites of current, and recently terminated, star-formation. Besides the Ophiuchus and Lupus star-forming regions, there are other dark clouds, T associations, and somewhat older “outlying” stellar groups which appear to be genetically related to Sco-Cen by virtue of their ages, positions, and space motions (Mamajek & Feigelson 2001). Several of these are described elsewhere in this volume. These neighboring regions demonstrate a broad evolutionary spectrum of star formation. They include dark clouds with little, if any, star-formation activity (e.g. Musca, Coalsack, Pipe Nebula, Cha III), molecular cloud complexes that are currently forming stars (e.g. Cha I & II, CrA), and several recently discovered groups of Myr-old stars with little or no trace of the dark clouds from which they formed (e.g. the TW Hya, Pic, Cha, Cha groups). In an investigation of the origins of the Cha cluster, Mamajek, Lawson, & Feigelson (2000) and Mamajek & Feigelson (2001) found that many nearby, young groups, and isolated young stars, in the southern hemisphere within 200 pc (e.g. Cha, TW Hya, Pic, Cha, CrA, etc.) are not only spatially close to the Sco-Cen OB association, but moving away from the subgroups. The star-forming clouds in Oph, CrA, and Cha I manifest head-tail morphologies, with the star-forming “heads” on the side facing Sco OB2. More detailed investigations of the space motions and star-formation histories of the associations in this region are needed, however the preliminary results suggest that star-formation in these small “satellite” groups near Sco-Cen may have been triggered by the massive star-formation event in the primary Sco-Cen subgroups (see, e.g. the comprehensive model scenario for the formation of the Sco-Cen association and the young stellar groups proposed by Fernandez et al. 2008).
The Sco-Cen region, including the OB subgroups, molecular clouds, and outlying associations, may be thought of as a small star-forming complex (Elmegreen et al. 2000). The Sco-Cen complex has been variously referred to as the Oph-Sco-Cen association (OSCA; Blaauw 1991), Greater Sco-Cen (Mamajek & Feigelson 2001), or, perhaps with tongue in cheek, the Oph-Sco-Lup-Cen-Cru-Mus-Cha star-formation region (Lépine & Sartori 2003). Throughout this review, we will mostly limit our discussions to the 3 subgroup regions outlined by Fig. 2 (US, UCL, LCC), but excluding the regions associated with the Ophiuchus and Lupus molecular cloud complexes (see chapters by Wilking et al. and Comerón). Both complexes are within de Zeeuw et al. (1999) projected boundaries of US and UCL, respectively, and are approximately co-distant with the subgroups ( pc).
There is no evidence for ongoing star formation activity in the OB subgroups of Sco-Cen itself. This makes it an ideal target for an investigation of the outcome of the recently completed star formation process. The area is essentially free of dense gas and dust clouds, and the association members show only very moderate extinctions ( mag). This is probably the consequence of the massive stellar winds and several supernova explosions, which have cleared the region from diffuse matter and created a huge system of loop-like H I structures around the association. These loop structures have a total mass of about and seem to be the remnants of the original giant molecular cloud in which the OB subgroups formed (cf. de Geus 1992).
2.4. Other Proposed Subgroups
For historical completeness, we mention some candidate stellar groups in the vicinity of Sco-Cen which have been proposed, but later refuted. de Zeeuw et al. (1999) was unable to verify the existence of kinematic groups in Blaauw’s (1946) areas #1 (CrA region) and #5 (Car-Vel region). Blaauw’s areas #6 and #7 correspond to the modern-day Vel OB2 and Collinder 121 associations, however they were sufficiently detached from groups #2-#4 in position, distance, and velocity, that Blaauw (1946) did not include them in his final census of Sco-Cen groups.
Makarov & Urban (2000) claimed to have discovered a moving group of X-ray bright stars adjacent to LCC in Carina-Vela, in essentially the same region as Blaauw’s subgroup #5. They claimed that the new group is a “near extension of the Sco-Cen complex” and that the open cluster IC 2602 was part of this group. The status of Car-Vel as a coherent group is very unlikely, let alone any relation to Sco-Cen. Makarov & Urban (2000) show that the inferred “kinematic” parallaxes for their proposed Car-Vel membership show a disturbing “finger-of-god” effect with distances ranging from pc, with a large gap in the distribution. Closer examination of the kinematic and spectroscopic data for these stars by Jensen et al. (2004, and in prep.) show that the objects appear to constitute a heterogeneous sample of low-mass members of IC 2602 and the Car cluster (= Platais 8), and probable Gould Belt stars with a large range of distances. Zuckerman & Song (2004) claim that a subsample of the Car-Vel stars at d pc constitute a previously unknown nearby Myr-old group, which they dub “Carina-Near”. Regardless, the Carina stars appear to be unrelated to Sco-Cen. The consensus from studies of the high mass and low mass populations appears to be that the western “edge” of Sco-Cen lies near Galactic longitude 290∘.
Recently, Eggen (1998) and Sartori et al. (2003) suggested that an OB association spatially contiguous to LCC might exist to the south in Chamaeleon. While there are a total of 4 known B stars associated with the Cha I (2), Cha (1), and Cha (1) kinematic groups in Chamaeleon, Mamajek (2003) argued that the kinematic and stellar density data are inconsistent with the idea of an OB association in Cha, at least of the size proposed by Sartori et al. (2003, 21 B-type stars). Their sample appears to be dominated by field stars completely unrelated to the Chamaeleon molecular clouds or Sco-Cen.
3. Upper Scorpius (US)
The Upper Scorpius association is the best studied part of the Sco-Cen complex. Despite its rather young age ( Myr) and the neighborhood to the Oph molecular cloud (see chapter by Wilking et al. in this book), which is located in front of the southeastern edge of US and is well known for its strong star formation activity, there are no indications for ongoing star formation in US. Below we will make a distinction between the high- and the low-mass stellar population. The former refers to stars of spectral types F and earlier () whose membership of US was established using Hipparcos data (de Zeeuw et al. 1999). The latter refers to G, K, and M stars in the mass range M⊙ for which membership was established from their PMS character.
3.1. The High-Mass Stellar Population
de Zeeuw et al. (1999) investigated the membership of 1215 stars in US listed in the Hipparcos Catalogue; 120 of these were identified as genuine members. The spectral types of the members on the (pre-)main-sequence range from B0.5V to G5V, and there are some evolved stars with giant luminosity classes (including the M1.5 supergiant Antares [ Sco]). The most massive star in US was presumably a O5–O6 star, which exploded as a supernova about 1.5 Myr ago. Hoogerwerf et al. (2001) suggested that the pulsar PSR J1932+1059 is the remnant of this supernova and that the runaway star Oph was the previous binary companion of the supernova progenitor and was ejected by the explosion. However, the new parallax of PSR J1932+1059 determined by Chatterjee et al. (2004) challenged this scenario. The new data suggest that the pulsar was probably not the former binary companion of Oph, but it is still possible that PSR J1932+1059 was created in US Myr ago.
The 120 kinematic members of US cover an area of about 150 deg2 on the sky. The large intrinsic size of the association suggests that the spread of individual stellar distances cannot be neglected. The projected diameter on the sky is which at the distance of US corresponds to pc. However, while the Hipparcos data allow the determination of a very accurate mean distance of pc for US (de Zeeuw et al. 1999), the errors on the trigonometric parallaxes ( mas) are too large to resolve the internal spatial structure. The only conclusion that can be drawn directly from the Hipparcos parallaxes is that the line-of-sight depth of US cannot be much larger than pc. This prompted de Bruijne (1999) to carry out a more detailed investigation of the Hipparcos members of Scorpius-Centaurus by performing a careful kinematic modeling of the proper motion and parallax data. He used a maximum likelihood scheme based on a generalized moving-cluster method to derive secular (or ‘kinematically improved’) parallaxes for the association members. He showed that the method is robust and that the secular parallaxes are a factor of more precise than the Hipparcos trigonometric parallaxes. The secular parallaxes for the members of US show a much reduced line-of-sight dispersion, confirming that the dominant part of the scatter in the Hipparcos distances is caused by the trigonometric parallax errors and not by a large intrinsic dispersion of individual stellar distances. The distribution of secular parallaxes for US is not resolved, which means that the distance spread cannot be larger than pc. Hence one can assume that US has a roughly spherical shape, i.e. that the intrinsic spread of distances is about pc from the mean value of 145 pc.
Previous investigations of the IMF of US focused on the high- to intermediate mass stellar content. de Geus, de Zeeuw, & Lub (1989) established the membership of stars in US using Walraven multi-color photometry, and determined their physical parameters ( and ), from which they derived stellar masses. Brown (1998) used the preliminary results on membership from the Hipparcos data to determine the luminosity function for the high-mass stars using the Hipparcos parallaxes, and then transformed a smoothed version of this into a mass function using the mass-luminosity relation listed in Miller & Scalo (1979). Adopting a conservative completeness limit of , which corresponds to masses of about , he concluded that down to this mass limit the IMF is consistent with a single power-law with slope . There are, however, several problems with this determination of the IMF, most importantly the fact that a mass-luminosity relation had been used that might not be appropriate for young stars (see discussion in Brown 1998).
Finally, Hoogerwerf (2000) attempted to extend the completeness of the kinematic studies of the membership of US toward lower masses by making use of the TRC and ACT astrometric catalogs (Høg et al. 1998; Kuzmin et al. 1999; Urban et al. 1998), which are believed to be complete to . He selected some 250 candidate members with from these catalogs by searching for stars with proper motions consistent with those of the Hipparcos association members, and which lie mag below and mag above the main sequence in the color-magnitude diagram. However, we note that the second selection criterion actually excludes most of the late-type association members, which, at an age of about 5 Myr, lie well above the main sequence.
3.2. Searches for Low-Mass Members
Numerous studies have tried to reveal low-mass stars in US. Most of these, however, focused on very small subregions of the association. For example, Meyer, Wilking, & Zinnecker (1993) studied IRAS sources in a deg2 field near Sco and found 4 young stars. Sciortino et al. (1998) used deep pointed ROSAT X-ray observations to search for PMS stars in a deg2 area and found several candidates for PMS stars. Martín et al. (1998) analyzed pointed ROSAT observations in the vicinity of the Oph star forming region and found a number of additional PMS stars in this area.
The first systematic search for low-mass members covering a significant part of US was performed by Walter et al. (1994), who obtained spectroscopy and photometry for the optical counterparts of X-ray sources detected in 7 individual EINSTEIN fields. They classified 28 objects as low-mass PMS stars and placed them into the HR-diagram. They found a remarkably small dispersion in stellar ages444Martín (1998) suggested that the spread in Li line widths in these stars is an indication of a large age spread. However, this interpretation would be very difficult to reconcile with the locations of the stars in the HR diagram and would require a much larger spread in the individual stellar distances of the low-mass stars than the best estimate of the line-of-sight depth of about pc derived from the Hipparcos data for the massive members. and interpreted this as an indication that the formation of these stars was triggered by some external event.
In another study, M. Kunkel investigated the optical counterparts of more than 200 ROSAT All Sky Survey (RASS) X-ray sources in a deg2 area in US and UCL (see Köhler et al. 2000, for a list of these stars). 32 objects in this sample that are located in US can be classified as new low-mass members (cf. Preibisch & Zinnecker 1999).
A deep search for very-low mass PMS star and brown dwarf candidates in US was presented by Ardila, Martín, & Basri (2000). Their photometric survey covered an area of 14 deg2 and yielded some 100 candidate members. Low-resolution spectroscopy for some of these candidates led to the classification of 20 stars with strong H emission as potential association members. For eleven of these candidates Mohanty et al. (2004) and Mohanty, Jayawardhana, & Basri (2004) performed high-resolution optical spectroscopy and derived stellar parameters. They showed that five of these objects have masses M⊙, i.e. are brown dwarfs. Martín, Delfosse, & Guieu (2004) presented low-resolution optical spectroscopy of further candidate very low-mass members of US. Their analysis indicated that 28 of these objects are most likely members of US, and 18 objects have spectral types in the range M6.5–M9, i.e. are likely young brown dwarfs.
Argiroffi et al. (2006) analyzed deep XMM-Newton X-ray observations of two fields in US. Among the 224 detected X-ray sources they identified 22 stars as photometric member candidates, 13 of which were not known to be association members before. Slesnick et al. (2006) presented a wide-field optical/near-infrared photometric survey of US. Follow-up spectroscopy of selected stars led to the identification of 43 new low-mass members with estimated masses in the range, 30 of which are likely new brown dwarf members of US. Finally, Lodieu et al. (2006) identified about a dozen additional new likely low-mass members of US from an analysis of UKIRT Infrared Deep Sky Survey Early Data Release data of a 9.3 deg2 field in US and follow-up observations. In continuation of this work, Lodieu et al. (2007) used UKIDSS Galactic Cluster Survey data of a 6.5 deg2 region in US and identified 129 members by photometric and proper motion criteria. The estimated masses of these objects are in the range between and and they conclude that the sample contains a dozen new brown dwarf candidates below 15 Jupiter masses.
3.3. Multi-Object Spectroscopic Surveys for Low-Mass Members
During the last couple of years, extensive spectroscopic surveys for low-mass members of US were performed with wide-field multi-object spectrographs at the Anglo-Australian Observatory. The first step was a survey with the wide-field multi-object spectrograph FLAIR at the 1.2 m United Kingdom Schmidt Telescope to reveal PMS stars among ROSAT All Sky Survey X-ray sources in a 160 deg2 area (Preibisch et al. 1998). In this spatially complete, but flux-limited survey covering nearly the full area of the association, 39 new PMS stars were found. Preibisch & Zinnecker (1999) investigated the star formation history in US. In a detailed analysis of the HR diagram, properly taking into account the uncertainties and the effects of unresolved binaries, they found that the low-mass PMS stars have a mean age of about 5 Myr and show no evidence for a large age dispersion. The PMS sample of Preibisch & Zinnecker (1999) (see Table LABEL:PZ99tab) is statistically complete for stars in the mass range M⊙ to M⊙.
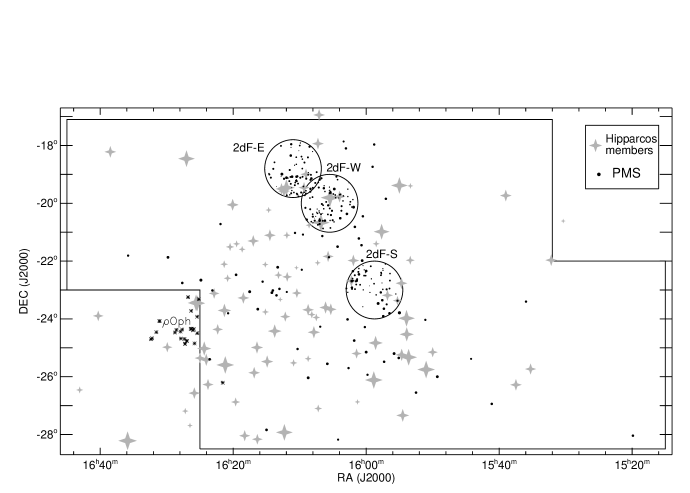
The next step was to reveal the full population of low- and very-low mass M⊙) stars in a representative area of US, in order to allow a direct determination of the full IMF of this OB association. The multi-object spectrograph 2dF at the 3.9 m Anglo-Australian-Telescope was used to obtain intermediate resolution spectra of more than 1000 stars with magnitudes in a 9 deg2 area. Among these, 166 new PMS stars were found, nearly all of them M-type stars, by their strong Li absorption lines. The results of these observations were reported in Preibisch et al. (2001) and Preibisch et al. (2002), and the newly revealed low-mass members are listed in Table LABEL:2dfpmstab. Combining these results with the earlier investigation yielded a sample of 250 PMS stars in the mass range M⊙ to M⊙. A map of the survey region showing the locations of the low-mass PMS stars as well as the high-mass Hipparcos members is shown in Fig. 3. One can see that the low-mass members are spatially coincident with the early type members of the US association.
3.4. The HR-Diagram for Upper Scorpius
Preibisch et al. (2002) studied the properties of the full stellar population in US on the basis of a large sample of 364 association members. This sample was composed of the following parts:
(1) the 114 Hipparcos members constitute a complete sample of all members with masses above and an (incomplete) sample of lower-mass members with masses down to M⊙, covering the full spatial extent of the association.
(2) the 84 X-ray selected PMS stars from Preibisch & Zinnecker (1999) provide a statistically complete sample of the M⊙ members (plus some lower mass stars) in a 160 deg2 area.
(3) the 166 low-mass PMS stars identified with 2dF (Preibisch et al. 2001, 2002) constitute a statistically complete, unbiased sample of the member population in the M⊙ mass range, which covers a 9 deg2 area.
Figure 4 shows the HR-diagram with all these US members.
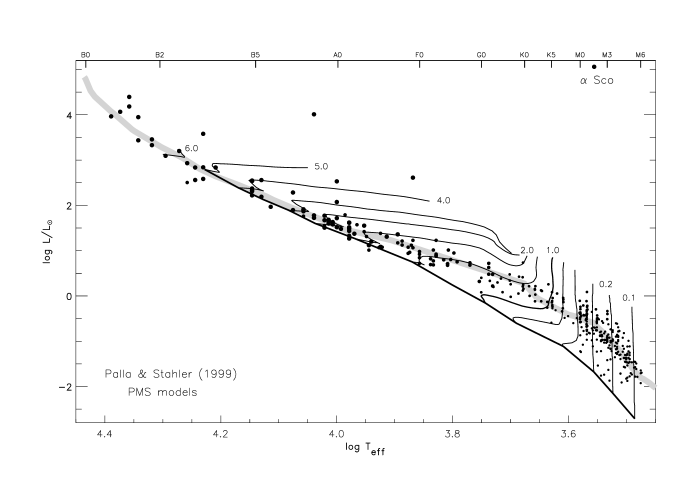
3.5. Ages of the Upper Scorpius Stars
From Fig. 4 one can see that not only the majority of the low-mass stars, but also most of the intermediate- and high-mass stars lie close to or on the 5 Myr isochrone. There clearly is a considerable scatter around this isochrone that may seem to suggest a considerable spread of stellar ages. However, it is very important to be aware of the fact that the masses and especially the ages of the individual stars read off from their position in the HR-diagram are generally not identical to their true masses and ages. For the case of US, the most important factor is the relatively large spread of individual stellar distances ( pc around the mean value of 145 pc; de Bruijne 1999, and priv. comm.) in this very nearby and extended region, which causes the luminosities to be either over- or under-estimated. Another important factor is the presence of unresolved binary companions, which cause over-estimates of the luminosity. Further factors include photometric errors and variability, and the uncertainties in the calibrations used to derive bolometric luminosities and effective temperatures. Detailed discussions and simulations of these effects can be found in Preibisch & Zinnecker (1999) and Hillenbrand et al. (2008). The net effect of the uncertainties is that in the observed HR diagram a (hypothetical) perfectly coeval population of stars will not populate just a single line (i.e. the corresponding isochrone), but will always display a finite spread, mimicking an age spread. Preibisch & Zinnecker (1999) and Preibisch et al. (2002) found via statistical modeling of these effects that the observed HR-diagram for the low-mass stars in US is consistent with the assumption of a common stellar age of about 5 Myr; there is no evidence for an age dispersion, although small age spreads of Myr cannot be excluded by the data. Preibisch et al. (2002) showed that the derived age is also robust when taking into account the uncertainties of the theoretical PMS models. The mean age of 5 Myr and the absence of a significant age spread among the US stars has been confirmed in the independent studies of Allen et al. (2003) and Slesnick (2007).
It is remarkable that the age derived for the low-mass stars is very well consistent with previous independent age determinations based on the nuclear and kinematic ages of the massive stars (de Geus, de Zeeuw, & Lub 1989), which also yielded 5 Myr. This very good agreement of the independent age determinations for the high-mass and the low-mass stellar population shows that low- and high-mass stars are coeval and thus have formed together. Furthermore, the absence of a significant age dispersion implies that all stars in the association have formed more or less simultaneously. This means that the star-formation process must have started rather suddenly and everywhere at the same time in the association, and also must have ended rather suddenly after at most a few Myr. The star formation process in US can thus be considered as a burst of star formation. This will be discussed in more detail in Sect. 6.1.
3.6. The Full Initial Mass Function of Upper Scorpius

Upper Scorpius is an ideal target for an investigation of the initial mass function (IMF) for several reasons. First, the star formation process is completed and thus stars of all masses are already present; since the molecular cloud has already been dispersed, the members are also rather easily observable. Second, the age of Myr is young enough that nearly all members are still present; only very few of the most massive members have already evolved away from the main-sequence, and these stars can be accounted for individually. Therefore, the present day mass function (with the addition of the one member that already exploded as a supernova) is identical to the initial mass function.
Figure 5 shows the empirical mass function for US as derived in Preibisch et al. (2002). The best-fit multi-part power law function for the probability density distribution is given by
| (1) |
or, in shorter notation, , , . The derived US mass function is compared to two different representations of the field IMF. The first one is the field IMF representation suggested by Scalo (1998), given by , , , the second is the parameterization for the average Galactic field star IMF in the solar neighborhood derived by Kroupa et al. (2002), which is given by , , . Although the observed US mass function is not identical to either the Scalo (1998) or Kroupa et al. (2002) field IMF representations, it is well within the ranges of slopes derived for similar mass ranges in other young clusters or associations, as compiled in Kroupa et al. (2002). Therefore, it can be concluded that, within the uncertainties, the general shape of the US mass function is consistent with recent field star and cluster IMF determinations.
The total stellar population of US in the M⊙ to M⊙ mass range can be described by the ‘best fit’ mass function (eqn. 1). The integration of this function yields 2525 stars with a total mass of M⊙. 75% of all stars have masses below M⊙ and contribute 39% of the total mass. Only 3% of all stars have masses above M⊙, but they contribute 33% of the total mass. All these numbers are based on the primary star mass function. For a reasonable estimate of the total stellar mass one has to take into account that most of the stars are probably in multiple systems. The binary frequency (i.e. the probability that a given object is multiple; cf. Reipurth & Zinnecker 1993) for late type stars is at least about 50% (c.f. Duquennoy & Mayor 1991; Fischer & Marcy 1992, see Köhler et al. 2000 for the case of US) and even higher for early type stars (Mason, Gies, & Hartkopf 1998; Abt et al. 1990; Preibisch et al. 1999). The total mass of the companions in the multiple systems can be estimated as follows: assuming a binary frequency of 100% and random pairing of secondaries from the same underlying mass function (eqn.1) as the primaries, the total mass of all companions in the M⊙ mass range is 40% of the total mass of all primaries. For the estimate of the total stellar mass one also has to include the most massive stars, that have already evolved away from the main-sequence: Antares () and its B2.5 companion (), the supernova progenitor (), and Oph (). The total stellar mass is then: .
4. Upper Centaurus-Lupus (UCL)
While US has been the focus of many investigations over the past century, its older siblings – the UCL and LCC regions – have received much less attention. There appear to be several biases which made these two groups more difficult to study, or perhaps more easy to ignore, at least historically. These are: (1) UCL and LCC are not as concentrated as US, (2) a significant fraction of their memberships are within 10∘–15∘ of the Galactic plane, making separating their membership from the Galactic population more difficult, (3) most of UCL and LCC are inaccessible to telescopes in the northern hemisphere, (4) and early investigations of PMS stars centered on dark and reflection nebulae, which are in abundance in and near US, but more lacking or absent in UCL and LCC. Only over the past decade has the availability of high quality astrometry (Hipparcos, Tycho, etc.) and the ROSAT All-Sky Survey, enabled the efficient identification of low-mass UCL and LCC members. Given the numbers of B-type stars in UCL and LCC, there are probably thousands of low-mass members awaiting discovery.
4.1. The High-Mass Stellar Population of UCL
There appear to be no post-MS members of UCL, however there is a fairly well-defined main sequence turn-off near spectral type B1.5 (de Geus, de Zeeuw, & Lub 1989; Mamajek et al. 2002). The notable turn-off stars are, in approximate order of mass: Sco (B1.5IV), Lup (B1.5III), Lup (B2III), Lup (B1.5IV), Cen (B2IV), Sco (B2IV), and Lup (B1.5V; where MK spectral types are from Hiltner et al. 1969). The positions of these massive stars are plotted and labeled in the UCL map in Fig. 6. All of these stars were selected as Hipparcos members of UCL by de Zeeuw et al. (1999) except for Sco and Lup. Hoogerwerf (2000) has noted that the longer baseline ACT and TRC proper motions for these stars are more conducive to UCL membership. The Tycho-2 proper motion for Lup is well-pointed toward the UCL convergent point defined by de Bruijne (1999), however its magnitude is somewhat larger than most other UCL members.
Using the Bertelli et al. (1994) evolutionary tracks, Mamajek et al. (2002) estimated the main sequence turn-off age of UCL to be 17 Myr. It was de Geus (1992) who first calculated the number of supernovae to have exploded in UCL (6 3), and showed that the sum of the total kinetic energy predicted to be imparted by the supernovae and stellar winds of the deceased UCL members (1051 erg) is roughly consistent with the kinetic energy of the 100 pc-radius expanding shell of H I centered on UCL. This satisfactory agreement supports the original scenario by Weaver (1979), that the massive stars in the oldest Sco-Cen subgroups (UCL and LCC) destroyed the proto-Sco-Cen molecular cloud complex, and radially dispersed most of the gas into what is seen today as large, expanding, loop-like H I structures centered on Sco-Cen. A modern estimate by the authors of the number of exploded supernovae in UCL (7 SNe), using the de Zeeuw et al. (1999) membership list for UCL, and adopting a Kroupa et al. (2002) initial mass function, corroborates de Geus’s (1992) prediction.
UCL contains a Herbig Ae star (HD 139614) and two accreting Fe stars (AK Sco and HD 135344). Both HD 139614 and HD 135344 are close to the western edge of the Lupus clouds near 332∘ (see Fig. 8 of the Lupus chapter; Comerón, this volume), and so may be younger than the mean age for UCL.
4.2. The Low-Mass Stellar Population of UCL
The Pre-ROSAT Era:
A small number of PMS members of UCL were found before the arrival of the ROSAT X-ray surveys. In the course of a radial velocity survey of B-type members of Sco-Cen, Thackeray (1966) found that many of their visual companions shared similar radial velocities, i.e. they probably constituted physical binaries. Some of these objects were of AFGK spectral types, and include HD 113703B (K0Ve; LCC), HD 113791B (F5V; LCC), HD 143099 (G0V; UCL), and HD 151868 (F6V; UCL). The high-mass primaries are still considered secure members of US, UCL, and LCC (de Zeeuw et al. 1999). Thackeray (1966) proclaimed “[t]hese observations do in fact represent the first to establish the presence of stars later than type A0 in the group. They include one K-dwarf which is presumably no older than the group to which Blaauw (1964) assigns an age of 20 million years”. Catchpole (1971) noted strong Li in the spectrum of HD 113703B, confirming its extreme youth. The first two stars, along with HD 129791B (K5Ve; UCL) and HD 143939B (K3Ve; UCL), are included in the well-studied “Lindroos” sample of post-T Tauri companions to massive stars (e.g. Lindroos 1986; Huélamo et al. 2000).
In an effort to tie the absolute magnitude calibration of B-type stars to that of later type stars, as well as explore the luminosity function of Sco-Cen, Glaspey (1972) identified 27 candidate A- and F-type stars in a survey of UCL. Of these 27 candidates, 24 have Hipparcos astrometry, and de Zeeuw et al. (1999) retained 14 of these as kinematic members of UCL.
The ROSAT Era: The Lupus Region Surveys:
Most of the low-mass members of UCL which have been identified over the past decade have been due to ROSAT X-ray pointed observations and its all-sky survey. The focus of most of these surveys was not UCL, but the Lupus molecular cloud complex. In a wide-field survey of X-ray-luminous stars in a 230 deg2 region around the Lupus clouds, Krautter et al. (1997) identified 136 candidate T Tauri stars. While 47 of these new T Tauri stars (TTS) were found in pointed ROSAT observations of the Lupus clouds, the majority (89) were found scattered over a wider region with the ROSAT All-Sky Survey (RASS). Wichmann et al. (1997a) found that if the “off-cloud” T Tauri stars were co-distant with the Lupus clouds, then their mean isochronal age was significantly older than the “on-cloud” Lupus T Tauri stars (7 Myr vs. 1-3 Myr, respectively). Wichmann et al. (1997a) hypothesized that the off-cloud TTS formed in the Lupus clouds, but were dispersed either due to a large intrinsic velocity dispersion in the clouds, or due to ejection (Sterzik & Durisen 1995).
Wichmann et al. (1997b) also conducted a spectroscopic survey of RASS sources west of the Lupus clouds in a strip between 325∘ 335∘ and (dotted line in Fig. 6). They identified 48 Li-rich stars, most of which were concentrated between Galactic latitudes +8∘ and +22∘. Wichmann et al. (1997b) hypothesized that the majority of these objects were “Gould Belt” members, with ages of 60 Myr.
The idea that there are older, dispersed RASS TTSs near the Lupus clouds becomes somewhat less surprising when it is appreciated that the Lupus clouds are adjacent to the US and UCL subgroups of Sco-Cen (with ages of 5 and 17 Myr, respectively, and thousands of predicted members). Sco-Cen and UCL are not mentioned in the Krautter et al. (1997), Wichmann et al. (1997a), or Wichmann et al. (1997b) surveys, although in this region of sky the “Gould Belt” is essentially defined by the high-mass stars of UCL (e.g. Lesh 1972) and the gas associated with the Lupus clouds. Two of the clumps of TTSs seen by Wichmann et al. (1997b) seem to be co-spatial with the over-densities of high-mass UCL members, associated with Lup and Lup. A more detailed kinematic study of the Krautter-Wichmann TTSs is needed to disentangle the star-formation of the region, explore the relation between the modern-day Lupus clouds and the “completed” star-formation in UCL.
Recently, Makarov (2007) investigated the kinematics of the Krautter et al. (1997) TTS in the Lupus region. After correcting for the distribution of individual stellar distances, the color-magnitude diagram revealed two separate stellar populations with clearly different ages: a young ( Myr) population of TTS which are closely concentrated at the Lupus dark clouds, and an older ( Myr) population of stars which are much more widely dispersed in the area. Based on kinematic arguments, Makarov concludes that “it is unlikely that the T Tauri members were born in the same star-forming cores as the more compactly located classical T Tauri stars.” We agree with this assessment, but add that the positions, motions, and mean age of the outlying members are very well consistent with the idea that the Krautter et al. (1997) stars are in fact low-mass members of the US and UCL subgroups of Sco-Cen. Rather than subsume all of the RASS stars into a “Lupus Association” as Makarov (2007) elects, it is probably wise for astrophysical studies to separate the on- or near-cloud Lupus members from the off-cloud UCL/US members. We have visually attempted to do this with a dashed line box in Fig. 6, but clearly more study is warranted.
There is good kinematic evidence that the Wichmann et al. (1997b) RASS stars are mostly UCL members. A preliminary kinematic analysis by E.M. suggests that for the 33 Wichmann et al. (1997b) ROSAT stars with either Tycho-2 (Høg et al. 2000) or UCAC2 (Zacharias et al. 2004) proper motions, all but four have motions consistent with UCL membership. The ROSAT X-ray stars RX J1412.2-1630, J1419.3-2322, J1509.3-4420, and J1550.1-4746 can all be rejected as kinematic UCL members. The first two objects are also well outside of the UCL region defined by de Zeeuw et al. (1999), so their rejection is perhaps unsurprising. The inferred cluster parallax distances for the rest555Cluster parallax distances were calculated using either the UCAC2 or Tycho-2 proper motions, and the UCL space motion vector from de Bruijne (1999). See Mamajek et al. (2002) for details on the technique. range from 90 pc to 200 pc, suggesting considerable depth to the UCL subgroup. Of note for future Li depletion studies of UCL members, we find that the M-type Wichmann et al. stars RX J1512.8-4508B (M1), RX J1505.4-3716 (M0), and RX J1457.3-3613 all have proper motions consistent with membership in UCL. The components of the wide M-type binary RX J1511.6-3249A and B (M1.5+M1.5; separation) also have proper motions consistent with UCL membership.
The ROSAT Era: The Mamajek et al. Survey:
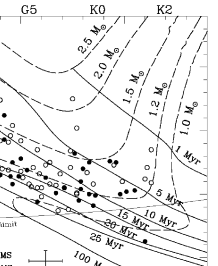
Mamajek et al. (2002) conducted the first wide-field, spectroscopic survey searching explicitly for PMS GK-type members of UCL. They selected 56 UCL candidates by cross-referencing proper motion-selected stars from the kinematic study of Hoogerwerf (2000, but with color-magnitude constraints more amenable to identifying PMS G- and K-type members from the ACT and TRC astrometric catalogs) with X-ray sources from the ROSAT All-Sky Survey Bright Star Catalog (Voges et al. 1999). They also measured optical spectra of 18 GK-type Hipparcos stars selected as probable kinematic members by de Zeeuw et al. (1999). Blue and red optical spectra of the candidates were taken with the DBS spectrograph on the Siding Springs 2.3-m telescope, with resolution of 2.8 Å in the blue, and 1.3 Å in the red. Stars were classified as PMS by virtue of having strong Li (stronger than the loci of 30–100 Myr-old clusters) and subgiant luminosity classes (measured via the Sr II 4077 line). Between UCL and LCC, the X-ray and proper motion selection was 93% efficient at selecting PMS stars, while 73% of the kinematic candidates selected by de Zeeuw et al. (1999) were PMS (well in line with the 30% contamination rate predicted by those investigators). Mamajek et al. (2002) confirmed 12 out of 18 of the de Zeeuw et al. (1999) proper motion-selected UCL candidates as PMS, and found 50 Li-rich UCL members from the X-ray and proper motion-selected sample. None of the UCL PMS stars identified could be considered classical T Tauri candidates (i.e. accreting), however a few demonstrated small H emission excesses (all 2 Å), probably due to enhanced chromospheric activity. Although Mamajek et al. (2002) found no new classical T Tauri UCL members, there are two known F-type accretors (AK Sco and HD 135344; e.g. Alencar et al. 2003). The mean age of the PMS UCL members in the Mamajek et al. (2002) survey depends, unsurprisingly, on one’s choice of evolutionary tracks, but ranged from 15–22 Myr (see Fig. 7). Using the evolutionary tracks of Baraffe et al. (1998, where appropriate), and accounting for the magnitude limit of the Mamajek et al. (2002) survey (see Sect. 7.1 of their paper), one finds a median age for the UCL PMS stars of 16 Myr.
While Mamajek et al.’s survey of UCL was very broad, admittedly it was not very deep, and more members could be easily identified with existing catalog data (e.g. RASS Faint Source Catalog, UCAC2, SACY, etc.). Mamajek et al. (2002) claim that the majority (80%) of the 1.1–1.4 M⊙ members have probably been identified, but that 2000 1 M⊙ members likely await discovery. The lowest-mass UCL candidates which have been found (and which are not in the immediate vicinity of the Lupus star-forming clouds) are the Krautter et al. (1997) Li-rich early-M-type stars RX J1514.0-4629A (LR Lup; M2) and RX J1523.5-3821 (MN Lup; M2). The equivalent widths of the Li I 6707.7 line for these M2 stars (0.38Å), as measured in low-resolution spectra by Wichmann et al. (1997a), suggests that modest Li depletion is taking place among the early-M stars in UCL. A high resolution spectroscopic survey of Li-rich M-type members could place independent constraints on the age of UCL, as well as allow an interesting comparison between Li depletion ages and main sequence turn-off ages.
A List of Low-Mass UCL Members:
We have assembled a membership list of candidate low-mass members of UCL from the previously mentioned literature (Table LABEL:table_ucl_list). The list is meant to be rather exclusive in that it selects only those low-mass (GKM) stars that are Li-rich and have kinematics consistent with group membership. All are known X-ray sources, except for a small number of proper motion candidates from de Zeeuw et al. (1999) which were confirmed to be Li-rich by Mamajek et al. (2002). The F stars in UCL have not been thoroughly investigated spectroscopically. Given the very high efficiency of selecting PMS stars amongst X-ray and proper motion selected GK stars Mamajek et al. (2002, 93%), we list only the proper motion-selected F-type candidate members from the literature which have ROSAT All-Sky Survey X-ray counterparts within 40” of their optical positions. The sample is not meant to be complete, by any means, but should represent a relatively clean sample of 2 M⊙ UCL members. The incidence of non-members is probably well below 5%. Two confirmed PMS companions to high mass UCL members (HD 129791B and HD 143939B) were included, using data from Huélamo et al. (2000), Pallavicini et al. (1992), Lindroos (1983), and distances (for the primaries) from Madsen et al. (2002). Although the majority of Krautter et al. (1997) and Wichmann et al. (1997b) stars appear to be bona fide UCL members (by virtues of their positions, proper motions, appropriate HR-D positions, etc.), we have not included them in our membership list, but refer the reader to those papers.
In Table LABEL:table_ucl_list we have flagged the UCL members which are near the Lupus molecular clouds. We have defined a box around the Lupus clouds that are actively forming stars: 335.5∘ 341∘ and +7∘ +18∘. The population of stars in the off-cloud region in that box may represent a mix of stars that have recently formed in the Lupus clouds, along with older UCL PMS stars. The HRD positions of the flagged UCL stars in Table LABEL:table_ucl_list are consistent with having ages of 7–23 Myr, so they are probably UCL members projected against (or behind?) the Lupus clouds.
5. Lower Centaurus-Crux (LCC)
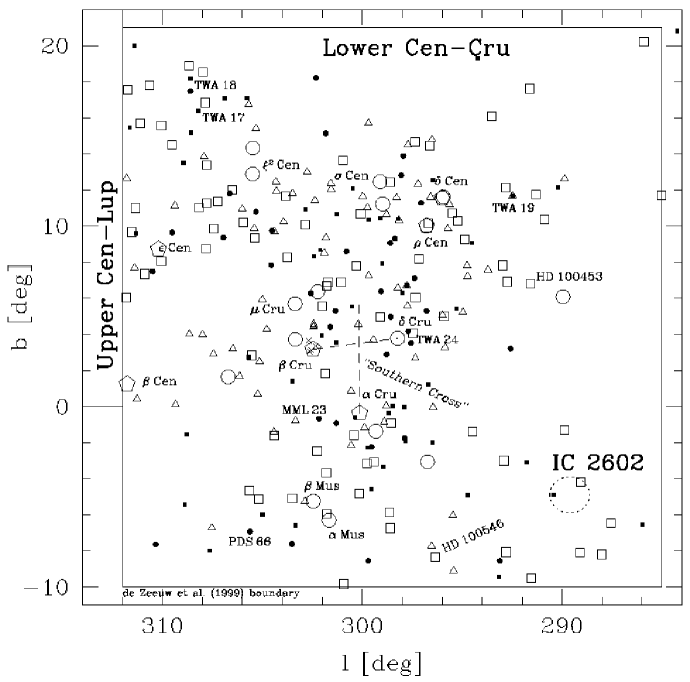
LCC straddles the Galactic equator in Crux, stretching from Galactic latitude to between Centaurus, Crux, and Musca (see Fig. 8). Although LCC is the closest recognized OB association subgroup to the Sun ( pc), it is the least studied of the Sco-Cen regions. There is some hint of substructure in the group, and it appears that the northern part of the group is somewhat more distant, older, and richer (17 Myr, 120 pc) than the southern part of the group (12 Myr, 110 pc).
5.1. The High-Mass Stellar Population of LCC
The upper main sequence of LCC is poorly defined, and so the group has the least secure turn-off age of the Sco-Cen subgroups. In approximate order of mass, the LCC turnoff stars with fairly secure kinematic membership (de Zeeuw et al. 1999) are: Cru (B2IV), Cen (B2V), Mus (B2IV-V), Cru (B2IV-V), and Cen (B1.5V; MK types from Hiltner et al. 1969). There are other massive stars in this region, whose membership in LCC has been debated, but whose Hipparcos proper motions were inconsistent with membership (de Zeeuw et al. 1999). Among these systems are the “super Cen-Crux six”: Cru (B0.5IV+B1V+B4IV), Cru (B0.5III), Cen (B1III), Cen (B2IVne), Cen (B1III), and Cen (B3V; Hiltner et al. 1969). As noted by Mamajek et al. (2002) for the most massive subset of these, “These stars are 10–20 M⊙, with inferred ages of 5–15 Myr and distances of 100–150 pc. Such stars are extremely rare, and their presence in the LCC region appears to be more than coincidental.” As noted by de Zeeuw et al. (1999), all of these objects are flagged as having unusual motions due to either binarity or variability in the Hipparcos catalog, however they only consider Cen, Cru, and Cen to be probable LCC members whose Hipparcos proper motions excluded them from kinematic selection. In a follow-up paper, Hoogerwerf (2000) demonstrated that the long-baseline proper motions for Cen (ACT catalog) and Cru (TRC catalog) are more consistent with LCC membership, however they did not address the remainder of the “six”. A more thorough kinematic investigation of the center-of-mass motions of these systems is needed. Although the Sco-Cen subgroup memberships seem to have a 1–1.5 km s-1 internal velocity dispersion (de Bruijne 1999), if significant dynamical evolution has taken place among the massive multiple systems over the past 10–15 Myr (i.e. due to supernovae, or ejections from short-lived trapezia), then the resultant kicks could explain the presence of these massive multiple systems with deviant motions in the vicinity of the Sco-Cen subgroups. The results from a kinematic study of these “super six”, as well as the runaway star and pulsar candidates in the vicinity (e.g. Hoogerwerf et al. 2001) could have important implications for the IMF and star-formation history of LCC.
LCC contains two known Herbig Ae/Be stars: HD 100453 (A9Ve) and HD 100546 (B9Ve). Although sometimes labeled “isolated” HAEBE stars, their positions, proper motions, and distances ( pc) are all consistent with LCC membership. van den Ancker et al. (1998) estimated an age of 10 Myr for HD 100546, consistent with other LCC members. Circumstellar PAH emission was recently resolved around both stars using VLT (Habart et al. 2006), while the disk for HD 100546 was resolved in the thermal IR at Magellan with MIRAC (Liu et al. 2003). Chen et al. (2006) recently identified a faint candidate companion to HD 100453 at separation consistent with being an M-type PMS star, however it has not been spectroscopically confirmed. HD 100546 has a gap in its disk consistent with the presence of a substellar object at AU (Acke & van den Ancker 2006).
5.2. The Low-Mass Stellar Population of LCC
The low-mass population of LCC has been investigated even less than that of UCL. Low-mass members were identified serendipitously through surveys of the regions near Cru (Park & Finley 1996) and the TW Hya association (Zuckerman et al. 2001), which is near the northwest corner of the LCC box defined by de Zeeuw et al. (1999), but at roughly half the distance (50 pc; Mamajek 2005) as LCC (118 pc). Mamajek et al. (2002) conducted the only systematic survey, thus far, whose goal was to identify low-mass members over the whole LCC region.
The Park-Finley ROSAT Stars near Cru:
Park & Finley (1996) identified 6 unknown, variable X-ray sources near the B0.5III star Cru in a ROSAT PSPC pointing. By virtue of their X-ray spectral fits, variability, and X-ray to optical flux ratios, Park & Finley (1996) conjectured that the 6 objects were T Tauri stars666The stars are indexed 1 through 6 with the acronym [PF96] (SIMBAD) or Cru (Feigelson & Lawson 1997; Alcalá et al. 2002). We adopt the SIMBAD nomenclature., and that they had discovered a previously unknown star-forming region centered on Cru. A low-resolution spectroscopic survey by Feigelson & Lawson (1997) found that the X-ray stars were Li-rich, late-type stars, consistent with classification as weak-lined T Tauri stars. After rejecting several hypotheses regarding the origins of these young stars, Feigelson & Lawson (1997) argued that Park & Finley serendipitously uncovered the first known “isolated” low-mass members of LCC. Alcalá et al. (2002) conducted a high-resolution spectroscopic study of the Park-Finley stars, and confirmed that 4 of the 6 are sufficiently Li-rich to be classified as PMS. Alcalá et al. (2002) also find that the radial velocities and isochronal ages (5–10 Myr)777The distances to the PF96 stars are unknown. We follow Alcalá et al. (2002), and assume = 110 pc (the distance to Cru). The reason for the discrepancy in ages between the Park-Finley sample and the Mamajek et al. sample is unknown, but could be due to the unknown distances to the Park-Finley stars. for the 4 most Li-rich stars are roughly consistent with LCC membership. The 4 PMS stars are K5-M4 in spectral type, and have Li abundances intermediate between those of T Tauri stars and the 50-Myr-old IC 2602 cluster. The discovery of more M-type Sco-Cen members may prove to be an interesting means of testing PMS evolutionary tracks and Li depletion models.
TWA ROSAT Stars in LCC:
In their attempt to identify new members of the nearby TW Hya association (TWA; age 10 Myr; 50 pc), Zuckerman et al. (2001) conducted a spectroscopic survey of RASS BSC X-ray sources in the vicinity of the famous debris disk star HR 4796. They identified eight new T Tauri stars, however they were different from the rest of the TWA members thus far found: their optical, infrared, and X-ray fluxes were significantly dimmer. Zuckerman et al. (2001) claimed that the new TWA stars (#14-19) were further away from the original TWA #1-13 sample, with distances of perhaps 70-100 pc. As pointed out in Mamajek & Feigelson (2001), the positions of TWA 14-19 overlap with the LCC region defined by de Zeeuw et al. (1999). Lawson & Crause (2005) have presented evidence that the distribution of rotational periods of TWA 1-13 and 14-19 are very different, suggesting two different populations. In a detailed kinematic investigation of ‘TWA” stars in the literature, Mamajek (2005) concluded that the TWA stars are dominated by two populations: a group of two dozen stars with distances of 49 12 pc (what probably constitutes the true “TW Hya association”), and a subset of objects with distances of 100–150 pc, which are likely LCC members (partially corroborating the Lawson & Crause findings). Mamajek (2005) claims that TWA 12, 17, 18, 19, and 24 are very likely LCC members, with TWA 14 a borderline case. TWA 19 (= HIP 57524) was identified as an LCC member by de Zeeuw et al. (1999), as was TWA 24 (= MML 5) by Mamajek et al. (2002).
The Mamajek et al. ROSAT Survey:
As discussed at length in Sect. 4.2, Mamajek et al. (2002) conducted a search for 1 M⊙ members of UCL and LCC amongst an X-ray and proper motion-selected sample. They identified 37 LCC members, and confirmed the youth of 10 (out of 12) of the de Zeeuw et al. (1999) Hipparcos G-type candidates they observed. Mamajek et al. (2002) claimed that the classical T Tauri star PDS 66 (Gregorio-Hetem et al. 1992) is actually a LCC member, and appears to be the only known accreting low-mass star in LCC. The mean age of the PMS LCC members in the Mamajek et al. (2002) survey ranged from 17 to 23 Myr, depending on the choice of evolutionary tracks. Using the evolutionary tracks of Baraffe et al. (1998, where appropriate), and accounting for the magnitude limit of the Mamajek et al. survey, one finds a median age for the LCC PMS stars of 18 Myr.
Torres et al. “SACY” ROSAT Survey:
Torres et al. (2006) presented results for a high resolution spectroscopic survey of 1151 stars in the southern hemisphere with ROSAT All-Sky Survey X-ray counterparts. Results for the “SACY” (Search for Associations Containing Young Stars) survey regarding nearby young low-density stellar groups are reported elsewhere in this volume (Torres et al.). There are numerous Li-rich late-type SACY stars in the Sco-Cen region, and most have proper motions and radial velocities suggestive of membership to the Sco-Cen groups. For this review, we have only attempted to assign membership of SACY stars to the Lower Centaurus-Crux group, although the SACY catalog no doubt contains many new UCL and US members as well. The selection of LCC members from the SACY catalog will be discussed in more detail by Mamajek (in prep.).
To construct a sample of LCC members in the SACY catalog, we start with the 138 SACY stars that lie within the de Zeeuw et al. (1999) boundary for LCC. Of these objects, 45 are previously known LCC members found either by de Zeeuw et al. (1999) or Mamajek et al. (2002). We further prune the SACY sample by removing giants, and selecting only those that are Li-rich (EW(Li 6707Å) 100mÅ) and that have proper motions within 25 mas yr-1 of the de Bruijne (1999) mean value for LCC. Lastly we run a convergent point algorithm from Mamajek (2005) on the full sample of de Zeeuw et al. (1999) and Mamajek et al. (2002) members along with the remaining 49 SACY objects. Following de Bruijne (1999), we assume an internal velocity dispersion of 1.14 km s-1, and calculate cluster parallax distances using the velocity vector of de Bruijne (1999). In total we identify 45 SACY stars as probable new members of LCC. The median RV for the SACY stars selected as LCC members is km s-1, which is nearly identical to the subgroup mean RV from de Zeeuw et al. (1999) ( km s-1).
A List of Low-Mass LCC Members:
Table LABEL:table_lcc_list provides a modern catalog of low-mass LCC members, and was constructed in a similar manner as that for UCL (Sect. 4.2.). The positions of known LCC members are plotted in Fig. 8. Individual cluster parallax distances were adopted from Mamajek et al. (2002) or Madsen et al. (2002). Where no published cluster parallax distance was available, we calculate new values using the de Bruijne (1999) motion vector for LCC, while using the proper motions for the TWA objects listed in Mamajek (2005) and from the SACY catalog (Torres et al. 2006).
6. Sco-Cen as an Astrophysics Laboratory
6.1. Implications on the Star Formation Process in Upper Scorpius
The US group has been particularly well-studied, and can give us some quantitative insight into the star formation history as well as constraints on the mechanism responsible for triggering the star formation. As described in detail in Sect. 3.5., the populations of the high-mass as well the low-mass stars both have a common age of 5 Myr. There is no evidence for a significant age spread, and the data are consistent with the idea that all stars have formed within a period of no more than Myr.
Another important aspect is the initial configuration of the region at the time when the stars formed. Today, the bulk (70%) of the Hipparcos members (and thus also the low-mass stars) lie within an area of 11 degrees diameter on the sky, which implies a characteristic size of the association of 28 pc. de Bruijne (1999) showed that the internal 1D velocity dispersion of the Hipparcos members of US is only 1.3 km/s. In combination with the well determined age of US and the present-day size, this strikingly small velocity dispersion clearly shows that US cannot have originated in a compact cluster configuration that expanded later, but must have been in a spatially extended configuration from the beginning. US seems to have formed in an extended, unbound giant molecular cloud, similar to the models considered by Clark et al. (2005).
The initial size of the association can be estimated by assuming that the stars expanded freely from their initial positions. With a Gaussian velocity distribution characterized by the measured velocity dispersion, a single point in space would have expanded to a size of about 13 pc in 5 Myr. Subtracting this number from the current characteristic size of 28 pc in quadrature leads to an initial size of 25 pc.
This implies an lateral stellar crossing time of 25 pc / 1.3 km/s 20 Myr in the initial configuration. This large crossing time is in remarkable contrast to the upper limit on any possible age spread among the association members of only Myr. The fact that the lateral stellar crossing time is much (about an order of magnitude) larger than the age spread of the association members clearly suggests that some external agent must have coordinated the onset of the star formation process over the full spatial extent of the association. In order to account for the small spread of stellar ages, the triggering agent must have crossed the initial cloud with a velocity of at least km/s. Also, some mechanism must have terminated the star formation process about 1 Myr after it started. Finally, we note that the US region does no longer contain significant amounts of molecular cloud material. The original molecular cloud, in which the stars formed, has been nearly completely dispersed. Today, most of this material appears to be situated in an expanding, (mostly) atomic H I superbubble centered on US. de Geus (1992) estimated the mass of this superbubble to be . Comparing this to the estimated total mass of all stars in US (; see Sect. 3.6.) suggests that only a small fraction of the initial cloud mass was transformed into stars.
These findings can be understood as consequences of the feedback from massive stars. High-mass stars, above about ten solar masses, profoundly affect their environment in several ways. Their strong ionizing radiation can photoevaporate molecular cloud clumps (e.g. see Hester et al. 1996 and McCaughrean & Andersen 2002 for the case of M16) and circumstellar matter around young stellar objects (see Bally et al. 1998; Richling & Yorke 1998, 2000). Their powerful stellar winds deposit considerable amounts of momentum and kinetic energy into the surrounding medium. Finally, supernova explosions cause strong shock waves that transfer typically some erg of kinetic energy into the ambient interstellar medium. The supernova blast wave will initially expand within the wind-blown bubble formed by the supernova progenitor; as it catches up with the bubble shock front, it will accelerate the expansion of the bubble (see e.g. Oey & Massey 1995), further disrupt the parental molecular cloud (see e.g. Yorke et al. 1989) and sweep up a massive shell of dust and gas.
In general, massive stars have a very destructive effect on their nearby environment; they can disrupt molecular clouds very quickly and therefore prevent further star formation in their surroundings. At somewhat larger distances, however, the wind- and supernova-driven shock waves originating from massive stars can have a constructive rather than destructive effect by driving molecular cloud cores into collapse. Several recent numerical studies (e.g. Boss 1995; Foster & Boss 1996, 1997; Vanhala & Cameron 1998; Fukuda & Hanawa 2000) have found that the outcome of the impact of a shock wave on a cloud core mainly depends on the type of the shock and its velocity: In its initial, adiabatic phase, the shock wave is likely to destroy ambient clouds; the later, isothermal phase, however, is capable of triggering cloud collapse if the velocity is in the right range. Shocks traveling faster than about 50 km/s shred cloud cores to pieces, while shocks with velocities slower than about 15 km/s usually cause only a slight temporary compression of cloud cores. Shock waves with velocities in the range of km/s, however, seem to be well able to induce collapse of molecular cloud cores. A good source of shock waves with velocities in that range are expanding superbubbles driven by the winds and supernova explosions of massive stars at distances888In the immediate vicinity of a supernova, the shock wave is so strong and fast that it will destroy clouds; at larger distances, the supernova shock wave will accelerate the expansion of the (pre-supernova) wind-driven superbubble to velocities in the suitable range. between pc and pc (see Oey & Massey 1995). Observational evidence for star forming events triggered by shock waves from massive stars has, for example, been discussed in Carpenter, Heyer, & Snell (2000), Walborn et al. (1999), Yamaguchi et al. (2001), Efremov & Elmegreen (1998), Oey & Massey (1995), Oey et al. (2005), Reach et al. (2004), Cannon et al. (2005), and Gorjian et al. (2004); see also the discussions in Elmegreen (1998) and Preibisch & Zinnecker (2007).
6.2. A Triggered Star Formation Scenario for Upper Scorpius
For the star burst in US, a very suitable trigger is the shock-wave of the expanding superbubble around the UCL group, which is driven by the winds of the massive stars and several supernova explosions that started to occur about 12 Myr ago. The structure and kinematics of the large H I loops surrounding the Scorpius-Centaurus association suggest that this shock wave passed through the former US molecular cloud just about 5 Myr ago (de Geus 1992). This point in time agrees very well with the ages found for the low-mass stars as well as the high-mass stars in US. Furthermore, since the distance from UCL to US is about 60 pc, this shock wave probably had just about the right velocity ( km/s) that is required to induce star formation according to the modeling results mentioned above. Thus, the assumption that this wind- and supernova-driven shock wave triggered the star formation process in US provides a self-consistent explanation of all observational data.
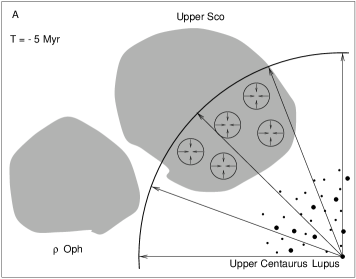
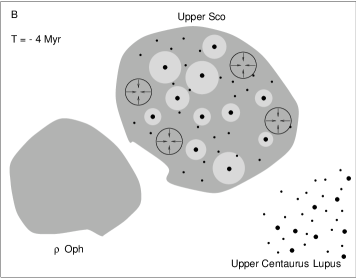
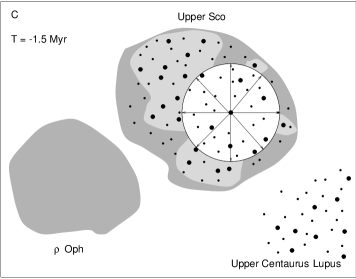
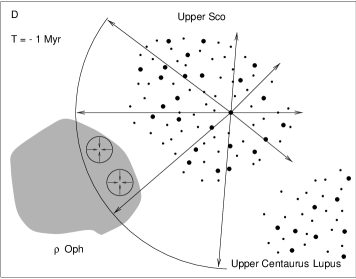
A scenario for the star formation history of US consistent with the observational results described above is shown in Fig. 9. The shock-wave crossing US about 5 Myr ago initiated the formation of some 2500 stars, including 10 massive stars upwards of . When the new-born massive stars ‘turned on’, they immediately started to destroy the cloud from inside by their ionizing radiation and their strong winds. This affected the cloud so strongly that after a period of Myr the star formation process was terminated, probably simply because all the remaining dense cloud material was disrupted. This explains the narrow age distribution and why only about 3% of the original cloud mass was transformed into stars.
About 1.5 Myr ago, the most massive star in US, presumably the progenitor of the pulsar PSR J1932+1059 (see Hoogerwerf et al. 2001; Chatterjee et al. 2004), exploded as a supernova and created a strong shock wave, which fully dispersed the US molecular cloud and removed basically all the remaining diffuse material.
Finally, it is interesting to note that this shock wave must have crossed the Oph molecular cloud within the last 1 Myr (de Geus 1992). The strong star formation activity we witness right now in the L 1688 cloud of the Oph region might therefore be triggered by this shock wave (see Motte, André, & Neri 1998) and would represent the third generation of sequential triggered star formation in the Scorpius-Centaurus-Ophiuchus complex. Furthermore, we note that the Lupus 1 & 2 dark clouds are also located near the edge of the shell around US. These two dark clouds (see chapter by Comerón in this book) contain numerous young stellar objects with estimated ages of Myr; their recent star formation activity may also well have been triggered by the passage of the shock related to the expanding shell around US (see, e.g., Tachihara 2001).
An updated model for triggered cloud and star formation:
While the scenario described above provides a good explanation of the star formation history, a potential problem is its implicit assumption that the US and Oph molecular clouds existed for many Myr without forming stars before the triggering shock waves arrived (otherwise one should see large age spreads in the stellar populations, contrary to the observational evidence). Numerous recent studies (e.g., Elmegreen 2000; Hartmann et al. 2001; Hartmann 2003; Ballesteros-Paredes & Hartmann 2007; Elmegreen 2007) have provided increasing and convincing evidence that the lifetime of molecular clouds is much shorter than previously thought, and the whole process of molecular cloud formation, star formation, and cloud dispersal (by the feedback of the newly formed stars) occurs on timescales of only a few ) Myr. It is now thought that molecular clouds form by the interaction of flows in the interstellar medium that accumulate matter in some regions. As soon as the column density gets high enough for self-shielding against the ambient UV radiation field, the atomic gas transforms into molecular clouds. This new paradigm for the formation and lifetime of molecular clouds seems to invalidate the idea of a shock wave that hit a pre-existing molecular cloud and triggered star formation. Nevertheless, the basic scenario for the sequence of processes in Sco-Cen may still be valid. As pointed out by Hartmann et al. (2001), wind and supernova shock waves from massive stars are an important kind of driver for ISM flows, and are especially well suited to create coherent large-scale flows. Only large-scale flows are able to form large molecular clouds, in which whole OB associations can be born. An updated scenario for Sco-Cen could be as follows: Initially, the winds of the OB stars created a superbubble around UCL. The interaction of this expanding superbubble with flows in the ambient ISM started to sweep up clouds in some places. When supernovae started to explode in UCL (note that there were presumably some 6 supernova explosions in UCL up to today), these added energy and momentum to the wind-blown superbubble and accelerated its expansion. The accelerated shock wave (now with km/sec) crossed a swept-up cloud in the US area, and the increased pressure due to this shock triggered star formation. This scenario does not only explain the temporal sequence of events in a way consistent with the ages of the stars and the kinematic properties of the observed HI shells. The following points provide further evidence: (1) The model (see Fig. 3 in Hartmann et al. 2001) predicts that stellar groups triggered in swept-up clouds should move away from the trigger source. A look at the centroid space motions of the Sco-Cen subgroups (de Bruijne 1999) actually shows that US moves nearly radially away from UCL with a velocity of km/sec. Furthermore, (2) a study by Mamajek & Feigelson (2001) revealed that several young stellar groups, including the Cha cluster, the TW Hydra association, and the young stars associated with the CrA cloud, move away from UCL at velocities of about 10 km/sec; tracing their current motions back in time shows that these groups were located near the edge of UCL 12 Myr ago (when the supernova exploded). (3) The model also predicts that molecular clouds are most efficiently created at the intersection of two expanding bubbles. The Lupus 1 cloud, which is located just between US and UCL, seems to be a good example of this process. Its elongated shape is very well consistent with the idea that it was swept up by the interaction of the expanding superbubble around US and the (post-SN) superbubble created by the winds of the remaining early B stars in UCL.
6.3. Ages and Star-Formation History of UCL and LCC
In the UCL and LCC subgroups, Mamajek et al. (2002) found that the HR diagram positions of the stars in both groups are consistent with 95% of their low-mass star-formation occurring within a Myr span. The upper limit on the duration of star-formation is relatively large due to the fact that most of the stars from the Mamajek et al. (2002) survey were on the radiative portion of the PMS evolutionary tracks (where the isochrones are packed closely together), and the binarity of these stars is unstudied. Although Mamajek et al. (2002) did account for the spread in distances of the subgroup members by using cluster parallaxes, the previously mentioned effects conspire to make it difficult to be more precise about the group star-formation history at this time. The mean ages of the PMS populations, using the Baraffe et al. (1998) tracks (16 Myr for UCL, 18 Myr for LCC), and other sets of models (15-22 Myr for UCL, 17-23 Myr for LCC; D’Antona & Mazzitelli 1997; Palla & Stahler 2001; Siess et al. 2000) agree fairly well with the revised turn-off ages (17 Myr for UCL, 16 Myr for LCC; using tracks of Bertelli et al. 1994).
We note two age trends in LCC that are worthy of future investigation. First, there appears to be a mass-dependence on the derived age for LCC. The turn-off age for the B-stars is 16 Myr (but see discussion in Mamajek et al. 2002), while the median ages of the cool members listed in Table 4 are 17 Myr for the F stars, 17 Myr for the G stars, 12 Myr for the K stars, and 4 Myr for the M stars. The 8 M-type members of LCC listed in Table 4 all have isochronal ages in the range 2-7 Myr. The isochronal age for the M-type members is inconsistent with the positions of the main sequence turn-on (F5) and turn-off points (B1). We do not believe that this is evidence for non-coeval formation for the low mass vs. high mass stars, but instead attribute the difference to errors with the evolutionary tracks and/or incompleteness of the member sample among the faintest (i.e. apparently older) low-mass members.
There also appears to be a trend in median age vs. Galactic latitude in LCC, which is probably due to substructure. The median age of the low-mass stars south of the Galactic equator is 12 2 Myr, while the stars north of the equator have a median age of 17 1 Myr. The observed dispersion in the ages, characterized by the 68% confidence intervals, is 7 Myr, however much of this is probably due to observational uncertainties and binarity. The Hipparcos parallax data for the de Zeeuw et al. (1999) members of LCC show that the mean distance to the southern part of the group is closer (109 1 pc) than the northern part (123 2 pc). Immediately south of LCC at the same distance (110 pc) is the Cha region which formed stars as recently as 3-6 Myr ago. Could we be seeing evidence for a north-south axis of triggered star-formation? In this picture, star-formation would have started 17 Myr ago in northern LCC near , , and Cen, progressed southward through the Southern Cross forming and Cru and the southern part of LCC some 12 Myr ago, and progressing further southward to form the and Cha groups some 6 Myr ago.
In comparison to the more elegant picture of star-formation in the smaller Upper Sco region, UCL and LCC probably have more complex histories. The spatial distributions of their members suggest that they contain substructure (and may warrant further subdivision), and are inconsistent with being the evaporating, expanding remnants of two massive embedded clusters. Instead, we suspect that the bulk of star-formation in UCL and LCC proceeded 10-20 Myr ago in a series of multiple embedded clusters and filaments, containing tens to hundreds of stars each, in a dynamically unbound giant molecular cloud complex.
6.4. Stellar Multiplicity
Members of the Sco-Cen association have been the target of several studies concerning the multiplicity of the stars. Brandner & Köhler (1998) and Köhler et al. (2000) carried out K-band speckle observations of more than 100 X-ray-selected weak-line T Tauri stars in Sco-Cen. The derived multiplicity of the stars they observed is times higher than typical for main-sequence stars; almost all of the brighter M-type PMS stars are binaries. Shatsky et al. (2002) examined 115 B-type stars in Sco-Cen for the existence of visual companions in the near-infrared. They derived a times higher binary fraction than found for low-mass dwarfs in the solar neighborhood and in open clusters in the same separation range.
Kouwenhoven et al. (2005, 2007) performed near-infrared adaptive optics surveys of 199 A-type and late B-type Hipparcos members of Sco-Cen with the aim to detect close companions. They found 176 visual companions among these stars and conclude that 80 of these are likely physical companion stars. The estimated masses of these companions are in the range from to . The comparison of their results with visual, spectroscopic, and astrometric data on binarity in Sco-Cen suggests that each system contains on average at least 0.5 companions; this number is a strict lower limit due to the likely presence of further, yet undiscovered companion stars.
Kraus et al. (2005) performed a high-resolution imaging survey of 12 brown dwarfs and very low-mass stars in US with the Advanced Camera for Surveys on HST. This survey discovered three new binary systems, and lead to an estimated binary fraction of , which is consistent with that inferred for higher mass stars in US. Costado et al. (2005) searched for planetary-mass objects and brown dwarfs around nine low-mass members of US, but found no convincing cases of such companions. Luhman (2005) discovered a wide ( AU), low-mass binary system in US with estimated masses of for both components. He concluded that this new system further establishes that the formation of low-mass stars and brown dwarfs does not require ejection from multiple systems and that wide, low-mass binaries can form in OB associations as well as in smaller clusters. Bouy et al. (2006) performed an adaptive-optics imaging survey for multiple systems among 58 M-type members of US and resolved nine pairs with separations below . One of these systems is probably a young brown dwarf binary system.
6.5. Modeling of Binaries
There appear to be several Sco-Cen objects which may be of interest in the broader context of testing stellar evolution theory, as well as refining estimates for the age and metallicity of the subgroups. The most interesting objects in this regard are well-characterized binary systems (mainly eclipsing systems), and low-mass stars which have demonstrated Li depletion. UCL has at least two eclipsing binary systems: Sco and GG Lup. The eclipsing binary Sco is a well-studied massive binary (12.8 M⊙+ 8.4 M⊙; B1.5V+B3; Schneider et al. 1979; Giannuzzi 1983; Stickland et al. 1996), and has been recognized as a Sco-Cen member for many decades. We will briefly discuss some low-mass binaries in more detail.
Although the eclipsing binary GG Lup (B7V+B9V; Andersen et al. 1993) was assigned UCL membership by de Zeeuw et al. (1999), its membership has not been recognized in the binary modeling literature. Within 0.5∘ of GG Lup, and having nearly identical proper motions (also suggestive of UCL membership), are the ROSAT T Tauri stars TTS 26 and 27 (G8 and K0 types; Krautter et al. 1997), the A8/9V star HD 135814, and the MS turn-off star Lup (B2IV). By comparing the parameters of GG Lup to the evolutionary tracks of Claret & Gimenez (1992), Andersen et al. (1993) claim that the system must have a somewhat sub-solar metallicity (Z 0.15), with an age of 20 Myr. Pols et al. (1997) derived ages of 15 6 Myr (no convective overshoot) and 17 Myr (with overshoot) for the system, however work by Lastennet & Valls-Gabaud (2002) was only able to constrain the age to be 50 Myr, with a wide range of possible metallicities (Z 0.014-0.037). The agreement between the model ages for GG Lup with the quoted mean age of the low-mass PMS UCL members (15–22 Myr; Mamajek et al. 2002), and recent estimates of the UCL turn-off age (17 Myr; Mamajek et al. 2002), are surprisingly good. Further observations and modeling of GG Lup and its UCL neighbors could further improve our knowledge of the age and metallicity of UCL.
Another well-constrained binary, however non-eclipsing, is AK Sco (Andersen et al. 1989). Alencar et al. (2003) use the lack of observed eclipses for this equal mass system (two F5 stars), along with the Hipparcos parallax ( = 6.89 1.44 mas), to constrain the masses of the components (1.35 0.07 ). The HR-D positions for the AK Sco A and B, individually, correspond to (log Teff, log L/L⊙ = 3.807, 0.76). Using the evolutionary tracks of Palla & Stahler (2001), this corresponds to an age of 11 Myr and 1.5 M⊙. The mass is some 2 higher than Alencar et al.’s dynamic estimate, but still statistically consistent. All the more remarkable, AK Sco demonstrates spectroscopic and photometric evidence for a circumstellar accretion disk. AK Sco, along with PDS 66, appear to be rare examples of stars which can retain accretion disks for 10 Myr.
Reiners et al. (2005) reported the discovery of a low-mass spectroscopic binary, UScoCTIO 5 (spectral type M4; Ardila, Martín, & Basri 2000), in US. The lower limit to the system mass derived from the orbit fit is higher than the mass suggested by PMS models based on the luminosity and effective temperature, suggesting either problems of the theoretical PMS evolutionary models or uncertainties in the empirical spectral type and/or temperature determination.
6.6. Circumstellar Disk Evolution
Another important aspect is how circumstellar disks evolve and whether their evolution is affected by environmental conditions. Some interesting results on the time scales for mass accretion and disk dissipation have been obtained for Sco-Cen members. First, it was found that the fraction of accreting stars (as traced by strong H emission) is in US (Preibisch et al. 2001), but few% in UCL and LCC (Mamajek et al. 2002). A recent Spitzer study by Carpenter et al. (2006) of US members across the whole stellar mass spectrum has found that circumstellar disk evolution appears to be very mass dependent. Roughly 20% of the (K/M-type) members of US were found to have infrared SEDs consistent with primordial accretion disks, whereas none of the (F/G-type) stars, and only one (of 61) of the massive A/B-type, showed signs of having accretion disks. A small fraction (20%) of the A/B-type massive stars did show evidence for small excesses at 16 m, which could be due to cold, dusty debris disks. A Spitzer study by Chen et al. (2005) investigated infrared excesses tracing dust at 3–40 AU from F/G-type stars from de Zeeuw et al. (1999). The MIPS observations of 40 F- and G-type proper motion members of Sco-Cen detected 14 objects that possess m fluxes larger than their predicted photospheres, tentatively corresponding to a disk fraction of , including seven objects that also possess m excesses times larger than their predicted photospheres. 20% of the targets in US, 9% in UCL, and 46% in LCC display m excesses.
6.7. Lithium Depletion
Another critical area of stellar evolution theory which studies of Sco-Cen membership could address is Li depletion. Li depletion in low-mass stars is predicted to take place the fastest for stars of mass 0.6 M⊙ (Chabrier & Baraffe 1997), which corresponds to spectral type M2 for 10-20 Myr-old objects. Only a small sample of early-M-type stars are known in the UCL and LCC subgroups, primarily among the Krautter-Wichmann and Park-Finley ROSAT TTS samples. Despite the evidence for a short duration of star-formation in US (e.g. Preibisch et al. 2002), Palla & Randich (2005) have recently suggested that the spread in Li abundances among the low-mass members of US may be interpreted as evidence for a significant age spread. A high-resolution spectroscopic study of low-mass Sco-Cen members may be able to address the following questions: Is there a demonstrable spread in Li abundances for stars of a given mass? Does the spread correlate with any fundamental parameters (i.e. rotation, binarity, etc.)? Is there evidence for a spread in ages amongst the low-mass members? Larger samples of low-mass Sco-Cen members are sorely needed to address these topics.
7. The Future
If the IMF predictions are any indication, then the surface of the census of low-mass Sco-Cen members has barely been scratched. Due to its intermediate age, between that of well-studied T associations and nearby ZAMS clusters, as well as its close proximity, the nearest OB association promises to be an important region for studying star-formation up close, and understanding of the PMS evolution of low-mass stars and their circumstellar disks. The Sco-Cen region is a promising hunting ground for future ground-based, high-cadence, photometric and astrometric survey facilities (e.g., Pan-STARRS, SkyMapper) as well as the GAIA astrometric mission. By combining the photometric and astrometric capabilities of these facilities with a focused spectroscopic survey, it is possible that we could construct an accurate 7-dimensional picture (position, velocity, age) of the complete stellar census of our nearest “starburst” within the next decade or two.
Acknowledgments.
We dedicate this review to Adriaan Blaauw, whose Ph.D. thesis 60 years ago, and series of influential papers over the past six decades, laid the foundation for much of our understanding of Sco-Cen, and the other OB associations. We are grateful to Hans Zinnecker and Ronnie Hoogerwerf for valuable comments on the manuscript, and Tim de Zeeuw for providing a figure. Eric Mamajek is supported by a Clay Postdoctoral Fellowship from the Smithsonian Astrophysical Observatory. Thomas Preibisch would like to thank Hans Zinnecker for many years of motivation and advice in studying Upper Scorpius. This work made extensive use of NASA’s Astrophysics Data System Bibliographic Services and the SIMBAD database (CDS, Strasbourg, France).
| USco | SpT | RASS | age | ||||||
|---|---|---|---|---|---|---|---|---|---|
| [mag] | [mag] | [mag] | [K] | [] | [Myr] | ||||
| 153557.8232405 | K3: | RC | 10.88 | 0.86 | 1.4 | 3.649 | 0.90 | 3.0 | |
| 154106.7265626 | G7 | RC | 9.98 | 0.77 | 1.6 | 3.701 | 1.42 | 3.0 | |
| 154413.4252258 | M1 | RC | 11.33 | 1.13 | 0.6 | 3.564 | 0.38 | 1.0 | |
| 154920.9260005 | K0 | RC | 9.71 | 0.64 | 0.7 | 3.676 | 1.10 | 1.8 | |
| 155106.6240218 | M2 | RC | 12.08 | 1.19 | 0.4 | 3.551 | 0.35 | 2.5 | |
| 155231.2263351 | M0 | RC | 10.88 | 0.75 | 0.0 | 3.576 | 0.43 | 1.0 | |
| 155459.9234718 | G2 | RnC | 8.14 | 0.41 | 0.2 | 3.738 | 1.82 | 2.8 | |
| 155506.2252109 | M1 | RnC | 10.57 | 0.86 | 0.0 | 3.564 | 0.33 | 0.6 | |
| 155517.1232216 | M2.5 | 12.17 | 1.11 | 0.0 | 3.545 | 0.30 | 2.9 | ||
| 155548.7251223 | G3 | RC | 9.44 | 0.42 | 0.2 | 3.731 | 1.34 | 9.0 | |
| 155702.3195042 | K7: | RC | 10.24 | 0.77 | 0.2 | 3.609 | 0.50 | 0.8 | |
| 155716.6252918 | M0 | 10.94 | 0.85 | 0.0 | 3.576 | 0.44 | 1.2 | ||
| 155720.0233849 | M0 | 10.95 | 0.92 | 0.0 | 3.576 | 0.44 | 1.2 | ||
| 155725.8235422 | M0.5 | 10.94 | 1.16 | 0.9 | 3.570 | 0.34 | 0.5 | ||
| 155734.4232111 | M1 | RC | 11.37 | 1.18 | 0.8 | 3.564 | 0.38 | 0.9 | |
| 155750.0230508 | M0 | RC | 11.46 | 0.95 | 0.1 | 3.576 | 0.50 | 2.9 | |
| 155812.7232835 | G2 | RnC | 9.25 | 0.47 | 0.4 | 3.738 | 1.47 | 8.0 | |
| 155847.8175800 | K3 | RC | 10.46 | 0.94 | 1.8 | 3.649 | 0.78 | 1.0 | |
| 155902.1184414 | K6 | RC | 10.40 | 0.94 | 1.3 | 3.620 | 0.53 | 0.7 | |
| 155950.0255557 | M2 | RC | 11.89 | 1.31 | 1.0 | 3.551 | 0.35 | 1.5 | |
| 160000.0222037 | M1 | 11.08 | 1.13 | 0.6 | 3.564 | 0.36 | 0.8 | ||
| 160000.7250941 | G0 | RnC | 9.69 | 0.36 | 0.0 | 3.750 | 1.10 | 18.0 | |
| 160013.3241810 | M0 | 11.68 | 1.04 | 0.6 | 3.576 | 0.50 | 3.0 | ||
| 160031.3202705 | M1 | 11.24 | 1.22 | 1.0 | 3.564 | 0.35 | 0.7 | ||
| 160040.6220032 | G9 | RC | 9.95 | 0.56 | 0.5 | 3.685 | 1.22 | 4.0 | |
| 160042.8212737 | K7 | 10.97 | 0.88 | 0.8 | 3.609 | 0.60 | 1.8 | ||
| 160105.2222731 | M3 | 11.27 | 1.33 | 0.5 | 3.538 | 0.27 | 0.5 | ||
| 160108.0211318 | M0 | RC | 10.86 | 0.86 | 0.0 | 3.576 | 0.42 | 1.0 | |
| 160125.7224040 | K1 | RC | 10.16 | 0.63 | 0.6 | 3.667 | 1.05 | 3.0 | |
| 160147.4204945 | M0 | RnC | 10.92 | 1.08 | 0.8 | 3.576 | 0.38 | 0.8 | |
| 160151.4244524 | K7 | RC | 10.54 | 0.84 | 0.6 | 3.609 | 0.53 | 1.0 | |
| 160158.2200811 | G5 | RC | 9.29 | 0.58 | 0.8 | 3.717 | 1.60 | 3.3 | |
| 160200.3222123 | M1 | RC | 11.23 | 1.23 | 1.1 | 3.564 | 0.35 | 0.8 | |
| 160208.5225457 | M1 | 11.91 | 1.13 | 0.6 | 3.564 | 0.43 | 2.8 | ||
| 160210.4224128 | K5 | RC | 9.89 | 0.71 | 0.4 | 3.630 | 0.60 | 0.7 | |
| 160239.1254208 | K7 | RC | 10.80 | 0.73 | 0.0 | 3.609 | 0.65 | 2.7 | |
| 160251.2240156 | K4 | RC | 10.82 | 0.71 | 0.6 | 3.639 | 0.90 | 4.0 | |
| 160253.9202248 | K7 | RC | 10.58 | 0.96 | 1.1 | 3.609 | 0.50 | 0.8 | |
| 160302.7180605 | K4 | RC | 10.78 | 0.83 | 1.1 | 3.639 | 0.80 | 2.2 | |
| 160323.7175142 | M2 | RC | 11.06 | 1.25 | 0.7 | 3.551 | 0.30 | 0.4 | |
| 160354.9203137 | M0 | RC | 11.10 | 1.10 | 0.9 | 3.576 | 0.40 | 0.9 | |
| 160357.6203105 | K5 | RC | 10.92 | 0.81 | 0.9 | 3.630 | 0.78 | 2.9 | |
| 160420.9213042 | M2 | RC | 12.13 | 1.57 | 2.2 | 3.551 | 0.33 | 0.9 | |
| 160421.7213028 | K2 | RC | 10.64 | 0.73 | 1.0 | 3.658 | 1.00 | 3.7 | |
| 160447.7193023 | K2 | RC | 9.82 | 0.65 | 0.6 | 3.658 | 0.90 | 1.2 | |
| 160527.3193846 | M1 | 11.99 | 1.07 | 0.3 | 3.564 | 0.44 | 3.5 | ||
| 160539.1215230 | M1 | 11.93 | 1.18 | 0.8 | 3.564 | 0.43 | 2.5 | ||
| 160542.7200415 | M2 | RC | 11.76 | 1.34 | 1.1 | 3.551 | 0.34 | 1.0 | |
| 160550.5253313 | G7 | RC | 9.99 | 0.47 | 0.2 | 3.701 | 1.20 | 8.5 | |
| 160612.5203647 | K5 | RC | 11.27 | 1.00 | 1.8 | 3.630 | 0.75 | 2.5 | |
| 160621.9192844 | M0.5 | RC | 11.33 | 1.09 | 0.6 | 3.570 | 0.41 | 1.1 | |
| 160637.4210840 | M1 | RC | 11.67 | 1.33 | 1.5 | 3.564 | 0.37 | 0.9 | |
| 160639.9200128 | M3 | 12.79 | 1.43 | 1.0 | 3.538 | 0.27 | 2.8 | ||
| 160654.4241610 | M3 | RC | 10.87 | 1.08 | 0.0 | 3.538 | 1.05 | 3.0 | |
| 160703.5203626 | M0 | RC | 10.22 | 0.90 | 0.0 | 3.576 | 0.33 | 0.5 | |
| 160703.6204308 | M1 | 12.15 | 1.22 | 1.0 | 3.564 | 0.43 | 2.8 | ||
| 160703.9191132 | M1 | RC | 11.81 | 1.23 | 1.1 | 3.564 | 0.40 | 1.7 | |
| 160814.7190833 | K2 | RC | 10.28 | 0.87 | 1.6 | 3.658 | 0.87 | 1.2 | |
| 160831.4180241 | M0 | RC | 11.26 | 0.93 | 0.1 | 3.576 | 0.47 | 2.0 | |
| 160843.4260216 | G7 | RC | 9.30 | 0.71 | 1.3 | 3.701 | 1.50 | 1.8 | |
| 160856.7203346 | K5 | RC | 10.86 | 0.92 | 1.4 | 3.630 | 0.70 | 1.8 | |
| 160930.3210459 | M0 | RC | 11.14 | 0.81 | 0.0 | 3.576 | 0.47 | 2.0 | |
| 160941.0221759 | M0 | RC | 11.06 | 0.84 | 0.0 | 3.576 | 0.45 | 1.8 | |
| 161019.1250230 | M1 | RC | 9.76 | 1.01 | 0.0 | 3.564 | 0.28 | 0.1 | |
| 161021.7190406 | M1 | RnC | 12.26 | 1.45 | 2.1 | 3.564 | 0.40 | 1.8 | |
| 161028.5190446 | M3 | 11.42 | 1.27 | 0.2 | 3.538 | 0.28 | 0.9 | ||
| 161042.0210132 | K5 | RC | 10.74 | 0.94 | 1.5 | 3.630 | 0.66 | 1.1 | |
| 161108.9190446 | K2 | RC | 10.17 | 0.89 | 1.7 | 3.658 | 0.84 | 1.0 | |
| 161120.6182054 | K5 | RnC | 10.73 | 0.83 | 1.0 | 3.630 | 0.70 | 1.8 | |
| 161156.3230404 | M1 | RC | 10.91 | 1.18 | 0.8 | 3.564 | 0.32 | 0.5 | |
| 161159.2190652 | K0 | RC | 10.18 | 0.75 | 1.3 | 3.676 | 1.12 | 2.5 | |
| 161220.9190903 | M2.5 | 12.68 | 1.36 | 0.9 | 3.545 | 0.30 | 3.0 | ||
| 161240.5185927 | K0 | RC | 9.38 | 0.72 | 1.1 | 3.676 | 1.01 | 0.8 | |
| 161302.7225744 | K4 | RC | 10.38 | 1.08 | 2.3 | 3.639 | 0.64 | 0.5 | |
| 161318.6221248 | G9 | RC | 9.25 | 0.66 | 0.9 | 3.685 | 1.18 | 1.0 | |
| 161329.3231106 | K1 | RC | 10.29 | 0.92 | 2.0 | 3.667 | 0.95 | 1.2 | |
| 161402.1230101 | G4 | RC | 10.06 | 0.81 | 2.0 | 3.724 | 1.50 | 5.0 | |
| 161411.0230536 | K0 | RC | 9.19 | 0.99 | 2.4 | 3.676 | 1.02 | 0.3 | |
| 161459.2275023 | G5 | RC | 10.11 | 0.61 | 1.0 | 3.717 | 1.28 | 9.0 | |
| 161534.6224241 | M1 | RC | 10.38 | 1.06 | 0.3 | 3.564 | 0.29 | 0.3 | |
| 161618.0233947 | G7 | RC | 9.55 | 0.67 | 1.1 | 3.701 | 1.47 | 2.2 | |
| 161731.4230334 | G0 | RC | 9.14 | 0.47 | 0.5 | 3.750 | 1.43 | 9.0 | |
| 161933.9222828 | K0 | RC | 10.09 | 0.75 | 1.3 | 3.676 | 1.10 | 2.0 | |
| 162046.0234820 | K3 | RC | 10.70 | 1.03 | 2.2 | 3.649 | 0.78 | 1.0 | |
| 162307.8230059 | K2 | RC | 10.18 | 0.69 | 0.8 | 3.658 | 0.93 | 2.0 | |
| 162948.6215211 | K0 | RC | 9.77 | 0.71 | 1.1 | 3.676 | 1.08 | 1.8 |
| USco- | SpT | ||||||
|---|---|---|---|---|---|---|---|
| [mag] | [Å] | [Å] | [mag] | [K] | |||
| 155532.4-230817 | 16.8 | 0.15 | 0.5 | M1 | 5.7 | 3.569 | -0.75 |
| 155624.8-222555 | 15.5 | 0.78 | -5.4 | M4 | 1.7 | 3.516 | -1.12 |
| 155625.7-224027 | 14.6 | 0.53 | -4.2 | M3 | 1.8 | 3.532 | -0.85 |
| 155629.5-225657 | 14.3 | 0.54 | -3.1 | M3 | 0.9 | 3.533 | -0.98 |
| 155655.5-225839 | 13.1 | 0.54 | -1.9 | M0 | 0.7 | 3.578 | -0.69 |
| 155706.4-220606 | 16.2 | 0.52 | -3.6 | M4 | 2.0 | 3.513 | -1.31 |
| 155728.5-221904 | 16.7 | 0.40 | -6.2 | M5 | 2.3 | 3.505 | -1.37 |
| 155729.2-221523 | 17.1 | 0.29 | -4.0 | M5 | 2.1 | 3.503 | -1.58 |
| 155729.9-225843 | 15.8 | 0.55 | -7.0 | M4 | 1.4 | 3.511 | -1.30 |
| 155737.2-224524 | 16.7 | 0.15 | 0.0 | M2 | 1.6 | 3.544 | -1.76 |
| 155742.5-222605 | 15.7 | 0.15 | -2.9 | M3 | 1.8 | 3.526 | -1.22 |
| 155744.9-222351 | 14.3 | 0.13 | 0.9 | M2 | 0.7 | 3.558 | -1.11 |
| 155746.6-222919 | 14.7 | 0.69 | -2.1 | M3 | 1.3 | 3.533 | -1.01 |
| 155829.8-231007 | 15.4 | 0.41 | -250 | M3 | 0.0 | 3.532 | -1.63 |
| 155848.6-224657 | 14.5 | 0.19 | -0.5 | M0 | 0.7 | 3.579 | -1.24 |
| 155912.5-223650 | 16.4 | 0.89 | -10.5 | M5 | 0.3 | 3.493 | -1.70 |
| 155918.4-221042 | 14.7 | 0.98 | -1.0 | M4 | 1.3 | 3.515 | -0.90 |
| 155925.9-230508 | 17.0 | 0.65 | -19.5 | M6 | 1.5 | 3.485 | -1.57 |
| 155930.1-225125 | 17.6 | 0.70 | -5.0 | M4 | 2.5 | 3.511 | -1.71 |
| 160004.3-223014 | 14.9 | 0.20 | -0.4 | M3 | 0.2 | 3.528 | -1.40 |
| 160007.2-222406 | 16.8 | 0.27 | -4.4 | M4 | 0.6 | 3.509 | -1.91 |
| 160017.4-221810 | 16.5 | 0.50 | -3.9 | M6 | 0.0 | 3.481 | -1.79 |
| 160018.4-223011 | 14.7 | 0.30 | -150 | M3 | 1.5 | 3.539 | -0.97 |
| 160026.3-225941 | 16.8 | 1.00 | -10.0 | M5 | 2.5 | 3.495 | -1.25 |
| 160028.5-220922 | 16.8 | 0.65 | 0.0 | M6 | 0.0 | 3.476 | -1.93 |
| 160030.2-233445 | 17.2 | 0.50 | -15.8 | M6 | 1.0 | 3.476 | -1.71 |
| 160054.5-224908 | 14.7 | 0.10 | 0.0 | M3 | 1.0 | 3.530 | -1.09 |
| 160106.0-221524 | 15.9 | 0.80 | -8.0 | M5 | 1.0 | 3.501 | -1.38 |
| 160110.4-222227 | 14.2 | 0.80 | -9.4 | M4 | 1.0 | 3.513 | -0.78 |
| 160121.5-223726 | 14.2 | 0.80 | -8.4 | M4 | 0.4 | 3.507 | -0.92 |
| 160129.8-224838 | 14.9 | 0.80 | -4.4 | M4 | 1.6 | 3.515 | -0.90 |
| 160132.9-224231 | 14.6 | 0.20 | -1.4 | M0 | 0.9 | 3.580 | -1.22 |
| 160140.8-225810 | 14.0 | 0.45 | -120 | M3 | 0.0 | 3.528 | -1.16 |
| 160142.6-222923 | 13.5 | 0.33 | -0.6 | M0 | 0.7 | 3.580 | -0.87 |
| 160158.9-224036 | 14.4 | 0.80 | -7.6 | M4 | 0.7 | 3.515 | -0.97 |
| 160159.7-195219 | 16.3 | 0.47 | -2.7 | M5 | 2.0 | 3.497 | -1.22 |
| 160202.9-223613 | 14.7 | 0.18 | -1.5 | M0 | 1.6 | 3.575 | -1.08 |
| 160207.5-225746 | 13.7 | 0.30 | -3.2 | M1 | 0.9 | 3.565 | -0.81 |
| 160210.9-200749 | 16.4 | 0.65 | -3.5 | M5 | 1.6 | 3.501 | -1.40 |
| 160222.4-195653 | 14.7 | 0.40 | -6.6 | M3 | 1.6 | 3.533 | -0.95 |
| 160226.2-200241 | 15.2 | 0.47 | -4.9 | M5 | 0.0 | 3.495 | -1.39 |
| 160236.2-191732 | 17.3 | 0.40 | 0.7 | M3 | 2.5 | 3.539 | -1.74 |
| 160245.4-194604 | 15.9 | 0.30 | 0.7 | M2 | 1.4 | 3.550 | -1.54 |
| 160245.4-193037 | 16.4 | 0.51 | -1.1 | M5 | 1.8 | 3.495 | -1.31 |
| 160245.7-230450 | 16.7 | 1.00 | -100 | M6 | 1.5 | 3.485 | -1.46 |
| 160258.5-225649 | 13.9 | 1.00 | -9.4 | M2 | 0.8 | 3.546 | -0.88 |
| 160325.6-194438 | 15.4 | 0.20 | -1.4 | M2 | 1.6 | 3.544 | -1.22 |
| 160329.4-195503 | 15.7 | 0.40 | -4.9 | M5 | 1.0 | 3.503 | -1.30 |
| 160341.8-200557 | 13.5 | 0.30 | -2.2 | M2 | 0.9 | 3.555 | -0.70 |
| 160343.3-201531 | 13.6 | 0.49 | -3.5 | M2 | 0.9 | 3.558 | -0.76 |
| 160350.4-194121 | 15.0 | 0.59 | -4.9 | M5 | 0.6 | 3.505 | -1.17 |
| 160357.9-194210 | 14.5 | 0.35 | -3.0 | M2 | 1.7 | 3.546 | -0.87 |
| 160407.7-194857 | 16.8 | 0.22 | -4.0 | M5 | 0.7 | 3.499 | -1.80 |
| 160418.2-191055 | 15.4 | 0.76 | -0.5 | M4 | 2.3 | 3.524 | -0.99 |
| 160428.0-190434 | 15.8 | 0.55 | -3.4 | M4 | 2.4 | 3.516 | -1.05 |
| 160428.4-190441 | 13.5 | 0.68 | -5.0 | M3 | 1.0 | 3.532 | -0.63 |
| 160435.6-194830 | 16.1 | 0.63 | -7.2 | M5 | 1.6 | 3.499 | -1.29 |
| 160439.1-194245 | 15.1 | 0.61 | -3.8 | M4 | 0.9 | 3.518 | -1.18 |
| 160449.9-203835 | 16.0 | 0.65 | -7.8 | M5 | 1.0 | 3.497 | -1.37 |
| 160456.4-194045 | 15.0 | 0.54 | -5.2 | M4 | 0.9 | 3.507 | -1.10 |
| 160502.1-203507 | 13.6 | 0.57 | -5.9 | M2 | 1.8 | 3.551 | -0.53 |
| 160508.3-201531 | 13.3 | 0.58 | -4.3 | M4 | 0.0 | 3.524 | -0.80 |
| 160508.5-201532 | 14.0 | 0.46 | -5.5 | M4 | 0.4 | 3.518 | -0.90 |
| 160516.1-193830 | 15.6 | 0.50 | -2.4 | M4 | 1.1 | 3.520 | -1.35 |
| 160517.9-202420 | 12.9 | 0.41 | -5.2 | M3 | 0.6 | 3.542 | -0.56 |
| 160521.9-193602 | 13.9 | 0.50 | -1.9 | M1 | 1.2 | 3.563 | -0.83 |
| 160522.7-205111 | 14.8 | 0.10 | -4.5 | M4 | 1.1 | 3.518 | -1.03 |
| 160525.5-203539 | 16.1 | 0.48 | -6.1 | M5 | 1.5 | 3.499 | -1.30 |
| 160528.5-201037 | 14.1 | 0.55 | -1.9 | M1 | 1.4 | 3.569 | -0.85 |
| 160531.3-192623 | 16.7 | 0.58 | -8.8 | M5 | 1.8 | 3.497 | -1.48 |
| 160532.1-193315 | 16.5 | 0.61 | -26.0 | M5 | 0.0 | 3.499 | -1.88 |
| 160545.4-202308 | 14.4 | 0.31 | -35.0 | M2 | 1.4 | 3.560 | -0.98 |
| 160600.6-195711 | 14.9 | 0.80 | -7.5 | M5 | 1.7 | 3.505 | -0.82 |
| 160611.9-193532 | 16.0 | 0.63 | -8.2 | M5 | 0.9 | 3.495 | -1.39 |
| 160619.3-192332 | 16.4 | 0.52 | -5.5 | M5 | 1.9 | 3.505 | -1.37 |
| 160622.8-201124 | 15.4 | 0.53 | -6.0 | M5 | 0.0 | 3.499 | -1.47 |
| 160628.7-200357 | 15.0 | 0.58 | -30.0 | M5 | 0.6 | 3.499 | -1.12 |
| 160629.0-205216 | 15.1 | 0.68 | -6.2 | M5 | 1.2 | 3.497 | -0.99 |
| 160632.1-202053 | 17.3 | 0.69 | -5.1 | M5 | 1.5 | 3.495 | -1.78 |
| 160643.8-190805 | 12.7 | 0.65 | -3.8 | K6 | 1.9 | 3.623 | -0.31 |
| 160647.5-202232 | 13.9 | 0.41 | -3.2 | M2 | 1.6 | 3.557 | -0.70 |
| 160700.1-203309 | 14.1 | 0.65 | -0.6 | M2 | 1.8 | 3.551 | -0.69 |
| 160702.1-201938 | 16.3 | 0.39 | -30.0 | M5 | 1.7 | 3.501 | -1.37 |
| 160704.7-201555 | 16.2 | 0.61 | -4.2 | M4 | 1.7 | 3.511 | -1.39 |
| 160707.7-192715 | 14.0 | 0.57 | -5.0 | M2 | 2.2 | 3.548 | -0.52 |
| 160708.7-192733 | 15.8 | 0.52 | -4.0 | M4 | 1.7 | 3.516 | -1.26 |
| 160710.0-191703 | 16.6 | 0.90 | -9.0 | M2 | 3.6 | 3.551 | -1.23 |
| 160716.0-204443 | 14.7 | 0.68 | -3.6 | M4 | 1.2 | 3.524 | -0.97 |
| 160719.7-202055 | 15.3 | 0.57 | -2.3 | M3 | 2.7 | 3.542 | -0.89 |
| 160722.4-201158 | 17.2 | 0.50 | -14.0 | M5 | 2.3 | 3.491 | -1.47 |
| 160726.8-185521 | 14.1 | 0.33 | -1.9 | M1 | 1.1 | 3.569 | -0.97 |
| 160727.5-201834 | 17.3 | 0.90 | -13.0 | M5 | 2.4 | 3.487 | -1.45 |
| 160735.5-202713 | 17.2 | 0.75 | -4.9 | M5 | 2.3 | 3.505 | -1.57 |
| 160739.4-191747 | 14.0 | 0.52 | -2.3 | M2 | 1.6 | 3.560 | -0.72 |
| 160744.5-203602 | 13.6 | 0.50 | -4.8 | M4 | 0.8 | 3.516 | -0.61 |
| 160745.8-203055 | 17.3 | 0.30 | -2.0 | M3 | 1.9 | 3.530 | -1.87 |
| 160800.5-204028 | 16.3 | 0.34 | -5.2 | M5 | 1.9 | 3.501 | -1.31 |
| 160801.4-202741 | 12.8 | 0.83 | -2.3 | K8 | 1.5 | 3.601 | -0.45 |
| 160801.5-192757 | 14.0 | 0.52 | -3.6 | M4 | 1.0 | 3.524 | -0.76 |
| 160802.4-202233 | 15.3 | 0.60 | -6.1 | M5 | 0.5 | 3.499 | -1.27 |
| 160803.6-181237 | 17.3 | 0.35 | -7.7 | M4 | 3.9 | 3.515 | -1.23 |
| 160804.3-194712 | 14.0 | 0.91 | -5.2 | M4 | 0.0 | 3.516 | -1.17 |
| 160815.3-203811 | 15.1 | 0.57 | -1.9 | M3 | 2.1 | 3.542 | -0.98 |
| 160818.4-190059 | 14.1 | 0.72 | -3.7 | M3 | 0.3 | 3.528 | -1.03 |
| 160822.4-193004 | 12.9 | 0.29 | -3.0 | M1 | 1.2 | 3.571 | -0.43 |
| 160823.2-193001 | 13.1 | 0.49 | -6.0 | K9 | 1.5 | 3.586 | -0.49 |
| 160823.5-191131 | 14.1 | 0.59 | -4.1 | M2 | 1.5 | 3.544 | -0.79 |
| 160823.8-193551 | 13.2 | 0.72 | -2.1 | M1 | 1.5 | 3.569 | -0.47 |
| 160825.1-201224 | 13.7 | 0.41 | -2.0 | M1 | 1.3 | 3.574 | -0.77 |
| 160827.5-194904 | 15.6 | 0.57 | -12.3 | M5 | 1.4 | 3.495 | -1.11 |
| 160841.7-185610 | 16.9 | 0.70 | -11.0 | M6 | 1.1 | 3.483 | -1.61 |
| 160843.1-190051 | 14.9 | 0.57 | -5.8 | M4 | 1.3 | 3.515 | -1.00 |
| 160845.6-182443 | 13.7 | 0.70 | 0.5 | M3 | 0.2 | 3.533 | -0.93 |
| 160854.0-203417 | 14.8 | 0.57 | -3.4 | M4 | 1.5 | 3.518 | -0.90 |
| 160900.0-190836 | 15.9 | 0.62 | -15.4 | M5 | 0.7 | 3.503 | -1.45 |
| 160900.7-190852 | 12.8 | 0.53 | -12.7 | K9 | 0.8 | 3.592 | -0.60 |
| 160903.9-193944 | 14.6 | 0.68 | -7.2 | M4 | 0.6 | 3.520 | -1.10 |
| 160904.0-193359 | 15.5 | 0.80 | -2.2 | M4 | 2.5 | 3.524 | -0.96 |
| 160908.4-200928 | 13.4 | 0.66 | -4.0 | M4 | 0.7 | 3.518 | -0.60 |
| 160913.4-194328 | 14.9 | 0.54 | -1.6 | M3 | 1.8 | 3.537 | -0.97 |
| 160915.8-193706 | 16.1 | 0.78 | -4.4 | M5 | 0.7 | 3.499 | -1.53 |
| 160916.8-183522 | 13.8 | 0.55 | -3.0 | M2 | 1.0 | 3.546 | -0.80 |
| 160926.7-192502 | 14.9 | 0.40 | 0.0 | M3 | 1.0 | 3.528 | -1.16 |
| 160933.8-190456 | 14.1 | 0.57 | -3.5 | M2 | 1.4 | 3.557 | -0.83 |
| 160935.6-182822 | 15.5 | 0.75 | -4.2 | M3 | 1.8 | 3.528 | -1.17 |
| 160936.5-184800 | 15.0 | 0.57 | -18.0 | M3 | 1.2 | 3.532 | -1.14 |
| 160943.8-182302 | 15.0 | 0.48 | -5.8 | M4 | 1.9 | 3.516 | -0.86 |
| 160946.4-193735 | 13.5 | 0.49 | -1.6 | M1 | 1.6 | 3.569 | -0.57 |
| 160953.6-175446 | 16.6 | 1.30 | -22.0 | M3 | 4.1 | 3.539 | -1.03 |
| 160954.4-190654 | 13.5 | 0.70 | -3.1 | M1 | 0.9 | 3.569 | -0.78 |
| 160959.4-180009 | 14.7 | 0.58 | -4.0 | M4 | 0.2 | 3.518 | -1.26 |
| 161007.5-181056 | 17.8 | 0.44 | -13.3 | M6 | 1.9 | 3.474 | -1.70 |
| 161010.4-194539 | 14.7 | 0.49 | -5.6 | M3 | 1.4 | 3.533 | -1.01 |
| 161011.0-194603 | 16.2 | 0.70 | -4.4 | M5 | 0.3 | 3.487 | -1.58 |
| 161014.7-191909 | 14.4 | 0.62 | -2.3 | M3 | 1.0 | 3.535 | -0.97 |
| 161021.5-194132 | 14.0 | 0.40 | -4.3 | M3 | 2.0 | 3.541 | -0.59 |
| 161024.7-191407 | 14.9 | 0.55 | -3.7 | M3 | 1.5 | 3.528 | -0.99 |
| 161026.4-193950 | 15.0 | 0.62 | -4.4 | M4 | 1.9 | 3.516 | -0.87 |
| 161028.1-191043 | 17.3 | 0.65 | -11.4 | M4 | 2.1 | 3.511 | -1.72 |
| 161030.0-183906 | 16.1 | 0.54 | -6.5 | M4 | 2.0 | 3.507 | -1.23 |
| 161030.9-182422 | 15.1 | 0.55 | -3.4 | M3 | 1.8 | 3.535 | -1.04 |
| 161031.9-191305 | 12.6 | 0.50 | -2.3 | K7 | 1.1 | 3.607 | -0.48 |
| 161039.5-191652 | 14.5 | 0.53 | -4.3 | M2 | 1.5 | 3.551 | -0.96 |
| 161043.9-192225 | 14.0 | 0.67 | -2.3 | M3 | 1.1 | 3.539 | -0.83 |
| 161046.3-184059 | 16.8 | 0.51 | -7.2 | M4 | 3.1 | 3.516 | -1.28 |
| 161052.4-193734 | 15.4 | 0.93 | -3.9 | M3 | 2.3 | 3.526 | -1.00 |
| 161110.9-193331 | 16.2 | 0.63 | -6.3 | M5 | 1.1 | 3.501 | -1.46 |
| 161112.3-192737 | 17.3 | 0.30 | -50.0 | M5 | 1.4 | 3.501 | -1.83 |
| 161115.3-175721 | 13.1 | 0.55 | -2.4 | M1 | 1.6 | 3.574 | -0.42 |
| 161116.6-193910 | 13.9 | 0.47 | -3.4 | M4 | 0.6 | 3.513 | -0.77 |
| 161118.1-175728 | 13.9 | 0.55 | -4.8 | M4 | 0.9 | 3.515 | -0.69 |
| 161118.2-180358 | 17.5 | 0.90 | -20.0 | M6 | 1.6 | 3.476 | -1.65 |
| 161120.4-191937 | 14.1 | 0.51 | -5.5 | M2 | 0.6 | 3.544 | -1.00 |
| 161123.0-190522 | 14.4 | 0.40 | -6.9 | M3 | 1.7 | 3.528 | -0.74 |
| 161129.4-194224 | 16.4 | 0.80 | -13.0 | M6 | 0.8 | 3.483 | -1.49 |
| 161133.6-191400 | 14.4 | 0.56 | -3.7 | M3 | 1.8 | 3.537 | -0.79 |
| 161146.1-190742 | 16.2 | 0.47 | -6.3 | M5 | 1.6 | 3.503 | -1.37 |
| 161156.2-194323 | 14.1 | 0.60 | -6.3 | M3 | 0.7 | 3.542 | -0.97 |
| 161247.2-190353 | 17.4 | 0.88 | -10.6 | M6 | 1.3 | 3.485 | -1.78 |
| 161248.9-180052 | 14.6 | 0.52 | -3.8 | M3 | 1.4 | 3.530 | -0.92 |
| 161328.0-192452 | 17.8 | 0.40 | -17.0 | M5 | 2.2 | 3.491 | -1.73 |
| 161347.5-183459 | 14.6 | 0.52 | -3.5 | M2 | 1.5 | 3.544 | -0.98 |
| 161358.1-184828 | 13.7 | 0.57 | -1.9 | M2 | 1.0 | 3.553 | -0.76 |
| 161420.2-190648 | 13.2 | 0.37 | -52.0 | K5 | 1.8 | 3.630 | -0.59 |
| 161433.6-190013 | 14.2 | 0.64 | -26.0 | M2 | 2.2 | 3.551 | -0.60 |
| 161437.5-185823 | 15.7 | 0.13 | -3.6 | M3 | 1.4 | 3.533 | -1.42 |
| Name | 2MASS J | SpT | AV | Dist | log | log | log | log | Age | X-ray | ||
|---|---|---|---|---|---|---|---|---|---|---|---|---|
| [mag] | [mag] | [pc] | [erg/s] | [K] | [Myr] | [] | counterpart | |||||
| MML 36 | 13375730-4134419 | K0IV | 10.08 | -0.07 | 98 | 30.4 | -3.2 | 3.72 | 0.00 | 19 | 1.1 | 1RXS J133758.0-413448 |
| MML 38 | 13475054-4902056 | G8IVe | 10.82 | 0.45 | 148 | 30.5 | -3.2 | 3.74 | 0.05 | 22 | 1.1 | 1RXS J134748.0-490158 |
| HIP 67522 | 13500627-4050090 | G0.5IV | 9.79 | 0.02 | 126 | 30.4 | -3.5 | 3.77 | 0.25 | 21 | 1.2 | 1RXS J135005.7-405001 |
| MML 39 | 13524780-4644092 | G0IV | 9.62 | 0.34 | 145 | 30.8 | -3.3 | 3.78 | 0.44 | 16 | 1.3 | 1RXS J135247.0-464412 |
| MML 40 | 14022072-4144509 | G9IV | 10.71 | 0.90 | 130 | 30.3 | -3.3 | 3.73 | 0.07 | 18 | 1.1 | 1RXS J140220.9-414435 |
| MML 41 | 14090357-4438442 | F9IV | 9.39 | 0.38 | 142 | 30.7 | -3.5 | 3.78 | 0.50 | 15 | 1.3 | 1RXS J140902.6-443838 |
| HIP 70350 | 14233787-4357426 | F7V | 8.13 | 0.12 | 107 | 30.8 | -3.6 | 3.81 | 0.64 | 15 | 1.4 | 1RXS J142338.0-435814 |
| HIP 70376 | 14235639-5029585 | F7V | 9.20 | 0.27 | 122 | 30.4 | -3.6 | 3.81 | 0.39 | … | … | 1RXS J142356.2-503006 |
| MML 43 | 14270556-4714217 | G7IV | 10.59 | 0.17 | 132 | 30.4 | -3.3 | 3.75 | 0.06 | 23 | 1.1 | 1RXS J142705.3-471420 |
| HIP 70689 | 14273044-5231304 | F2V | 8.53 | 0.00 | 105 | 29.6 | -4.4 | 3.85 | 0.40 | … | … | 1RXS J142729.5-523141 |
| MML 44 | 14280929-4414175 | G5.5IV | 9.78 | 0.33 | 161 | 30.6 | -3.5 | 3.75 | 0.54 | 9 | 1.4 | 1RXS J142809.6-441438 |
| MML 45 | 14281937-4219341 | G3.5IV | 10.47 | 0.37 | 159 | 30.8 | -3.0 | 3.76 | 0.33 | 16 | 1.3 | 1RXS J142817.6-421958 |
| HIP 70919 | 14301035-4332490 | G8III | 8.88 | 0.00 | 193 | 30.8 | -3.9 | 3.68 | 0.84 | 1 | 2.2 | 1RXS J143008.7-433313 |
| HIP 71023 | 14313339-4445019 | F0V | 8.94 | 0.15 | 160 | 30.6 | -3.9 | 3.86 | 0.65 | … | … | 1RXS J143135.2-444526 |
| HIP 71178 | 14332578-3432376 | G8IVe | 10.18 | 0.35 | 115 | 29.8 | -3.9 | 3.74 | 0.16 | 16 | 1.2 | … |
| MML 46 | 14370422-4145028 | G0.5IV | 9.70 | 0.18 | 156 | 30.7 | -3.4 | 3.78 | 0.59 | 11 | 1.4 | 1RXS J143704.6-414504 |
| MML 47 | 14375022-5457411 | K0+IV | 10.72 | 0.30 | 132 | 30.6 | -3.0 | 3.72 | 0.08 | 13 | 1.2 | 1RXS J143750.9-545708 |
| HIP 71767 | 14404593-4247063 | F3V | 9.02 | 0.20 | 168 | 30.6 | -3.9 | 3.84 | 0.70 | 15 | 1.5 | 1RXS J144044.6-424720 |
| MML 48 | 14413499-4700288 | G4IV | 10.00 | 0.02 | 110 | 30.9 | -2.8 | 3.76 | 0.20 | 20 | 1.2 | 1RXS J144135.3-470039 |
| HIP 72033 | 14440435-4059223 | F7IV/V | 9.17 | 0.23 | 156 | 30.3 | -3.9 | 3.81 | 0.60 | 15 | 1.4 | 1RXS J144405.2-405940 |
| HD 129791B | 14455620-4452346 | K5Ve | 12.93 | 0.26 | 132 | 30.6 | -2.9 | 3.63 | -0.52 | 18 | 0.9 | 1RXS J144556.0-445202 |
| MML 49 | 14473176-4800056 | G2.5IV | 10.72 | 0.43 | 130 | 30.2 | -3.4 | 3.77 | -0.05 | … | … | 1RXS J144732.2-480019 |
| MML 50 | 14502581-3506486 | K0IV | 10.73 | 0.21 | 190 | 30.6 | -3.3 | 3.72 | 0.52 | 5 | 1.6 | 1RXS J145025.4-350645 |
| MML 51 | 14524198-4141552 | K1IVe | 10.89 | 0.61 | 145 | 30.5 | -3.2 | 3.70 | 0.10 | 9 | 1.3 | 1RXS J145240.7-414206 |
| MML 52 | 14571962-3612274 | G6IV | 10.27 | 0.15 | 132 | 30.3 | -3.4 | 3.75 | 0.18 | 18 | 1.1 | 1RXS J145720.4-361242 |
| MML 53 | 14583769-3540302 | K2-IVe | 10.75 | 0.23 | 136 | 30.3 | -3.4 | 3.69 | 0.21 | 6 | 1.4 | 1RXS J145837.6-354036 |
| MML 54 | 14592275-4013120 | G3IV | 9.71 | 0.40 | 122 | 30.5 | -3.4 | 3.76 | 0.32 | 17 | 1.2 | 1RXS J145923.0-401319 |
| MML 55 | 15005189-4331212 | G9IV | 11.15 | 0.30 | 163 | 30.4 | -3.2 | 3.73 | 0.16 | 14 | 1.2 | 1RXS J150052.5-433107 |
| MML 56 | 15011155-4120406 | G0.5IV | 10.01 | 0.48 | 214 | 31.0 | -3.3 | 3.77 | 0.64 | 10 | 1.4 | 1RXS J150112.0-412040 |
| MML 57 | 15015882-4755464 | G1.5IV | 10.15 | 0.22 | 156 | 30.2 | -3.8 | 3.77 | 0.29 | 19 | 1.2 | 1RXS J150158.5-475559 |
| MML 58 | 15071481-3504595 | G9.5IV | 10.49 | 0.44 | 101 | 30.0 | -3.4 | 3.73 | -0.12 | 28 | 1.0 | 1RXS J150714.5-350500 |
| MML 59 | 15083773-4423170 | G1.5IVe | 10.83 | 0.13 | 180 | 30.9 | -2.9 | 3.77 | 0.29 | 19 | 1.2 | 1RXS J150836.0-442325 |
| MML 60 | 15083849-4400519 | G1.5IV | 10.54 | 0.11 | 134 | 30.4 | -3.3 | 3.77 | 0.20 | 23 | 1.1 | 1RXS J150838.5-440048 |
| MML 61 | 15125018-4508044 | G5IV | 10.71 | 0.27 | 151 | 30.6 | -3.1 | 3.76 | 0.19 | 19 | 1.2 | 1RXS J151250.0-450822 |
| HIP 74501 | 15132923-5543545 | G2IV | 7.47 | 0.00 | 153 | 30.0 | -5.2 | 3.74 | 1.19 | 1 | 2.4 | 1RXS J151330.3-554341 |
| MML 62 | 15180174-5317287 | G7IV | 10.12 | 0.77 | 103 | 30.4 | -3.3 | 3.75 | 0.08 | 22 | 1.1 | 1RXS J151802.0-531719 |
| MML 63 | 15182692-3738021 | G9IV | 11.02 | 0.72 | 127 | 30.4 | -3.0 | 3.73 | 0.05 | 18 | 1.1 | 1RXS J151827.3-373808 |
| MML 64 | 15255964-4501157 | G8IV | 10.90 | 0.19 | 149 | 30.1 | -3.5 | 3.74 | -0.02 | 26 | 1.0 | 1RXS J152600.9-450113 |
| MML 65* | 15293858-3546513 | K0+IV | 10.43 | 0.16 | 135 | 30.3 | -3.4 | 3.72 | 0.17 | 10 | 1.3 | 1RXS J152937.7-354656 |
| HIP 75924 | 15302626-3218122 | G2.5IV | 8.80 | 0.37 | 102 | 30.9 | -2.9 | 3.77 | 0.69 | 5 | 1.7 | 1RXS J153026.1-321815 |
| HIP 76084 | 15322013-3108337 | F2V | 8.62 | 0.16 | 149 | 29.8 | -4.6 | 3.85 | 0.73 | 15 | 1.5 | 1RXS J153218.2-310828 |
| MML 66 | 15370214-3136398 | G6IV | 9.99 | 0.43 | 135 | 30.9 | -3.0 | 3.75 | 0.42 | 11 | 1.3 | 1RXS J153701.9-313647 |
| HIP 76472 | 15370466-4009221 | G1IV | 9.39 | 0.29 | 138 | 30.8 | -3.3 | 3.77 | 0.60 | 11 | 1.4 | 1RXS J153706.0-400929 |
| MML 67 | 15371129-4015566 | G8.5IVe | 10.43 | 0.40 | 164 | 30.7 | -3.2 | 3.74 | 0.25 | 11 | 1.3 | 1RXS J153711.6-401608 |
| MML 68 | 15384306-4411474 | G8.5IV | 10.28 | 0.62 | 124 | 30.3 | -3.4 | 3.74 | 0.08 | 19 | 1.1 | 1RXS J153843.1-441149 |
| MML 69 | 15392440-2710218 | G5IV | 9.57 | 0.28 | 127 | 30.7 | -3.3 | 3.76 | 0.46 | 11 | 1.3 | 1RXS J153924.0-271035 |
| MML 70* | 15440376-3311110 | K0IVe | 10.87 | 0.47 | 124 | 30.2 | -3.3 | 3.72 | 0.01 | 18 | 1.1 | 1RXS J154404.1-331120 |
| HIP 77081* | 15442105-3318549 | G7.5IV | 9.69 | 0.15 | 131 | 29.9 | -4.1 | 3.74 | 0.35 | 11 | 1.3 | … |
| HIP 77135* | 15445769-3411535 | G4IV | 9.88 | 0.08 | 139 | 30.5 | -3.4 | 3.76 | 0.42 | 12 | 1.3 | 1RXS J154458.0-341143 |
| HIP 77144 | 15450184-4050310 | G0IV | 9.46 | 0.08 | 125 | 30.6 | -3.4 | 3.78 | 0.36 | 20 | 1.2 | 1RXS J154502.0-405043 |
| MML 71 | 15455225-4222163 | K2-IVe | 10.50 | 0.80 | 130 | 30.9 | -2.9 | 3.69 | 0.12 | 8 | 1.3 | 1RXS J154552.7-422227 |
| MML 72 | 15465179-4919048 | G7.5IV | 10.18 | 0.29 | 132 | 30.5 | -3.3 | 3.74 | 0.21 | 15 | 1.2 | 1RXS J154651.5-491922 |
| HIP 77524* | 15494499-3925089 | K1-IVe | 10.64 | -0.03 | 151 | 30.5 | -3.3 | 3.71 | 0.23 | 9 | 1.3 | 1RXS J154944.7-392509 |
| HIP 77656 | 15511373-4218513 | G5IV | 9.58 | 0.52 | 130 | 30.3 | -3.8 | 3.76 | 0.41 | 12 | 1.3 | 1RXS J155113.5-421858 |
| MML 73* | 15565905-3933430 | G9.5IV | 10.81 | 0.35 | 174 | 30.5 | -3.4 | 3.73 | 0.21 | 11 | 1.3 | 1RXS J155659.0-393400 |
| HD 143099* | 15595826-3824317 | G0V | 9.33 | 0.00 | 142 | 30.4 | -3.7 | 3.78 | 0.48 | 15 | 1.3 | 1RXS J155958.3-382352 |
| MML 74 | 16010792-3254526 | G0IV | 9.50 | 0.15 | 132 | 30.6 | -3.4 | 3.78 | 0.33 | 20 | 1.2 | 1RXS J160108.0-325455 |
| MML 75 | 16010896-3320141 | G5IV | 10.88 | 0.16 | 176 | 30.6 | -3.1 | 3.76 | 0.41 | 11 | 1.4 | 1RXS J160108.9-332021 |
| MML 76 | 16034536-4355492 | G9.5IV | 9.64 | 0.51 | 178 | 31.2 | -3.1 | 3.73 | 0.75 | 4 | 1.8 | 1RXS J160345.8-435544 |
| MML 77* | 16035250-3939013 | K2-IVe | 11.01 | 0.18 | 140 | 30.4 | -3.2 | 3.69 | 0.09 | 7 | 1.4 | 1RXS J160352.0-393901 |
| HD 143939B* | 16044404-3926117 | K3Ve | 11.80 | 0.00 | 149 | 30.5 | -3.0 | 3.67 | -0.37 | 23 | 0.9 | 1RXS J160444.6-392602 |
| MML 78* | 16054499-3906065 | G6.5IV | 10.53 | 0.19 | 130 | 30.5 | -3.1 | 3.75 | 0.13 | 20 | 1.1 | 1RXS J160545.8-390559 |
| HIP 78881* | 16060937-3802180 | F3V | 8.03 | 0.26 | 128 | 30.7 | -3.8 | 3.84 | 0.88 | 11 | 1.6 | 1RXS J160610.3-380215 |
| HIP 79516 | 16133433-4549035 | F5V | 8.91 | 0.02 | 120 | 30.0 | -4.1 | 3.82 | 0.38 | 20 | 1.3 | 1RXS J161335.9-454901 |
| MML 79 | 16135801-3618133 | G9IVe | 11.14 | 0.31 | 123 | 30.4 | -2.9 | 3.73 | -0.13 | 31 | 1.0 | 1RXS J161357.9-361813 |
| MML 80 | 16145207-5026187 | G9.5IV | 10.41 | 0.39 | 129 | 30.6 | -3.1 | 3.73 | 0.34 | 10 | 1.3 | 1RXS J161451.3-502621 |
| MML 81 | 16183856-3839117 | F9IV | 9.02 | 0.32 | 108 | 30.3 | -3.8 | 3.78 | 0.33 | 20 | 1.2 | 1RXS J161839.0-383927 |
| MML 82 | 16211219-4030204 | G8IV | 10.57 | 0.69 | 156 | 30.5 | -3.3 | 3.74 | 0.23 | 13 | 1.3 | 1RXS J162112.0-403032 |
| MML 83 | 16232955-3958008 | G3IV | 10.64 | 0.95 | 169 | 30.4 | -3.4 | 3.76 | 0.11 | 26 | 1.1 | 1RXS J162330.1-395806 |
| MML 84 | 16273054-3749215 | G9.5IV | 10.96 | 0.50 | 180 | 30.5 | -3.3 | 3.73 | 0.21 | 11 | 1.3 | 1RXS J162730.0-374929 |
| HIP 80636 | 16275233-3547003 | G0.5IV | 9.37 | 0.39 | 152 | 30.9 | -3.3 | 3.77 | 0.65 | 10 | 1.4 | 1RXS J162752.8-354702 |
| MML 85 | 16314204-3505171 | G7.5IV | 10.64 | 0.33 | 143 | 30.4 | -3.3 | 3.74 | 0.05 | 22 | 1.1 | 1RXS J163143.7-350521 |
| MML 86 | 16353598-3326347 | K2-IV | 11.00 | 0.34 | 192 | 30.9 | -3.0 | 3.69 | 0.35 | 4 | 1.5 | 1RXS J163533.9-332631 |
| HIP 81380 | 16371286-3900381 | G0IV | 9.82 | 0.33 | 200 | 30.1 | -3.8 | 3.78 | 0.74 | 5 | 1.7 | 1RXS J163713.7-390104 |
| HIP 81447 | 16380553-3401106 | G0.5IV | 9.08 | 0.03 | 172 | 30.0 | -4.3 | 3.78 | 0.78 | 5 | 1.7 | 1RXS J163805.3-340110 |
| MML 87 | 16395929-3924592 | G4IV | 10.59 | 0.27 | 216 | 30.7 | -3.3 | 3.76 | 0.74 | 5 | 1.7 | 1RXS J163958.7-392457 |
| MML 88 | 16422399-4003296 | G1IV | 9.62 | 0.74 | 199 | 30.7 | -3.7 | 3.77 | 0.92 | 4 | 1.9 | 1RXS J164224.5-400329 |
| HD 151868 | 16514560-3803088 | F6V | 9.37 | 0.00 | 192 | 30.3 | -4.0 | 3.80 | 0.60 | 15 | 1.4 | … |
| HIP 82569 | 16524171-3845372 | F3V | 8.85 | 0.13 | 185 | 30.5 | -3.9 | 3.84 | 0.82 | 12 | 1.5 | 1RXS J165242.7-384534 |
| HIP 82747 | 16544485-3653185 | F5IVe | 9.21 | 0.52 | 144 | 30.0 | -4.3 | 3.81 | 0.76 | 15 | 1.4 | … |
| HIP 83159 | 16594248-3726168 | F5V | 9.02 | 0.00 | 152 | 29.9 | -4.3 | 3.82 | 0.54 | 19 | 1.4 | 1RXS J165943.1-372614 |
| Name | 2MASS J | SpT | AV | Dist | log | log | log | log | age | X-ray | ||
|---|---|---|---|---|---|---|---|---|---|---|---|---|
| [mag] | [mag] | [pc] | [erg/s] | [K] | [Myr] | [] | counterpart | |||||
| SACY 606 | 10065573-6352086 | K0V(e) | 11.05 | 0.71 | 173 | 30.5 | -3.4 | 3.720 | 0.31 | 6 | 1.6 | 1RXS J100659.0-635212 |
| SACY 653 | 10494839-6446284 | G9Ve | 11.73 | 0.21 | 195 | 30.5 | -3.2 | 3.733 | 0.09 | 17 | 1.2 | 1RXS J104949.5-644613 |
| MML 1 | 10574936-6913599 | K1+IV | 10.39 | 0.35 | 102 | 30.3 | -3.3 | 3.699 | 0.02 | 11 | 1.2 | 1RXS J105751.2-691402 |
| SACY 671 | 11080791-6341469 | M0Ve | 11.86 | 0.00 | 113 | 30.0 | -3.2 | 3.585 | -0.34 | 3 | 0.7 | 1RXS J110808.9-634125 |
| HIP 55334 | 11195276-7037065 | F2V | 8.14 | 0.24 | 87 | 29.8 | -4.3 | 3.838 | 0.60 | 27 | 1.4 | 1RXS J111948.2-703711 |
| TWA 12 | 11210549-3845163 | M2e | 13.6: | 0.45 | 109 | 30.1 | -3.4 | 3.550 | -0.39 | 2 | 0.6 | 1RXS J112105.2-384529 |
| SACY 681 | 11275535-6626046 | K1V(e) | 10.82 | 0.57 | 109 | 30.3 | -3.2 | 3.706 | -0.06 | 16 | 1.1 | 1RXS J112755.0-662558 |
| MML 2 | 11320835-5803199 | G7IV | 9.92 | 0.68 | 93 | 29.9 | -3.7 | 3.747 | 0.19 | 17 | 1.2 | 1RXS J113209.3-580319 |
| SACY 684 | 11350376-4850219 | G7V | 10.28 | 0.00 | 153 | 30.5 | -3.2 | 3.751 | 0.06 | 25 | 1.1 | 1RXS J113501.5-485011 |
| HIP 56673 | 11371464-6940272 | F5IV | 6.62 | 0.22 | 106 | 30.8 | -4.2 | 3.809 | 1.40 | 2 | 2.4 | 1RXS J113714.2-694025 |
| TWA 19B | 11472064-4953042 | K7e | 11.6: | 0.77 | 113 | 29.8 | -3.8 | 3.605 | -0.20 | 2 | 0.8 | … |
| HIP 57524 | 11472454-4953029 | F9IV | 9.07 | 0.30 | 113 | 30.8 | -3.3 | 3.783 | 0.44 | 17 | 1.3 | 1RXS J114724.3-495250 |
| SACY 695 | 11515049-6407278 | K1V | 11.99 | 0.33 | 174 | 30.3 | -3.1 | 3.706 | -0.19 | 24 | 1.0 | 1RXS J115149.1-640705 |
| HIP 57950 | 11530799-5643381 | F2IV/V | 8.26 | 0.17 | 99 | 29.9 | -4.3 | 3.838 | 0.64 | 18 | 1.4 | 1RXS J115308.5-564317 |
| SACY 699 | 11554295-5637314 | M0Ve | 11.69 | 0.00 | 87 | 30.3 | -2.8 | 3.585 | -0.55 | 7 | 0.7 | 1RXS J115544.5-563739 |
| HIP 58167 | 11554354-5410506 | F3IV | 8.30 | 0.06 | 103 | 29.7 | -4.5 | 3.829 | 0.63 | 15 | 1.4 | 1RXS J115543.4-541049 |
| SACY 700 | 11555771-5254008 | K4V | 11.00 | 0.01 | 109 | 29.9 | -3.5 | 3.662 | -0.26 | 13 | 1.1 | 1RXS J115554.5-525332 |
| SACY 706 | 11594608-6101132 | K4V(e) | 11.36 | 0.01 | 133 | 30.1 | -3.3 | 3.662 | -0.23 | 12 | 1.1 | 1RXS J115946.5-610111 |
| HIP 58528 | 12000940-5707021 | F5V | 8.54 | 0.05 | 100 | 29.5 | -4.6 | 3.809 | 0.51 | 17 | 1.3 | 1RXS J120009.5-570646 |
| SACY 708 | 12041439-6418516 | G8V | 9.93 | 0.00 | 135 | 30.8 | -3.0 | 3.742 | 0.16 | 17 | 1.2 | 1RXS J120413.3-641837 |
| MML 3 | 12044888-6409555 | G1IV | 9.41 | 0.60 | 120 | 30.8 | -3.2 | 3.773 | 0.44 | 15 | 1.3 | 1RXS J120448.2-640942 |
| HIP 58996 | 12054748-5100121 | G1IV | 8.89 | 0.14 | 102 | 30.5 | -3.6 | 3.772 | 0.43 | 15 | 1.3 | 1RXS J120547.8-510007 |
| MML 4 | 12061352-5702168 | G4IV | 10.69 | 1.45 | 154 | 30.6 | -3.1 | 3.760 | 0.15 | 23 | 1.1 | 1RXS J120613.9-570215 |
| SACY 713 | 12063292-4247508 | K0V | 10.66 | 0.31 | 86 | 29.9 | -3.4 | 3.720 | -0.30 | 42 | 0.9 | 1RXS J120632.7-424750 |
| SACY 715 | 12074236-6227282 | K3Ve | 10.90 | 0.41 | 120 | 30.3 | -3.4 | 3.675 | 0.06 | 6 | 1.3 | 1RXS J120741.4-622720 |
| MML 5 | 12094184-5854450 | K0IVe | 10.09 | 0.28 | 111 | 30.5 | -3.2 | 3.720 | 0.20 | 12 | 1.2 | 1RXS J120941.5-585440 |
| MML 6 | 12113142-5816533 | G9IV | 10.19 | 0.28 | 108 | 30.5 | -3.2 | 3.729 | 0.05 | 18 | 1.1 | 1RXS J121131.9-581651 |
| MML 7 | 12113815-7110360 | G3.5IV | 9.15 | 0.48 | 99 | 30.5 | -3.5 | 3.762 | 0.39 | 14 | 1.3 | 1RXS J121137.3-711032 |
| SACY 724 | 12120804-6554549 | K3Ve | 11.25 | 0.53 | 102 | 30.0 | -3.4 | 3.675 | -0.23 | 15 | 1.1 | 1RXS J121206.3-655456 |
| SACY 725 | 12121119-4950081 | K2Ve | 11.37 | 0.58 | 113 | 30.1 | -3.3 | 3.690 | -0.24 | 21 | 1.0 | 1RXS J121210.7-494955 |
| MML 8 | 12123577-5520273 | K0+IV | 10.48 | 0.48 | 108 | 30.3 | -3.2 | 3.717 | 0.00 | 17 | 1.1 | 1RXS J121236.4-552037 |
| SACY 727 | 12124890-6230317 | K7Ve | 11.47 | 0.43 | 101 | 30.7 | -2.6 | 3.609 | -0.31 | 4 | 0.8 | 1RXS J121248.7-623027 |
| HIP 59603 | 12132235-5653356 | F2V | 8.56 | 0.31 | 115 | 29.8 | -4.5 | 3.838 | 0.71 | 14 | 1.5 | 1RXS J121321.6-565323 |
| SACY 728 | 12135700-6255129 | K4Ve | 11.58 | 0.38 | 122 | 30.4 | -3.0 | 3.662 | -0.17 | 9 | 1.1 | 1RXS J121356.3-625508 |
| MML 9 | 12143410-5110124 | G9IV | 10.28 | 0.0: | 106 | 30.4 | -3.2 | 3.733 | 0.01 | 21 | 1.0 | 1RXS J121434.2-511004 |
| HIP 59716 | 12145071-5547235 | F5V | 8.45 | 0.11 | 104 | 30.9 | -3.3 | 3.809 | 0.60 | 15 | 1.4 | 1RXS J121452.4-554704 |
| MML 10 | 12145229-5547037 | G6IV | 9.64 | 0.87 | 103 | 30.9 | -2.9 | 3.750 | 0.28 | 14 | 1.2 | 1RXS J121452.4-554704 |
| HIP 59764 | 12151855-6325301 | F8/G0V: | 8.43 | 0.25 | 109 | 30.8 | -3.5 | 3.786 | 0.72 | 10 | 1.5 | 1RXS J121518.6-632517 |
| HIP 59781 | 12152822-6232207 | F8/G0V | 9.12 | 0.30 | 102 | 29.9 | -4.1 | 3.786 | 0.40 | 19 | 1.2 | 1RXS J121529.1-623209 |
| SACY 738 | 12160114-5614068 | K5Ve | 11.22 | 0.64 | 91 | 30.3 | -3.0 | 3.638 | -0.29 | 8 | 1.0 | 1RXS J121601.8-561405 |
| HIP 59854 | 12162783-5008356 | G1IV | 9.34 | 0.37 | 130 | 30.9 | -3.2 | 3.772 | 0.49 | 13 | 1.4 | 1RXS J121627.9-500829 |
| SACY 740 | 12163007-6711477 | K4IVe | 11.56 | 0.58 | 107 | 30.3 | -3.2 | 3.662 | -0.08 | 7 | 1.2 | 1RXS J121630.6-671146 |
| MML 11 | 12182762-5943128 | K1.5IVe | 10.73 | 0.12 | 96 | 30.3 | -3.1 | 3.695 | 0.03 | 10 | 1.2 | 1RXS J121828.6-594307 |
| MML 12 | 12185802-5737191 | G9.5IV | 9.87 | 0.49 | 106 | 30.6 | -3.2 | 3.724 | 0.32 | 10 | 1.3 | 1RXS J121858.2-573713 |
| MML 13 | 12192161-6454101 | K1-IV | 10.11 | 0.25 | 103 | 30.5 | -3.2 | 3.707 | 0.26 | 8 | 1.3 | 1RXS J121919.4-645406 |
| HIP 60205 | 12204420-5215249 | F5 | 10.06 | 0.19 | 147 | 29.8 | -4.0 | 3.809 | 0.28 | … | 1.4: | 1RXS J122047.8-521509 |
| SACY 750 | 12205449-6457242 | K4Ve | 11.00 | 0.00 | 94 | 29.9 | -3.4 | 3.662 | -0.22 | 11 | 1.1 | 1RXS J122050.8-645724 |
| SACY 751 | 12210808-5212226 | K4Ve | 11.85 | 0.40 | 106 | 30.0 | -3.2 | 3.662 | -0.41 | 22 | 0.9 | 1RXS J122108.0-521217 |
| MML 14 | 12211648-5317450 | G1.5IV | 9.34 | 0.44 | 107 | 30.7 | -3.3 | 3.770 | 0.31 | 18 | 1.2 | 1RXS J122116.7-531747 |
| MML 15 | 12215566-4946125 | G5.5IV | 10.02 | 0.14 | 102 | 30.2 | -3.4 | 3.754 | 0.08 | 25 | 1.1 | 1RXS J122155.9-494609 |
| MML 16 | 12220430-4841248 | K0IVe | 10.50 | 0.21 | 126 | 30.4 | -3.2 | 3.721 | 0.10 | 13 | 1.2 | 1RXS J122204.0-484118 |
| HIP 60348 | 12222484-5101343 | F5V | 8.80 | 0.06 | 104 | 29.8 | -4.2 | 3.809 | 0.44 | 19 | 1.3 | 1RXS J122226.1-510120 |
| MML 17 | 12223322-5333489 | G0IV | 9.42 | 0.41 | 124 | 30.3 | -3.7 | 3.778 | 0.41 | 17 | 1.3 | 1RXS J122233.4-533347 |
| MML 18 | 12234012-5616325 | K0+IV | 10.85 | 0.44 | 112 | 30.0 | -3.4 | 3.715 | -0.09 | 21 | 1.1 | 1RXS J122339.9-561628 |
| SACY 759 | 12242065-5443540 | G5V | 10.37 | 1.14 | 145 | 30.7 | -3.5 | 3.761 | 0.56 | 7 | 1.8 | 1RXS J122421.0-544343 |
| HIP 60567 | 12245491-5200157 | F6/F7V | 9.77 | 0.19 | 136 | 30.1 | -3.8 | 3.801 | 0.34 | 23 | 1.3 | 1RXS J122452.5-520014 |
| SACY 762 | 12264842-5215070 | K5Ve | 11.66 | 0.47 | 92 | 29.9 | -3.2 | 3.638 | -0.42 | 14 | 1.0 | 1RXS J122648.5-521453 |
| SACY 764 | 12282540-6320589 | G7V | 9.25 | 0.32 | 109 | 30.5 | -3.5 | 3.751 | 0.41 | 9 | 1.5 | 1RXS J122823.4-632100 |
| HIP 60885 | 12284005-5527193 | G0IV | 8.89 | 0.16 | 105 | 30.3 | -3.8 | 3.778 | 0.46 | 15 | 1.3 | 1RXS J122840.3-552707 |
| HIP 60913 | 12290224-6455006 | G4.5IV | 9.04 | 0.21 | 102 | 29.6 | -4.4 | 3.758 | 0.43 | 12 | 1.3 | 1RXS J122858.3-645448 |
| SACY 766 | 12302957-5222269 | K3V(e) | 12.04 | 0.85 | 103 | 29.9 | -3.3 | 3.675 | -0.41 | 28 | 0.9 | 1RXS J123031.1-522221 |
| SACY 768 | 12333381-5714066 | K1V(e) | 10.92 | 0.69 | 92 | 29.9 | -3.5 | 3.706 | -0.16 | 22 | 1.0 | 1RXS J123332.4-571345 |
| SACY 769 | 12361767-5042421 | K4Ve | 11.39 | 0.00 | 105 | 29.9 | -3.3 | 3.662 | -0.45 | 25 | 0.9 | 1RXS J123620.3-504238 |
| MML 19 | 12363895-6344436 | K0+III | 9.87 | 0.39 | 103 | 30.4 | -3.4 | 3.717 | 0.25 | 10 | 1.3 | 1RXS J123637.5-634446 |
| MML 20 | 12365895-5412178 | K0IV | 10.40 | 0.11 | 116 | 30.3 | -3.4 | 3.721 | 0.04 | 16 | 1.2 | 1RXS J123657.4-541217 |
| SACY 773 | 12383556-5916438 | K3Ve | 11.62 | 0.55 | 87 | 29.9 | -3.2 | 3.675 | -0.50 | 38 | 0.8 | 1RXS J123834.9-591645 |
| MML 21 | 12393796-5731406 | G7.5IV | 10.12 | 0.30 | 98 | 30.4 | -3.1 | 3.742 | -0.06 | 30 | 1.0 | 1RXS J123938.4-573141 |
| SACY 779 | 12404664-5211046 | K2V(e) | 11.91 | 0.34 | 135 | 30.1 | -3.2 | 3.690 | -0.26 | 23 | 1.0 | 1RXS J124046.9-521108 |
| MML 22 | 12411820-5825558 | G1.5IV | 9.93 | 0.67 | 97 | 30.2 | -3.4 | 3.771 | 0.14 | 26 | 1.1 | 1RXS J124118.5-582556 |
| SACY 782 | 12442412-5855216 | K2Ve | 10.26 | 0.48 | 106 | 30.3 | -3.4 | 3.690 | 0.15 | 6 | 1.4 | 1RXS J124423.9-585428 |
| HIP 62171 | 12442659-5420480 | F3V | 8.90 | 0.25 | 113 | 29.6 | -4.6 | 3.829 | 0.54 | 26 | 1.4 | 1RXS J124427.5-542043 |
| MML 23 | 12443482-6331463 | K1IVe | 10.78 | 0.27 | 125 | 30.6 | -3.0 | 3.704 | 0.25 | 8 | 1.3 | 1RXS J124432.6-633139 |
| MML 24 | 12450674-4742580 | G8.5IV | 10.40 | 0.38 | 120 | 30.6 | -3.1 | 3.738 | 0.13 | 17 | 1.2 | 1RXS J124506.9-474254 |
| SACY 787 | 12454884-5410583 | K2V(e) | 11.40 | 0.60 | 129 | 30.2 | -3.4 | 3.690 | -0.04 | 11 | 1.2 | 1RXS J124547.1-541104 |
| PF96 1 | 12464097-5931429 | M3e | 13.9: | 0.13 | 110: | 30.0 | -2.8 | 3.532 | -0.85 | 4 | 0.4 | 1WGA J1246.6-5931 |
| HIP 62427 | 12473870-5824567 | F8 | 9.28 | 0.00 | 134 | 30.5 | -3.5 | 3.792 | 0.39 | 19 | 1.3 | 1RXS J124742.1-582544 |
| HIP 62431 | 12474180-5825558 | F0 | 8.02 | 0.34 | 140 | 30.5 | -4.2 | 3.857 | 1.10 | 5 | 1.9 | 1RXS J124742.1-582544 |
| SACY 789 | 12474824-5431308 | M0Ve | 11.78 | 0.03 | 96 | 30.2 | -3.1 | 3.585 | -0.26 | 2 | 0.7 | 1RXS J124747.8-543141 |
| HIP 62445 | 12475186-5126382 | G4.5IVe | 9.52 | 0.66 | 130 | 30.7 | -3.4 | 3.758 | 0.62 | 5 | 1.7 | 1RXS J124751.7-512638 |
| MML 25 | 12480778-4439167 | G6IVe | 9.73 | 0.18 | 91 | 30.6 | -3.1 | 3.751 | 0.14 | 20 | 1.1 | 1RXS J124807.6-443913 |
| PF96 3A | 12483152-5944493 | K5e | 11.5: | 0.63 | 110: | 29.9: | -3.5: | 3.644 | -0.10 | 5 | 1.1 | 1WGA J1248.5-5944 |
| PF96 3B | 12483152-5944493 | K5e | 11.5: | 0.63 | 110: | 29.9: | -3.5: | 3.644 | -0.10 | 5 | 1.1 | 1WGA J1248.5-5944 |
| MML 26 | 12484818-5635378 | G5IV | 10.22 | 0.53 | 132 | 30.4 | -3.4 | 3.755 | 0.14 | 22 | 1.1 | 1RXS J124847.4-563525 |
| PF96 4 | 12485496-5949476 | M4e | 12.7: | 0.07 | 110: | 29.8 | -2.9 | 3.517 | -0.92 | 3 | 0.3 | 1WGA J1248.9-5949 |
| PF96 6 | 12492437-5913112 | M1e | 12.8: | 0.10 | 110: | 29.8 | -3.2 | 3.564 | -0.60 | 5 | 0.6 | 1WGA J1249.3-5913 |
| HIP 62657 | 12501971-4951488 | F5/F6V | 8.91 | 0.09 | 107 | 29.7 | -4.3 | 3.806 | 0.43 | 19 | 1.3 | 1RXS J125020.5-495144 |
| SACY 797 | 12505143-5156353 | K5Ve | 11.67 | 0.33 | 109 | 29.9 | -3.4 | 3.638 | -0.33 | 10 | 1.0 | 1RXS J125051.3-515655 |
| SACY 799 | 12560830-6926539 | K7Ve | 11.80 | 0.62 | 118 | 30.8 | -2.7 | 3.609 | -0.05 | 2 | 0.8 | 1RXS J125608.8-692652 |
| SACY 800 | 12560940-6127256 | K0Ve | 9.62 | 0.27 | 75 | 30.7 | -3.0 | 3.720 | 0.05 | 15 | 1.2 | 1RXS J125609.4-612724 |
| HIP 63272 | 12575777-5236546 | F3IV/V | 8.40 | 0.00 | 113 | 29.6 | -4.6 | 3.829 | 0.63 | 15 | 1.4 | 1RXS J125757.2-523659 |
| MML 27 | 12582559-7028490 | K0+IV | 9.91 | 0.46 | 85 | 30.3 | -3.3 | 3.714 | -0.01 | 16 | 1.1 | 1RXS J125824.6-702848 |
| MML 28 | 13015069-5304581 | K2-IV | 11.08 | 0.55 | 108 | 30.0 | -3.3 | 3.690 | -0.37 | 32 | 0.9 | 1RXS J130153.7-530446 |
| MML 29 | 13023752-5459370 | G1IV | 10.28 | 0.38 | 156 | 30.8 | -3.1 | 3.772 | 0.35 | 18 | 1.2 | 1RXS J130237.2-545933 |
| HIP 63847 | 13050530-6413552 | G3IV | 9.18 | 0.33 | 98 | 30.4 | -3.5 | 3.764 | 0.36 | 15 | 1.3 | 2RXP J130506.7-641346 |
| HD 113703B | 13061785-4827456 | K0Ve | 10.8: | 0.00 | 118 | 30.5 | -2.9 | 3.717 | -0.05 | 19 | 1.1 | 1RXS J130618.4-482744 |
| HIP 63975 | 13063577-4602018 | F3/F5V | 8.08 | 0.00 | 111 | 29.4 | -4.8 | 3.819 | 0.70 | 12 | 1.4 | 1RXS J130630.7-460215 |
| MML 30 | 13064012-5159386 | K0IVe | 10.53 | 0.17 | 112 | 30.2 | -3.4 | 3.722 | -0.05 | 21 | 1.1 | 1RXS J130638.5-515948 |
| SACY 808 | 13065439-4541313 | K5Ve | 12.03 | 0.53 | 124 | 30.2 | -3.1 | 3.638 | -0.28 | 8 | 1.0 | 1RXS J130655.0-454125 |
| HD 113791B | 13065720-4954265 | F7V | 10.90 | 0.03 | 145 | 29.9 | -3.5 | 3.798 | 0.49 | 17 | 1.3 | 1RXS J130659.7-495405 |
| HIP 64044 | 13073350-5254198 | F5V | 8.83 | 0.27 | 111 | 30.3 | -3.8 | 3.809 | 0.57 | 16 | 1.4 | 1RXS J130733.2-525421 |
| SACY 814 | 13130714-4537438 | K5Ve | 11.63 | 0.52 | 101 | 29.9 | -3.4 | 3.638 | -0.23 | 6 | 1.1 | 1RXS J131306.7-453740 |
| SACY 815 | 13132810-6000445 | G3V | 10.01 | 0.20 | 157 | 30.6 | -3.4 | 3.766 | 0.40 | 14 | 1.3 | 1RXS J131327.3-600032 |
| MML 31 | 13142382-5054018 | G5.5IV | 10.39 | 0.27 | 130 | 30.8 | -2.9 | 3.754 | 0.25 | 16 | 1.2 | 1RXS J131424.3-505402 |
| MML 32 | 13175694-5317562 | G1IV | 10.41 | 0.22 | 167 | 30.7 | -3.2 | 3.774 | 0.43 | 15 | 1.3 | 1RXS J131754.9-531758 |
| TWA 17 | 13204539-4611377 | K7e | 13.1: | 0.67 | 142 | 30.2 | -3.0 | 3.635 | -0.38 | 11 | 1.0 | 1RXS J132046.5-461139 |
| TWA 18 | 13213722-4421518 | M0.5e | 13.7: | 0.16 | 119 | 30.0 | -2.9 | 3.574 | -0.63 | 6 | 0.6 | 1RXS J132137.0-442133 |
| MML 33 | 13220446-4503231 | G0IV | 10.02 | 0.22 | 140 | 30.3 | -3.6 | 3.779 | 0.18 | 25 | 1.1 | 1RXS J132204.7-450312 |
| MML 34 | 13220753-6938121 | K1IVe | 10.44 | 0.17 | 86 | 30.2 | -3.2 | 3.702 | 0.00 | 13 | 1.2 | 1RXS J132207.2-693812 |
| SACY 822 | 13233587-4718467 | K3Ve | 11.19 | 1.23 | 111 | 30.0 | -3.6 | 3.733 | 0.06 | 19 | 1.1 | 1RXS J132336.3-471844 |
| HIP 65517 | 13254783-4814577 | G1.5IV | 9.76 | 0.14 | 95 | 30.4 | -3.3 | 3.770 | 0.02 | 35 | 1.1 | 1RXS J132548.2-481451 |
| SACY 828 | 13270594-4856180 | K3Ve | 10.68 | 0.51 | 104 | 30.4 | -3.2 | 3.675 | 0.01 | 7 | 1.3 | 1RXS J132706.3-485617 |
| HIP 66001 | 13315360-5113330 | G2.5IV | 9.84 | 0.11 | 127 | 30.6 | -3.2 | 3.766 | 0.33 | 17 | 1.2 | 1RXS J133152.6-511335 |
| MML 35 | 13342026-5240360 | G1IV | 9.29 | 0.45 | 105 | 30.5 | -3.4 | 3.774 | 0.32 | 19 | 1.2 | 1RXS J133420.0-524032 |
| SACY 835 | 13343188-4209305 | K2IVe | 9.64 | 0.49 | 91 | 30.2 | -3.2 | 3.690 | -0.15 | 16 | 1.1 | 1RXS J133432.2-420929 |
| SACY 841 | 13402554-4633514 | K3Ve | 11.37 | 0.68 | 143 | 30.8 | -2.9 | 3.675 | 0.08 | 5 | 1.4 | 1RXS J134025.6-463323 |
| HIP 66941 | 13430870-6907393 | G0.5IV | 7.57 | 0.38 | 107 | 31.1 | -3.5 | 3.775 | 1.09 | 4 | 2.0 | 1RXS J134306.8-690754 |
| MML 37 | 13432853-5436434 | G2IV | 9.32 | 0.28 | 85 | 30.6 | -3.2 | 3.769 | 0.13 | 26 | 1.1 | 1RXS J134332.7-543638 |
| SACY 848 | 13444279-6347495 | K4Ve | 11.04 | 0.50 | 84 | 30.2 | -3.2 | 3.662 | -0.24 | 12 | 1.1 | 1RXS J134442.5-634758 |
| SACY 849 | 13455599-5222255 | K3Ve | 11.34 | 0.49 | 121 | 30.4 | -3.1 | 3.675 | -0.13 | 11 | 1.2 | 1RXS J134555.2-522215 |
| SACY 857 | 13540743-6733449 | G6V | 10.93 | 0.56 | 142 | 30.2 | -3.4 | 3.756 | 0.05 | 27 | 1.1 | 1RXS J135404.0-673334 |
| MML 42 | 14160567-6917359 | G1IV | 10.14 | 0.62 | 123 | 30.1 | -3.7 | 3.773 | 0.19 | 24 | 1.1 | 1RXS J141605.3-691756 |
References
- Abt et al. (1990) Abt, H.A., Gomez, A.E. & Levy, S.G. 1990, ApJS, 74, 551
- Acke & van den Ancker (2006) Acke, B. & van den Ancker, M. E. 2006, A&A, 449, 267
- Alcalá et al. (2002) Alcalá, J. M., Covino, E., Melo, C., & Sterzik, M. F. 2002, A&A, 384, 521
- Alencar et al. (2003) Alencar, S. H. P., et al. 2003, A&A, 409, 1037
- Allen et al. (2003) Allen, P. R., Trilling, D. E., Koerner, D. W., & Reid, I. N. 2003, ApJ, 595, 1222
- Ambartsumian (1947) Ambartsumian V. A. 1947, in Stellar Evolution and Astrophysics, Armenian Acad. of Sci. (German translation, 1951, Abhandl. Sowjetischen Astron., 1, 33.)
- Andersen et al. (1989) Andersen, J., Lindgren, H., Hazen, M. L., & Mayor, M. 1989, A&A, 219, 142
- Andersen et al. (1993) Andersen, J., Clausen, J. V., & Gimenez, A. 1993, A&A, 277, 439
- Ardila, Martín, & Basri (2000) Ardila, D., Martín, E., & Basri, G. 2000, AJ, 120, 479
- Argiroffi et al. (2006) Argiroffi, C., Favata, F., Flaccomio, E., Maggio, A., Micela, G., Peres, G., & Sciortino, S. 2006, A&A, 459, 199
- Ballesteros-Paredes & Hartmann (2007) Ballesteros-Paredes, J., & Hartmann, L. 2007, Rev. Mex. Astron. Astrofis., 43, 123
- Bally et al. (1998) Bally, J., Sutherland, R.S., Devine, D., Johnstone, D. 1998, AJ, 116, 293
- Baraffe et al. (1998) Baraffe, I., Chabrier, G., Allard, F., & Hauschildt, P.H. 1998, A&A, 337, 403
- Bertelli et al. (1994) Bertelli, G., Bressan, A., Chiosi, C., Fagotto, F., & Nasi, E. 1994, A&AS, 106, 275
- Bertiau (1958) Bertiau, F. C. 1958, ApJ, 128, 533
- Blaauw (1946) Blaauw, A. 1946, Publ. of the Kapteyn Astron. Lab. at Groningen, 52 (Ph.D. Thesis)
- Blaauw (1952) Blaauw, A. 1952, Bull. Astr. Inst. Neth., 11, 414
- Blaauw (1961) Blaauw, A. 1961, Bull. Astr. Inst. Neth., 15, 265
- Blaauw (1964) Blaauw, A. 1964, IAU Symp. 20: The Galaxy and the Magellanic Clouds, ed. F.J. Kerr, 50
- Blaauw (1991) Blaauw, A., 1991, in The Physics of Star Formation and Early Stellar Evolution, eds. C.J. Lada C.J. & N.D. Kylafis, NATO ASI Vol. 342, 125
- Boss (1910) Boss, L. 1910, Washington, D.C.: Carnegie Institution
- Boss (1995) Boss, A.P. 1995, ApJ, 439, 224
- Bouy et al. (2006) Bouy, H., Martin, E.L., Brandner, W., et al. 2006, A&A, 451, 177
- Bressan et al. (1993) Bressan, A., Fagotto, F., Bertelli, G., & Chiosi, C. 1993, A&AS, 100, 647
- Brandl et al. (1999) Brandl B., Brandner, W., Eisenhauer, F., Moffat, A.F.J., Palla, F., Zinnecker, H. 1999, A&A, 352, L69
- Brandner & Köhler (1998) Brandner, W. & Köhler, R. 1998, ApJ, 499, L79
- Brandner et al. (2001) Brandner, W., Grebel, E.K., Barba, R.H., Walborn, N.R., Moneti, A. 2001, AJ, 122, 558
- Briceno et al. (2007) Briceno C., Preibisch, Th., Sherry, W., Mamajek, E., Mathieu, R., Walter, F., Zinnecker, H., 2007, in Protostars & Planets V, eds. B. Reipurth, D. Jewitt, & K. Keil, University of Arizona Press, Tucson, p. 345
- Brown (1998) Brown, A.G.A., 1998, in ASP Conf Ser. Vol. 142, The Stellar Initial Mass Function, eds. G. Gilmore & D. Howell, 45
- Brown (2001) Brown, A.G.A. 2001, Astron. Nachr., 322, 43
- de Bruijne (1999) De Bruijne, J.H.J. 1999, MNRAS, 310, 585
- Cannon & Pickering (1901) Cannon, A. J., & Pickering, E. C. 1901, Annals of Harvard College Observatory, 28, 129
- Cannon et al. (2005) Cannon, J.M., Walter, F., & Bendo, G.J. 2005, ApJ, 630, L37
- Carpenter, Heyer, & Snell (2000) Carpenter, J.M., Heyer, M.H., & Snell, R.L 2000, ApJS, 130, 381
- Carpenter et al. (2006) Carpenter, J. M., Mamajek, E. E., Hillenbrand, L. A., & Meyer, M. R. 2006, ApJ, 651, L49
- Catchpole (1971) Catchpole, R. M. 1971, MNRAS, 154, 15P
- Chabrier & Baraffe (1997) Chabrier, G. & Baraffe, I. 1997, A&A, 327, 1039
- Chatterjee et al. (2004) Chatterjee, S., Cordes, J.M., Vlemmings, W.H.T., Arzoumanian, Z., Goss, W.M., & Lazio, T.J.W. 2004, ApJ, 604, 339
- Chen et al. (2006) Chen, X. P., Henning, T., van Boekel, R., & Grady, C. A. 2006, A&A, 445, 331
- Chen et al. (2005) Chen, C.H., Jura, M., Gordon, K.D., & Blaylock, M. 2005, ApJ, 623, 493
- Claret & Gimenez (1992) Claret, A. & Gimenez, A. 1992, A&AS, 96, 255
- Clark et al. (2005) Clark, P.C., Bonnell, I.A., Zinnecker, H., & Bate, M.R. 2005, MNRAS, 359, 809
- Cohen & Kuki (1979) Cohen M. & Kuhi L.V. 1979, ApJS, 41, 743
- Colless et al. (2001) Colless, M., Dalton, G., Maddox, S., et al. 2001, MNRAS, 329, 87
- Collinder (1931) Collinder, P. 1931, Ann. Obs. Lund, 2, 1
- Costado et al. (2005) Costado, M.T., Bejar, V.J.S., Caballero, J.A, et al. 2005, A&A, 443, 1021
- D’Antona & Mazzitelli (1994) D’Antona, F. & Mazzitelli, I. 1994, A&AS 90, 467
- D’Antona & Mazzitelli (1997) D’Antona, F. & Mazzitelli, I. 1997, Mem. Soc. Astr. Ital., 68, 807
- Dolan & Mathieu (2001) Dolan, C.J. & Mathieu, R.D. 2001, AJ, 121, 2124
- Dolan & Mathieu (2002) Dolan, C.J. & Mathieu, R.D. 2002, AJ, 123, 387
- Duquennoy & Mayor (1991) Duquennoy, A. & Mayor, M., 1991 A&A, 248, 485
- Eggen (1998) Eggen, O. J. 1998, AJ, 116, 1314
- Elmegreen (1998) Elmegreen, B.G. 1998, in ASP Conf. Ser. 148: Origins, eds. C.E. Woodward, J.M. Shull, H.A. Thronson, p. 150
- Elmegreen (2000) Elmegreen, B. G. 2000, ApJ, 530, 277
- Elmegreen (2007) Elmegreen, B. G. 2007, ApJ, 668, 1064
- Elmegreen et al. (2000) Elmegreen, B. G., Efremov, Y., Pudritz, R. E., & Zinnecker, H. 2000, in Protostars and Planets IV, eds. V. Mannings, A.P. Boss, S.S. Russell, University of Arizona Press, Tucson, p. 179
- Efremov & Elmegreen (1998) Efremov, Y.N. & Elmegreen, B.G. 1998, MNRAS, 299, 643
- Feigelson & Lawson (1997) Feigelson, E. D. & Lawson, W. A. 1997, AJ, 113, 2130
- Fernandez et al. (2008) Fernandez, D., Figueras, F., & Torra, J., 2008, A&A, 480, 735
- Fischer & Marcy (1992) Fischer, D.A. & Marcy G.W. 1992, ApJ, 396, 178
- Foster & Boss (1996) Foster, P.N. & Boss, A.P. 1996, ApJ, 468, 784
- Foster & Boss (1997) Foster, P.N. & Boss, A.P. 1997, ApJ, 489, 346
- Fukuda & Hanawa (2000) Fukuda, N. & Hanawa, T. 2000, ApJ, 533, 911
- de Geus (1992) De Geus, E.J. 1992, A&A, 262, 258
- de Geus, de Zeeuw, & Lub (1989) De Geus, E.J., de Zeeuw, P.T. & Lub, J. 1989, A&A, 216, 44
- Giannuzzi (1983) Giannuzzi, M. A. 1983, Ap&SS, 89, 355
- Girardi et al. (2000) Girardi, L., Bressan, A., Bertelli, G., & Chiosi, C. 2000, A&A, 141, 371
- Glaspey (1972) Glaspey, J. W. 1972, AJ, 77, 474
- Gorjian et al. (2004) Gorjian, V., Werner, M.W., & Mould, J.R. 2004, ApJS, 154, 275
- Gregorio-Hetem et al. (1992) Gregorio-Hetem, J., Lepine, J. R. D., Quast, G. R., Torres, C. A. O., & de La Reza, R. 1992, AJ, 103, 549
- Habart et al. (2006) Habart, E., Natta, A., Testi, L., & Carbillet, M. 2006, A&A, 449, 1067
- Hambly et al. (1998) Hambly, N.C., Miller, L., MacGillivray, H.T., Herd, J.T., & Cormack, W.A. 1998, MNRAS, 298, 897
- Hartmann et al. (2001) Hartmann, L., Ballesteros-Paredes, J., & Bergin, E. A. 2001, ApJ, 562, 852
- Hartmann (2003) Hartmann, L. 2003, ApJ, 585, 398
- Hester et al. (1996) Hester, J.J., Scowen, P.A., Sankrit, R., et al. 1996, AJ, 111, 2349
- Herbig (1962) Herbig, G.H. 1962, Adv. Astron. Astrophys., 1, 47
- Herbig & Bell (1988) Herbig, G.H., & Bell, K.R. 1988, Lick Observatory Bulletin No. 1111
- Hillenbrand & White (2004) Hillenbrand, L. A., & White, R. J. 2004, ApJ, 604, 741
- Hillenbrand et al. (2008) Hillenbrand, L.A., Bauermeister, A., White, R.J. 2008, Proceedings of Cool Stars, Stellar Systems, and the Sun 14, ed. G. van Belle, ASP Conf. Ser. Vol. 384, 200
- Hiltner et al. (1969) Hiltner, W. A., Garrison, R. F., & Schild, R. E. 1969, ApJ, 157, 313
- Høg et al. (1998) Høg, E., Kuzmin, A., Bastian, U., et al. 1998, A&A, 335, L65
- Høg et al. (2000) Høg, E., Fabricius, C., Makarov, V.V., et al. 2000, A&A, 355, L27
- Hoogerwerf (2000) Hoogerwerf, R. 2000, MNRAS, 313, 43
- Hoogerwerf et al. (2000) Hoogerwerf, R., de Bruijne, J.H.J., & de Zeeuw, P.T. 2000, ApJ, 544, L133
- Hoogerwerf et al. (2001) Hoogerwerf, R., de Bruijne, J.H.J., & de Zeeuw, P.T. 2001, A&A, 365, 49
- Huélamo et al. (2000) Huélamo, N., Neuhäuser, R., Stelzer, B., Supper, R., & Zinnecker, H. 2000, A&A, 359, 227
- Jensen et al. (2004) Jensen, E. L. N., Schlesinger, K. J., & Higby-Naquin, C. T. 2004, BAAS, 205, #15.04
- Jones (1971) Jones, D. H. P. 1971, MNRAS, 152, 231
- Kapteyn (1914) Kapteyn, J. C. 1914, ApJ, 40, 43
- Kenyon & Hartmann (1995) Kenyon, S.J. & Hartmann, L. 1995, ApJS, 101, 117
- Köhler et al. (2000) Köhler, R., Kunkel, M., Leinert, C., & Zinnecker, H. 2000, A&A, 356, 541
- Kouwenhoven et al. (2005) Kouwenhoven, M.B.N., Brown, A.G.A., Zinnecker, H., Kaper, L., & Portegies Zwart, S.F. 2005, A&A, 430, 137
- Kouwenhoven et al. (2007) Kouwenhoven, M. B. N., Brown, A. G. A., & Kaper, L. 2007, A&A, 464, 581
- Kraus et al. (2005) Kraus, A.L., White, R.J., & Hillenbrand, L.A. 2005, ApJ, 633, 452
- Krautter et al. (1997) Krautter, J., Wichmann, R., Schmitt, J. H. M. M., Alcala, J. M., Neuhäuser, R., & Terranegra, L. 1997, A&AS, 123, 329
- Kroupa et al. (2001) Kroupa, P., Aarseth, S., & Hurley, J. 2001, MNRAS, 321, 699
- Kroupa et al. (2002) Kroupa, P. 2002, Science, Vol. 295, No. 5552, p. 82
- Kuzmin et al. (1999) Kuzmin, A., Høg, E., Bastian, U., et al. 1999, A&AS, 136, 491
- Larson (1986) Larson, R.B. 1986, MNRAS, 218,409
- Lastennet & Valls-Gabaud (2002) Lastennet, E. & Valls-Gabaud, D. 2002, A&A, 396, 551
- Lawson & Crause (2005) Lawson, W. A. & Crause, L. A. 2005, MNRAS, 357, 1399
- Legett (1992) Legett, S.K. 1992, ApJS, 82, 351
- Leitherer (1998) Leitherer, C., 1998, in ASP Conf Ser. Vol. 142, The Stellar Initial Mass Function, eds. G. Gilmore, D. Howell, 61
- Lépine & Sartori (2003) Lépine, J., & Sartori, M. J. 2003, in Open Issues in Local Star Formation, eds. J. Lépine & J. Gregorio-Hetem, Kluwer Acad. Pub., Boston, 63
- Lesh (1972) Lesh, J. R. 1972, A&AS, 5, 129
- Lewis et al. (2002) Lewis, I.J., Cannon, R.D., & Taylor, K. et al., 2002, MNRAS, 333, 279
- Li et al. (2003) Li, Y., Klessen, R.S. & Mac Low, M.-M. 2003, ApJ, 592, 975
- Lindroos (1983) Lindroos, K. P. 1983, A&AS, 51, 161
- Lindroos (1986) Lindroos, K. P. 1986, A&A, 156, 223
- Liu et al. (2003) Liu, W. M., Hinz, P. M., Meyer, M. R., Mamajek, E. E., Hoffmann, W. F., & Hora, J. L. 2003, ApJ, 598, L111
- Luhman (2005) Luhman, K.L. 2005, ApJ, 633, L41
- Lodieu et al. (2006) Lodieu, N., Hambly, N.C., & Jameson, R.F. 2006, MNRAS, 373, 95
- Lodieu et al. (2007) Lodieu, N., Hambly, N. C., Jameson, R. F., Hodgkin, S. T., Carraro, G., & Kendall, T. R. 2007, MNRAS, 374, 372
- Madsen et al. (2002) Madsen, S., Dravins, D., & Lindegren, L. 2002, A&A, 381, 446
- Makarov (2007) Makarov, V.V. 2007, ApJ, 658, 480
- Makarov & Urban (2000) Makarov, V. V. & Urban, S. 2000, MNRAS, 317, 289
- Mamajek (2003) Mamajek, E. E. 2003, in Open Issues in Local Star Formation, Proceedings of the Ouro Preto Colloquium, eds. J. Lépine & J. Gregorio-Hetem, Kluwer Acad. Pub., Boston, 39
- Mamajek (2005) Mamajek, E. E. 2005, ApJ, 634, 1385
- Mamajek & Feigelson (2001) Mamajek, E. E. & Feigelson, E. D. 2001, in Young Stars Near Earth, eds. R. Jayawardhana & T. Greene, ASP Conf. Ser., 244, 104
- Mamajek, Lawson, & Feigelson (2000) Mamajek, E. E., Lawson, W. A., & Feigelson, E. D. 2000, ApJ, 544, 356
- Mamajek et al. (2002) Mamajek, E. E., Meyer, M. R., & Liebert, J. 2002, AJ, 124, 1670
- Martín (1998) Martín, E.L. 1998, AJ, 115, 351
- Martín et al. (1998) Martín, E.L., Montmerle, T., Gregorio-Hetem, J., & Casanova, S. 1998, MNRAS, 300, 733
- Martín, Delfosse, & Guieu (2004) Martín, E.L., Delfosse, X., & Guieu, S. 2004, AJ, 127, 449
- Mason, Gies, & Hartkopf (1998) Mason, B.D., Gies, D.R., Hartkopf, W.I., et al. 1998, AJ, 115, 821
- Meyer, Wilking, & Zinnecker (1993) Meyer, M.R., Wilking, B.A., Zinnecker, H., 1993, AJ, 105, 619
- Meynet & Maeder (2000) Meynet, G. & Maeder, A. 2000, A&A, 361, 101
- McCaughrean & Andersen (2002) McCaughrean, M.J. & Andersen, M. 2002, A&A, 389, 513
- Miller & Scalo (1978) Miller, G.E. & Scalo, J.M. 1978, PASP, 90, 506
- Miller & Scalo (1979) Miller, G.E. & Scalo, J.M. 1979, ApJS, 41, 513
- Mohanty et al. (2004) Mohanty, S., Basri, G., Jayawardhana, R., Allard, F., Hauschild, P., & Ardial, D. 2003, ApJ, 609, 854
- Mohanty, Jayawardhana, & Basri (2004) Mohanty, S., Jayawardhana, R., & Basri, G. 2003, ApJ, 609, 885
- Morgan et al. (1953) Morgan, W. W., Whitford, A. E., & Code, A. D. 1953, ApJ, 118, 318
- Motte, André, & Neri (1998) Motte, F., André, P., & Neri, R. 1998, A&A, 336, 150
- Oey & Massey (1995) Oey, M.S. & Massey, P. 1995, ApJ, 452, 210
- Oey et al. (2005) Oey, M.S., Watson, A.M., Kern, K., & Walth, G.L. 2005, AJ, 129, 393
- Palla & Randich (2005) Palla, F. & Randich, S. 2005, in IMF@50: The Initial Mass Function 50 Years Later, eds. E. Corbelli, F. Palla, & H. Zinnecker, Astrophysics and Space Science Library, Vol. 327, p. 73
- Palla & Stahler (1999) Palla, F. & Stahler, S.W. 1999, ApJ, 525, 772
- Palla & Stahler (2001) Palla, F. & Stahler, S. W. 2001, ApJ, 553, 299
- Pallavicini et al. (1992) Pallavicini, R., Pasquini, L., & Randich, S. 1992, A&A, 261, 245
- Park & Finley (1996) Park, S. & Finley, J. P. 1996, AJ, 112, 693
- Perryman et al. (1997) Perryman, M. A. C., Lindegren, L., Kovalevsky, J., et al. 1997, A&A, 323, L49
- Petrie (1962) Petrie, R. M. 1962, MNRAS, 123, 501
- Pols et al. (1997) Pols, O. R., Tout, C. A., Schroder, K.-P., Eggleton, P. P., & Manners, J. 1997, MNRAS, 289, 869
- Preibisch & Zinnecker (1999) Preibisch, Th. & Zinnecker, H. 1999, AJ, 117, 2381
- Preibisch & Zinnecker (2007) Preibisch, Th. & Zinnecker, H. 2007, in IAU Symposium 237: Triggered Star Formation in a Turbulent ISM, eds. B.G. Elmegreen & J. Palous, Cambridge University Press, p. 270
- Preibisch et al. (1998) Preibisch, Th., Guenther, E., Zinnecker, H., Sterzik, M., Frink, S., & Röser, S. 1998, A&A, 333, 619
- Preibisch et al. (1999) Preibisch, Th., Balega, Y., Hofmann, K.-H., Weigelt, G., & Zinnecker, H. 1999, New Astronomy, 4, 531
- Preibisch et al. (2001) Preibisch, Th., Guenther, E., & Zinnecker, H. 2001, AJ, 121, 1040
- Preibisch et al. (2002) Preibisch, Th., Brown, A.G.A., Bridges, T., Guenther, E., & Zinnecker, H. 2002, AJ, 124, 404
- Reach et al. (2004) Reach, W.T., Rho, J., Young, E., et al. 2004, ApJS, 154, 385
- Reiners et al. (2005) Reiners, A., Basri, G., & Mohanty, S. 2005, ApJ, 634, 1346
- Reipurth & Zinnecker (1993) Reipurth, B. & Zinnecker, H. 1993, A&A, 278, 81
- Richling & Yorke (1998) Richling, S. & Yorke, H.W. 1998, A&A, 340, 508
- Richling & Yorke (2000) Richling, S. & Yorke, H.W. 2000, ApJ, 539, 258
- Ruprecht, Balazs, & White (1982) Ruprecht, J., Balazs, B., & White, R. E. 1982, Bull. Inf. CDS 22, 132
- Ruprecht, Balazs, & White (1983) Ruprecht, J., Balazs, B., & White, R. E. 1983, Soviet Astronomy 27, 358
- Sabbi et al. (2008) Sabbi, E., Sirianni, M., Nota, A., et al. 2008, AJ, 135, 173
- Sartori et al. (2003) Sartori, M. J., Lépine, J. R. D., & Dias, W. S. 2003, A&A, 404, 913
- Scalo (1998) Scalo, J.M. 1998, in ASP Conference Series Vol. 142, The Stellar Intial Mass Function, eds. G. Gilmore & D. Howel, 201
- Schmidt–Kaler (1982) Schmidt–Kaler, Th. 1982, in Landolt–Börnstein New Series, Group VI, Vol. 2b, p. 1, eds K. Schaifers & H.H. Voigt (Springer–Verlag)
- Schneider et al. (1979) Schneider, D. P., Darland, J. J., & Leung, K.-C. 1979, AJ, 84, 236
- Sciortino et al. (1998) Sciortino, S., Damiani, F., Favata, F., & Micela, G. 1998, A&A, 332, 825
- Selman & Melnick (2005) Selman, F.J. & Melnick, J. 2005, A&A, 443, 851
- Shatsky et al. (2002) Shatsky, N. & Tokovinin, A. 2002, A&A, 382, 92
- Sherry et al. (2004) Sherry, W.H., Walter, F.M., & Wolk, S.J. 2004, AJ, 128, 2316
- Shu & Lizano (1988) Shu, F.H., Lizano, S., 1988, in Stellar Matter, eds. J.M. Moran & P.T.P. Ho, Gordon & Breach, 65
- Siess et al. (2000) Siess, L., Dufour, E., & Forestini, M. 2000, A&A, 358, 593
- Slesnick (2007) Slesnick, C. L. 2007, PASP, 119, 1205
- Slesnick et al. (2006) Slesnick, C.L., Carpenter, J.M., & Hillenbrand, L.A. 2006, AJ, 131, 3016
- Smart (1936) Smart, W. M. 1936, MNRAS, 96, 568
- Smart (1939) Smart, W. M. 1939, MNRAS, 100, 60
- Smith et al. (2001) Smith, L.J. & Gallagher, J.S. 2001, MNRAS, 326, 1027
- Slawson & Landstreet (1992) Slawson, R.W. & Landstreet, J.D. 1992, BAAS, 24, 824
- Stark & Brand (1989) Stark, A. A. & Brand, J. 1989, ApJ, 339, 763
- Sterzik & Durisen (1995) Sterzik, M. F. & Durisen, R. H. 1995, A&A, 304, L9
- Stickland et al. (1996) Stickland, D. J., Sahade, J., & Henrichs, H. 1996, The Observatory, 116, 85
- Stolte et al. (2005) Stolte, A., Brandner, W., Grebel, E.K., Lenzen, R., & Lagrange, A.-M. 2005, ApJ, 628, L113
- Tachihara (2001) Tachihara, K., Toyoda, S., Onishi, T., Mizuno, A., Fukui, Y., & Neuhäuser, R. 2001, PASJ, 53, 1081
- Thackeray (1966) Thackeray, A. D. 1966, MmRAS, 70, 33
- Throop & Bally (2005) Throop, H.B. & Bally, J. 2005, ApJ, 623, L149
- Torres et al. (2006) Torres, C. A. O., Quast, G. R., da Silva, L., de La Reza, R., Melo, C. H. F., & Sterzik, M. 2006, A&A, 460, 695
- Turon et al. (1992) Turon, C., Creze, M., Egret, D., et al. 1992, Hipparcos Input Catalogue, ESA SP–1136
- Urban et al. (1998) Urban, S.E., Corbin, T.E., & Wycoff, G.L. 1998, AJ, 115, 2161
- van den Ancker et al. (1998) van den Ancker, M. E., de Winter, D., & Tjin A Djie, H. R. E. 1998, A&A, 330, 145
- Vanhala & Cameron (1998) Vanhala, H.A.T & Cameron, A.G.W. 1998, ApJ, 508, 291
- Voges et al. (1999) Voges, W., Aschenbach, B., Boller, Th., et al. 1999, A&A, 349, 389
- Walborn et al. (1999) Walborn, N.R., Barba, R.H., Brandner, W., Rubio, M., Grebel, E.K., & Probst, R.G. 1999, AJ, 117, 225
- Walter et al. (1994) Walter, F.M., Vrba, F.J., Mathieu, R.D., Brown, A., & Myers, P.C. 1994, AJ, 107, 692
- Weaver (1979) Weaver, H. 1979, in IAU Symp. 84: The Large-Scale Characteristics of the Galaxy, 84, 295
- White et al. (1999) White, R.J., Ghez, A.M., Reid, I.N., & Schultz, G. 1999, ApJ, 520, 811
- Wichmann et al. (1997a) Wichmann, R., Krautter, J., Covino, E., Alcala, J. M., Neuhäuser, R., & Schmitt, J. H. M. M. 1997, A&A, 320, 185
- Wichmann et al. (1997b) Wichmann, R., Sterzik, M., Krautter, J., Metanomski, A., & Voges, W. 1997, A&A, 326, 211
- Whitworth & Zinnecker (2004) Whitworth, A.P. & Zinnecker, H. 2004, A&A, 427, 299
- Yamaguchi et al. (2001) Yamaguchi, R., Mizuno, N., Onishi, T., Mizuno, A., & Fukui, Y. 2001, ApJ, 553, L185
- Yorke et al. (1989) Yorke, H.W., Tenorio-Tagle, G., Bodenheimer, P., & Rozyczka, M. 1989, A&A, 216, 207
- Zacharias et al. (2004) Zacharias, N., Urban, S.E., Zacharias, M.I., et al. 2004, AJ, 127, 3043
- de Zeeuw & Brand (1985) De Zeeuw, P.T., Brand, J., 1985, in Birth and Evolution of Massive Stars and Stellar Groups, eds. H. van den Woerden & W. Boland, Reidel, Dordrecht, 95
- de Zeeuw et al. (1999) De Zeeuw, P.T., Hoogerwerf, R., de Bruijne, J.H.J., Brown, A.G.A., & Blaauw, A. 1999, AJ, 117, 354
- Zinnecker, McCaughrean, & Wilking (1993) Zinnecker, H., McCaughrean, M.J., Wilking, B.A., 1993, in Protostars and Planets III, eds. E.H. Levy & J.I. Lunine, University of Arizona Press, 429
- Zuckerman et al. (2001) Zuckerman, B., Webb, R. A., Schwartz, M., & Becklin, E. E. 2001, ApJ, 549, L233
- Zuckerman & Song (2004) Zuckerman, B. & Song, I. 2004, ARA&A, 42, 685