The effect of gas-dynamics on semi-analytic modeling of cluster galaxies
Abstract
We study the degree to which non–radiative gas dynamics affects the merger histories of haloes along with subsequent predictions from a semi–analytic model (SAM) of galaxy formation. To this aim, we use a sample of dark matter only and non–radiative SPH simulations of four massive clusters. The presence of gas–dynamical processes (e.g. ram-pressure from the hot intra–cluster atmosphere) makes haloes more fragile in the runs which include gas. This results in a 25 per cent decrease in the total number of subhaloes at . The impact on the galaxy population predicted by SAMs is complicated by the presence of ‘orphan’ galaxies, i.e. galaxies whose parent substructures are reduced below the resolution limit of the simulation. In the model employed in our study, these galaxies survive (unaffected by the tidal stripping process) for a residual merging time that is computed using a variation of the Chandrasekhar formula. Due to ram–pressure stripping, haloes in gas simulations tend to be less massive than their counterparts in the dark matter simulations. The resulting merging times for satellite galaxies are then longer in these simulations. On the other hand, the presence of gas influences the orbits of haloes making them on average more circular and therefore reducing the estimated merging times with respect to the dark matter only simulation. This effect is particularly significant for the most massive satellites and is (at least in part) responsible for the fact that brightest cluster galaxies in runs with gas have stellar masses which are about 25 per cent larger than those obtained from dark matter only simulations. Our results show that gas-dynamics has only a marginal impact on the statistical properties of the galaxy population, but that its impact on the orbits and merging times of haloes strongly influences the assembly of the most massive galaxies.
keywords:
Cosmology: theory – galaxies: clusters – methods: N-body simulations, numerical – hydrodynamics1 Introduction
During the last decade, a number of observational tests of the standard cosmological model have ushered in a new era of ‘precision cosmology’. Precise measurements of angular structure in the Cosmic Microwave Background (CMB), combined with other geometrical and dynamical cosmological tests have constrained cosmological parameters tightly (Komatsu et al., 2008, and references therein) confirming the hierarchical cold dark matter model (CDM) as the ‘standard’ model for structure formation. While the cosmological paradigm is well established, our understanding of the physical processes regulating the interplay between different baryonic components is still far from complete, and galaxy formation and evolution remains one of the most outstanding questions of modern astrophysics.
Different approaches have been developed in order to link the observed properties of luminous galaxies to those of the dark matter haloes in which they reside. Among these, semi–analytic models (SAMs) of galaxy formation have developed into a flexible and widely used tool that allows a fast exploration of the parameter space, and an efficient investigation of the influence of different physical assumptions. Computational costs are therefore reduced with respect to hydrodynamical simulations, but this is done at the expense of an explicit description of the gas dynamics (for a recent review on SAMs, see Baugh, 2006). Although recent work has started analysing the properties of the galaxy populations in hydrodynamical simulations (e.g. Frenk et al., 1996; Pearce et al., 1999; Nagamine et al., 2005; Nagai & Kravtsov, 2005; Saro et al., 2006; Oppenheimer & Davé, 2006), the computational time is still prohibitive for simulations of galaxies in large cosmological volumes. In addition, the uncertainties inherent in the physical processes at play obviously place strong limits on the accuracy with which galaxies can be simulated. As a consequence, these numerical studies also require an adequate handling of ‘sub-grid’ physics either because the resolution of the simulation becomes inadequate to resolve the scale of the physical process considered, or because we do not have a “complete theory” of that particular physical process (which is almost always true). It is therefore to be expected that SAMs will remain a valid method to study galaxy formation for the foreseeable future.
In their first renditions, SAMs took advantage of Monte Carlo techniques coupled to merging probabilities derived from the extended Press-Schechter theory to construct merging history trees of dark matter haloes (Kauffmann et al., 1993; Cole et al., 1994). An important advance of later years has been the coupling of semi-analytic techniques with direct -body simulations (Kauffmann et al., 1999; Benson et al., 2000). Since dark matter only simulations can handle large numbers of particles, such ‘hybrid’ models can access a very large dynamic range of mass and spatial resolution offering, at the same time, the possibility to model the spatial distribution of galaxies within dark matter haloes. It is also interesting to note that there have been a number of recent studies showing that the extended Press-Schechter formalism does not provide a faithful description of the merger trees extracted directly from N-body simulations (Benson et al., 2005; Li et al., 2007; Cole et al., 2008). This might have important consequences on the predicted properties of model galaxies, although a detailed investigation of the influence of analytical versus numerical merger trees on the predicted properties of model galaxies has not been carried out yet.
A related question is whether the inclusion of the baryonic component alters the halo dynamics with respect to a purely dark matter (DM) simulation. Processes like ram–pressure stripping and gas viscosity are expected to produce a significant segregation between the collisional and collisionless components (Vollmer et al., 2001). These effects are likely more important in environments characterised by high densities and large velocity dispersions (like galaxy clusters), and are expected to change the dynamics and the timing of halo mergers. As the merger history of model galaxies in a SAM is essentially driven by the merger history of its parent halo, any physical process that affects halo mergers will influence model predictions in some measure. We note that recent work has used merger trees from non–radiative hydrodynamic simulations (e.g. Cora et al., 2008) to study the chemical enrichment of the intra–cluster medium (ICM). This approach offers the advantage of providing a three-dimensional picture of the ICM, while keeping the advantage of exploring different physical choices with sensibly reduced computational times with respect to hydrodynamical simulations. The question of how SAM predictions are affected by using merger trees from different types of simulations (e.g. DM and hydrodynamical simulations) has, however, not been addressed.
The purpose of this paper is to quantify the effects of the presence of gas on the merger histories of haloes, and on predictions from a galaxy formation model. To this aim, we have used a sample of DM-only and non–radiative hydrodynamical simulations of four massive galaxy clusters (see Sec. 2). The merger trees constructed from these simulations have been used as input for a SAM (see Sec. 3), and results have been used to carry out a careful comparison of the statistical properties of the galaxy populations and of the formation history of the brightest cluster galaxies (BCGs) from the two sets of simulations.
The use of non–radiative hydrodynamics is only a first step towards a detailed comparison between SAMs and hydrodynamic simulations. A more realistic comparison should include also gas cooling and processes related to compact object physics, such as star formation, supernovae feedback and supermassive black holes production and evolution. We will present this analysis in a future work. We note that previous work has already compared results of smooth particle hydrodynamics (SPH) simulations and SAMs to calculate the evolution of cooling gas during galaxy formation (Benson et al. 2001; Yoshida et al. 2002; Helly et al. 2003; see also Cattaneo et al. 2007), but a detailed comparison is still lacking.
The plan of the paper is as follows. In Sec. 2 we describe the cluster simulations used in this study, and describe the method used for the construction of the galaxy merger trees. In Sec. 3 we provide a brief description of the SAM adopted, and in Sec. 4 we present the results of our analysis. Finally, in Sec. 5, we summarise our findings and give our conclusions.
2 The simulations
In this study, we use a set of four simulations of massive isolated galaxy clusters. Target haloes were identified in a DM only simulation that followed the evolution of particles (with a particle mass of ) in a comoving box of size Mpc on a side (Yoshida et al., 2001). The simulation was carried out assuming a flat CDM cosmology with parameters: , , and . The particles in the target clusters and their immediate surroundings were traced back to their Lagrangian regions and resimulated using the Zoomed Initial Condition (ZIC) technique by Tormen et al. (1997), increasing the force and mass resolution in the region of interest. For each halo, both a DM run and a non radiative gas run were carried out. For the DM runs, the masses of the high–resolution DM particles is . In the GAS runs, the value of is suitably decreased so as to match the assumed cosmic baryon fraction. The resulting mass of the gas particles is . In Table 1, we list the value of 111In this study, we define as the mass contained within the radius () which encompasses an average density of 200 times the critical density., , and the total number of subhaloes within .
The simulations were carried out using the TreePM–SPH code GADGET-2 (Springel, 2005). All GAS runs used in this study include only non–radiative processes. The Plummer–equivalent softening length for the gravitational force is set to in physical units from to , while at higher redshifts it is set to in comoving units. The smallest value assumed for the smoothing length of the SPH kernel is half the gravitational softening. Simulation data were stored in 93 outputs that are approximately logarithmically spaced in time down to , and approximately linearly spaced in time thereafter. Each simulation output was analysed in order to construct merger trees of all identified subhaloes using the software originally developed for the Millennium Simulation project222http://www.mpa-garching.mpg.de/galform/virgo/millennium/. We refer to Springel et al. (2001) and to Springel et al. (2005) for a detailed description of the substructure finder and of the merger tree construction algorithm. In the following, we briefly summarise the main steps of the procedure, and the changes we implemented to adapt the available software to our simulations.
| Cluster name | |||
|---|---|---|---|
| g1 DM | 13.2 | 1.78 | 276 |
| g1 GAS | 12.2 | 1.74 | 228 |
| g51 DM | 10.8 | 1.67 | 229 |
| g51 GAS | 10.6 | 1.66 | 200 |
| g72 DM | 10.9 | 1.68 | 250 |
| g72 GAS | 10.7 | 1.66 | 238 |
| g8 DM | 18.6 | 2.00 | 355 |
| g8 GAS | 19.4 | 2.03 | 219 |
For each simulation snapshot, we constructed group catalogues using a standard friends–of–friends (FOF) algorithm with a linking length of 0.16 in units of the mean inter-particle separation. Each group was then decomposed into a set of disjoint substructures identified as locally overdense regions in the density field of the background main halo. The substructure identification was performed using the algorithm SUBFIND (Springel et al., 2001). For the Millennium Simulation, all subhaloes with at least bound particles were considered to be genuine substructures. In our work, we rise this limit to at least particles. We have checked that, with this choice, ‘evanescent’ substructures (i.e. objects close to the resolution limit that occasionally appear and then disappear) are avoided. This turns out to be important particularly for our GAS runs. We remind the reader that SUBFIND classifies all particle inside a FOF group either as belonging to a bound substructure or as being unbound. The self-bound part of the FOF group itself will also appear in the substructure list and represents what we will refer to as the ‘main halo’. This particular halo typically contains 90 per cent of the mass of the FOF group (Springel et al., 2001).
The subhalo catalogues have then been used to construct merging histories of all self-bound structures in our simulations, using the same procedure outlined in Springel et al. (2005), as updated in De Lucia & Blaizot (2007). This procedure is based on the identification of a unique descendant for each self-bound structure. In order to identify the descendant of a given halo, all subhaloes in the following snapshot that contain its particles are identified. Particles are then counted by giving higher weight to those that are more tightly bound in the halo under consideration. The halo that contains the largest fraction of the most bound particles is chosen as descendant of the halo under consideration. In our GAS runs, the original weighting scheme used in Springel et al. (2005) leads to a number of premature mergers for small structures. In order to avoid this problem, we increased by a factor of one third the weight of the most bound particles with respect to the original choice (see also Dolag et al., 2008). Our choice results in a better tracing of bound structures in our GAS runs, while leaving the results of the DM runs unaffected. The merger trees constructed as described above represent the basic input needed for the semi-analytic model described in Sec. 3.
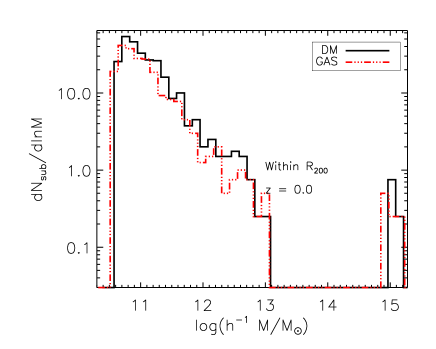
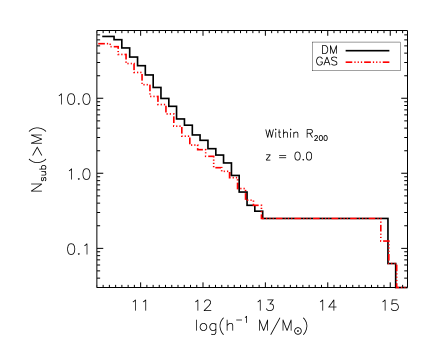
Figure 1 shows differential (left panel) and cumulative (right panel) mass functions of the subhaloes identified at within , averaged over the four simulated clusters. We have included in these distributions the four main haloes of the simulations, using the corresponding value of for the mass. These correspond to the mass bins around in the differential mass function. For all other subhaloes, the mass used in Figure 1 is the sum of the masses of all their bound particles. We will adopt this definition throughout this paper, as well as within the semi-analytic model, whenever an estimate of the substructure mass is needed. The left panel of Figure 1 shows that the DM mass function lies slightly but systematically above that measured from the GAS runs. This difference is larger than that corresponding to the shift in mass by the baryon fraction, and it cannot be accounted for by assuming that all gas is stripped from all subhaloes. It seems that in the non–radiative runs, subhaloes that are stripped of their gas become both less massive more and weakly bound (Dolag et al., 2008). This is probably also the reason of the systematic difference between in DM and GAS runs shown in Table 1. The g8 cluster is an exception: for this cluster, in the GAS run is larger than the corresponding value from the DM run, and the number of subhaloes within in the GAS run is much lower than the corresponding number in the DM run. The peculiar behaviour of this cluster can be explained by taking into account its accretion history. This is the most massive cluster in our sample, and it did not undergo any major merger event after . As a consequence, subhaloes in the GAS run spent a long time in a hot, high–pressure atmosphere that can efficiently remove their gas through ram–pressure stripping. Turning back to Figure 1, the drop at masses is due to our choice of considering only substructures with at least 32 bound particles. In the GAS runs, the drop occurs at slightly lower masses because of the reduced value of the gas particle mass with respect to the DM particle mass.
Although the difference is small, Figure 1 shows that our GAS runs contain less substructures than the corresponding DM runs. In the following sections, we will analyse the impact of these differences on prediction from a semi-analytic model of galaxy formation.
3 The semi-analytic model
In this work, we use the semi-analytic model described in De Lucia & Blaizot (2007). We recall that the semi-analytic model we employ builds upon the methodology originally introduced by Kauffmann et al. (1999), Springel et al. (2001) and De Lucia, Kauffmann & White (2004). The modelling of various physical processes has been recently updated as described in Croton et al. (2006) who also included a model for the suppression of cooling flows by ‘radio-mode’ AGN feedback. We refer to the original papers for details. In this study, we have assumed a Salpeter Initial Mass Function, and a recycled gas fraction equal to 0.3.

The semi-analytic model adopted in this study includes explicitly dark matter substructures. This means that the haloes within which galaxies form are still followed even when accreted onto larger systems. As explained in Springel et al. (2001) and De Lucia et al. (2004), the adoption of this particular scheme leads to the definition of three different ‘types’ of galaxies. Each FOF group hosts a ‘Type 0’ galaxy. This galaxy is located at the position of the most bound particle of the main halo, and it is the only galaxy fed by radiative cooling from the surrounding hot halo medium. All galaxies attached to dark matter substructures are referred to as ‘Type 1’. These galaxies were previously central galaxy of a halo that merged to form the larger system in which they currently reside. The positions and velocities of these galaxies are followed by tracing the surviving core of the parent halo. The hot reservoir originally associated with the galaxy is assumed to be kinematically stripped at the time of accretion and is added to the hot component of the new main halo. Tidal truncation and stripping rapidly reduce the mass of dark matter substructures below the resolution limit of the simulation (De Lucia et al., 2004; Gao et al., 2004). When this happens, we estimate a residual surviving time for the satellite galaxies using the classical dynamical friction formula (see Sec. 4.3), and we follow the positions and velocities of the galaxies by tracing the most bound particles of the destroyed substructures. Galaxies no longer associated with distinct dark matter substructures are referred to as ‘Type 2’ galaxies, and their stellar mass is assumed not to be affected by the tidal stripping that reduces the mass of their parent haloes.
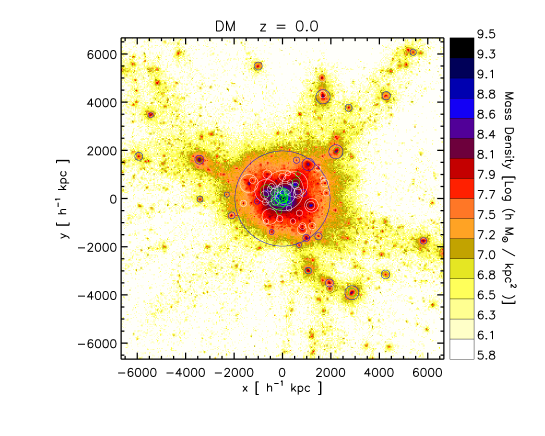
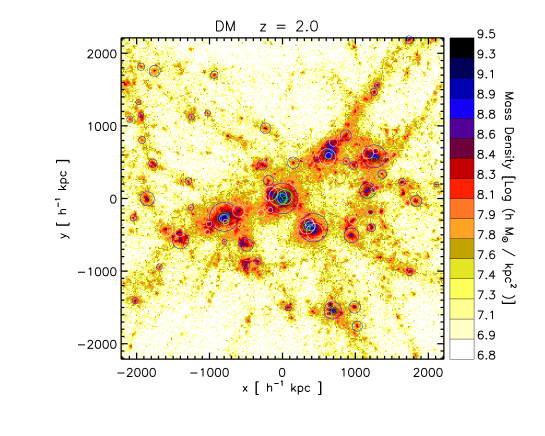
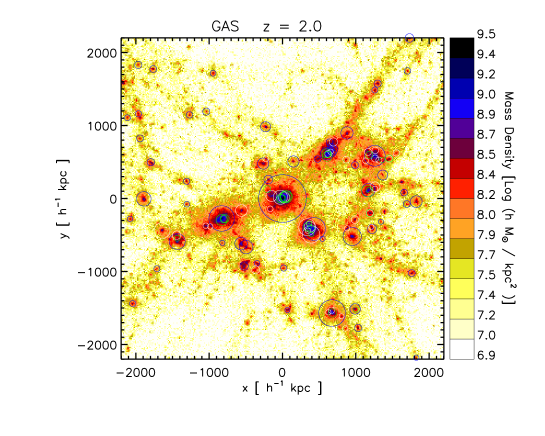
Figure 2 shows the density map of the cluster g51 from the DM run (left panels) and from the GAS run (right panels). The projections are colour-coded by mass density, computed within a box of comoving for the maps at (upper panels) and comoving for the maps corresponding to (lower panels). The boxes corresponding to are centred on the most bound particle of the main halo, while those corresponding to are centred on the position of the most bound particle of the main progenitor of the cluster halo (i.e. the progenitor with the largest mass) at the corresponding redshift. The positions of all galaxies more massive than at and at are shown in projection and marked by circles whose radii are proportional to the galaxy stellar mass. Different colours are used for different galaxy types (blue for Type-0, white for Type-1, and green for Type-2 galaxies). The top panels of Figure 2 show that the massive end of the stellar mass function at is dominated by Type-0 and Type-1 galaxies (blue and white circles) located within from the cluster centre. Type-2 galaxies (green circles) appear to be more concentrated towards the centre than Type-1 galaxies (see Sec. 4.2). The brightest cluster galaxy (BCG hereafter) in the GAS run is more massive than its counterpart in the DM run. At (lower panels), the cluster is still in the process of being assembled. In the DM run, there is no single dominant galaxy, and the region within from the main progenitor of the BCG is characterised by the presence of other three galaxies of similar mass. In the GAS run, the stellar mass of the main progenitor of the BCG is already about a factor 2 larger than other massive central galaxies in the same region. The proto-cluster regions shown in the lower panels of Figure 2 exhibit a complex dynamics, which witnesses the ongoing assembly of the BCG, and a rather intense star formation activity. This is in qualitative agreement with observations of putative proto–cluster regions, such as that at described by Miley et al. (2006) and Hatch et al. (2008), the so-called “spiderweb” galaxy. In a forthcoming paper, we will present a detailed comparison between our simulations and observations of proto-cluster regions.
4 Results
In this section we will compare the mass distributions and the spatial distributions of the galaxies identified in the DM and GAS runs. We will show that, while such distributions agree quite well, there are differences in the final masses of the BCGs. We argue that that these differences are due to the effects of gas dynamics on subhalo merging times and orbital distribution.
4.1 The stellar mass function
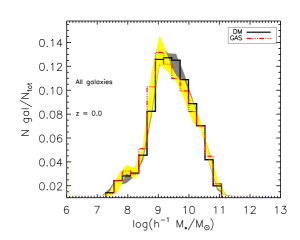
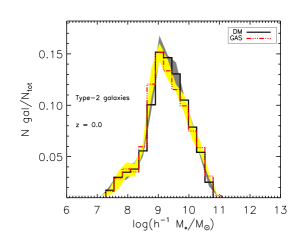
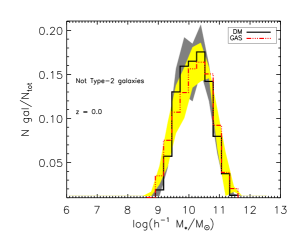
In Sect. 2, we have shown that the number of subhaloes in the GAS runs is slightly lower than the corresponding number from the DM-only run (see Figure 1). The naive expectation is to have a total number of galaxies in the GAS runs which is lower than the corresponding number in the DM runs (at least Type-0 and Type-1 galaxies). Figure 3 shows that this is indeed the case, but it also shows a number of other interesting points.
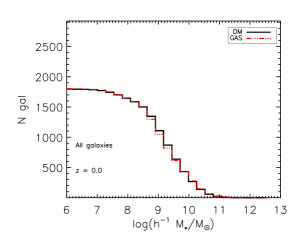
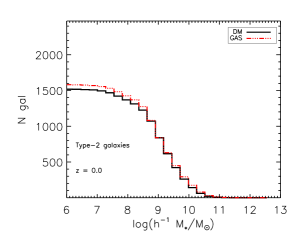
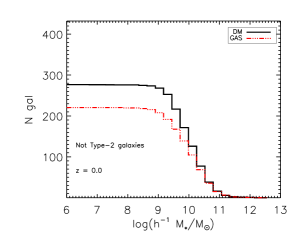
The left panels of Figure 3 show the differential (upper panel) and cumulative (lower panel) stellar mass function for the whole galaxy population within , averaged over the four clusters used in this study. The shaded regions indicate, for each value of the stellar mass, the minimum and maximum number of galaxies in the simulated clusters. The agreement between the two set of runs is quite good, but for a slight shift towards lower stellar masses for galaxies with mass . This agreement is mainly due to the dominant contribution of the Type-2 galaxy population, whose stellar mass function is shown in the central panels of Figure 3. The corresponding mass function for Type-0 and Type-1 galaxies is shown in the right panels. In order to separate differences in the total number of galaxies from differences in their mass distributions, the differential mass functions shown in the upper panels of Figure 3 have been normalised to the total number of galaxies, while the cumulative mass functions in the lower panels indicate the un-normalised number of galaxies within . We recall that in this region, there is only one Type-0 galaxy for each cluster (its BCG). Therefore all galaxies (but the four BCGs) shown in the right panels are Type-1 galaxies.
The difference found in Figure 1 reflects into a different distribution and total number of Type-0 and Type-1 galaxies. This difference is, however, compensated by the distribution and number of Type-2 galaxies, which dominate the stellar mass function in number and represent the dominant galaxy population at lower masses. The number of Type-2 galaxies in the GAS runs is slightly larger, in relative terms, than in the DM runs. This small difference is however enough to compensate the deficit of Type-1 galaxies in the GAS runs. As explained in Sec. 2, we have considered as genuine substructures all those with at least 32 bound particles. Our resolution limit for the galaxy stellar mass is therefore (with ). This value is close to the peak of the differential mass functions shown in the upper panels of Figure 3. All galaxies below this mass limit were born in fully resolved haloes, but were not able to transform all their baryons into stars (e.g. because their parent halo was accreted onto a bigger system, their gas reservoir was stripped and their star formation activity suppressed, or because they are young gas-rich galaxies in haloes that formed relatively late).
4.2 The number density profiles
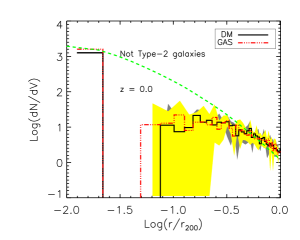
Figure 4 shows the density profile of all galaxies within from the DM (black solid lines) and the GAS (red dot-dashed lines) runs. Solid lines show the average obtained by stacking the profiles of the four clusters used in this study, while shaded regions show the minimum and maximum value obtained for the simulated clusters. As for Figure 3, we show the density profile corresponding to the whole galaxy population in the left panel, and the contributions from Type-2 and non-Type-2 galaxies in the central and left panels respectively. All profiles have been normalised to the mean galaxy density within , and correspond to the galaxies identified at . In all panels, the dashed green line shows the average DM profile of the simulated clusters, normalised to match the density profile of the galaxies in the inner bin.
The galaxy density profile is dominated by the Type-2 galaxy population at all radii, and follows very nicely the underlying DM profile, in agreement with what found by Gao et al. (2004). By definition, the central Type-0 galaxies populate the innermost bin in Figure 4. The right panel of this figure shows that Type-1 galaxies tend to avoid the central cluster regions, where they are efficiently destroyed by the intense tidal field of the parent halo. The radial profile of Type-1 galaxies is ‘anti-biased’ relative to the dark matter profile in the inner regions, as expected from studies of dark matter substructures (Ghigna et al., 2000; De Lucia et al., 2004).
The agreement between the DM and GAS runs is quite good. The only notable difference is a small shift towards the centre for the positions of Type-1 galaxies in the GAS runs. We have verified, however, that this difference is due to a single galaxy which is found closer to the centre in the GAS run of the cluster g72. The shift is due to the influence of the gas on the orbit of substructures, as we will discuss in the following.
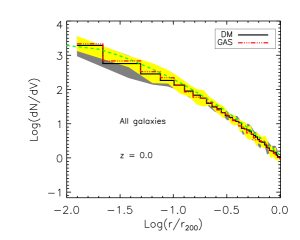
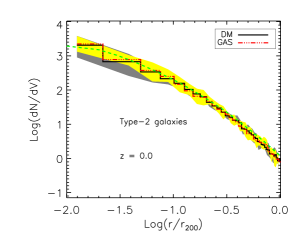
The good agreement for the radial distribution of Type-2 galaxies in the two sets of runs used in this study is not obvious. We recall that the positions of Type-2 galaxies are given by the updated positions of the particles that were the most bound particles of the parent substructure, before their masses were reduced below the resolution limit of the simulation. The agreement between the DM and GAS runs therefore implies that the presence of gas in the simulation does not significantly alter the distribution of those particles, which trace the spatial distribution of DM particles.
4.3 Merging times
In the previous section, we have shown that the cluster galaxy population resulting from the model employed in this study is dominated in number by Type-2 galaxies. Model predictions for this galaxy population are very sensitive to the residual merging times that are assigned to Type-2 galaxies when their parent dark matter subhaloes are stripped below the resolution limit of the simulation.
These merging times, which regulate for how long a Type-2 galaxy keeps its identity before merging with the central galaxy of its own halo, are computed using the following implementation of the Chandrasekhar (1943) dynamical friction formula:
| (1) |
In the above equation, is the distance between the merging halo and the centre of the structure on which it is accreted, is the circular velocity of the accreting halo at the virial radius, is the mass associated with the merging satellite, and is the mass of the accreting halo. All quantities entering in Eq. 1 are computed at the last time the merging satellite can be associated with a resolved dark matter substructure. We note that satellite galaxies can merge either with Type-0 or with Type-1 galaxies, but the majority of the mergers occur between Type-2 and Type-0 galaxies. In this case, is of the accreting halo, while in the case of a merger between a Type-2 and a Type-1 galaxy, is given by the sum of the masses of all bound particles associated with the accreting halo.
We note that Eq. 1 is adapted from the original formulation derived by Chandrasekhar in the approximation of an orbiting point mass satellite in a uniform background mass distribution. It is also worth reminding the reader that our formulation of dynamical friction does not include any dependence on the orbital distribution. Furthermore, in our SAM formulation does not include the mass associated with the stars and to the cold inter-stellar medium of the galaxy in the merging substructure. We have verified, however, that by taking into account this baryonic component does not alter significantly our results.
Two recent papers (Boylan-Kolchin et al., 2008; Jiang et al., 2008) have studied merging time-scales using N-body and hydro/N-body simulations. Both studies have pointed out that a formulation similar to that given in Eq. 1 systematically underestimates merging time-scales, although they derived new fitting formulae which differ in a number of details. In this work, we are only concerned with differences due to the application of the same formula to different runs, while we plan to come back to the validity of the Chandrasekhar formula in a future work. We also note that, in the standard application of the dynamical friction formula, quantities related to the merging satellite are computed at the time at which the satellite crosses the virial radius of the accreting halo, while in our case satellites are traced until their mass is reduced below the resolution limit of the simulation by tidal stripping. Merging times are computed at this time, so that is the distance of the merging satellite (the position of its most bound particles) to the centre of the accreting halo, and it can be larger or smaller than the virial radius of this halo.
In Sec. 2, we have shown that the number of haloes in the GAS runs is approximately equal or slightly lower than the number of haloes in the DM runs. Given this difference in the number of haloes, an excess of Type-2 galaxies in the GAS runs can have two possible explanations: a shorter lifetime of substructures or longer merging times assigned to Type-2 galaxies. In order to test which of these two alternative explanations applies, we turn to our simulation results.
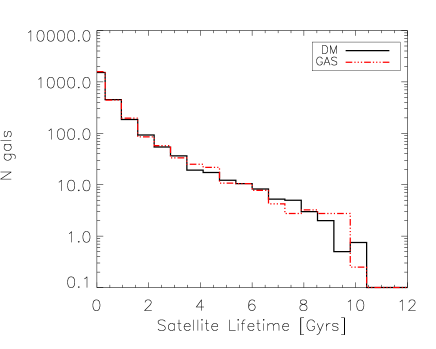
Figure 5 shows the distribution of the lifetimes of subhaloes in the DM (solid black line) and in the GAS simulations (dashed red line). For each subhalo, its lifetime is computed as the time elapsed between the last time it was identified as a main halo (i.e. hosting a Type-0 galaxy at its centre) and the time it merged (i.e. its mass dropped below the resolution limit of the simulation). For this figure and for those in the remainder of this section, we have stacked the results from the four clusters used in this study. Figure 5 shows that the distribution of lifetimes of Type-1 galaxies does not differ significantly in the DM and in the GAS runs. The excess of Type-2 galaxies must therefore be ascribed to different merging times associated with them in the two runs, with merging times expected to be systematically longer in the GAS runs. In order to verify our expectation, we show in the left panel of Figure 6 the distribution of the merging times which were assigned to Type-2 galaxies identified at . The figure shows that there is an excess of Type-2 galaxies with merging times shorter than Gyr in the DM runs, and a corresponding excess of galaxies with merging times larger than the same value in the GAS runs. The central panel of Figure 6 shows the formation times of the Type-2 galaxies identified at , i.e. the lookback times when the galaxies become Type-2 for the first time. The distributions are very similar, confirming that these Type-2 galaxies form on average at the same time in the GAS and in the DM runs. The right panel of Figure 6 shows the distribution of , which is defined as the difference between the formation times of the Type-2 galaxies identified at and the merging times they get assigned. According to this definition, the integral of this distribution between a given and infinity gives the total number of Type-2 galaxies at that have merged since lookback time . The fact that the distribution for the GAS runs lies above that of the DM runs for negative values of indicates that the excess of Type-2 galaxies in the GAS runs will continue at least in the next five Gyrs after the present time.
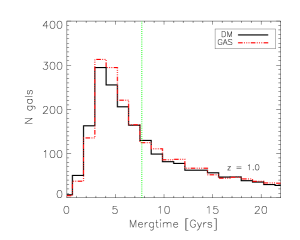
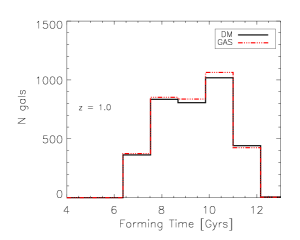
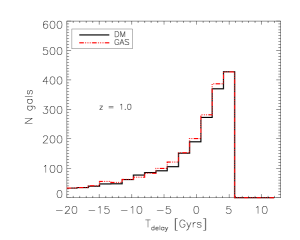
Figure 6 therefore proves that the excess of Type-2 galaxies in the GAS runs (shown in the central panels of Figure 3) is due to the fact that these galaxies get assigned longer merging times in the GAS runs with respect to the corresponding merging times assigned to Type-2 galaxies in the DM runs. It is interesting to ask what is the origin of these differences. This can be done by considering all quantities entering Eq. 1.
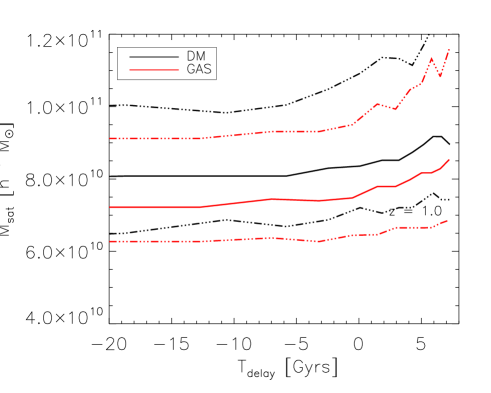
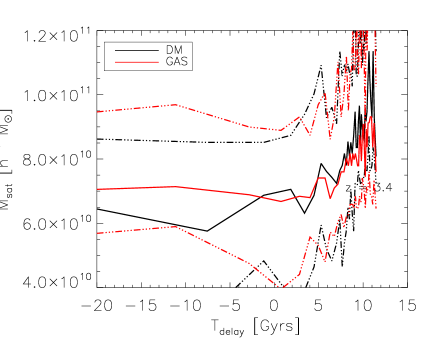
The upper left panel of Figure 7 shows the dependence of the satellite mass on , for all Type-2 galaxies identified at . The solid lines show the median of the distributions, while dot-dashed lines mark the 25th and 75th percentiles. Black and red lines are used for the DM and the GAS runs respectively. The figure indicates that, for a fixed value of , Type-2 galaxies in the GAS runs are created in substructures whose mass is systematically lower than the corresponding quantity in the DM runs. This difference is of the order of the baryonic fraction, and is due to the fact that when subhaloes lose their identity in the GAS runs, their baryonic component has been stripped by ram–pressure. A systematically lower mass for substructures in the GAS runs provides indeed longer merging times for the Type-2 galaxies (see Eq. 1).
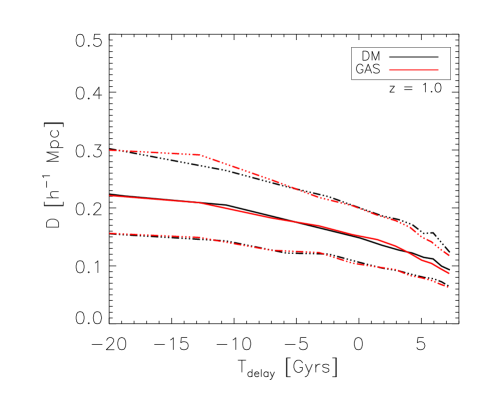
No significant difference between the GAS and the DM runs can be noticed for quantities like the distance between the merging halo and the centre of the accreting halo (top right panel of Figure 7) and the circular velocity of the accreting halo (bottom left panel of Figure 7). Finally, the bottom right panel of Figure 7 shows the ratio between the mass of the accreting halo and the satellite mass, which enters in the Coulomb logarithm at the denominator of Eq. 1. If the effect of ram–pressure was that of stripping gas only from the satellite and not from the accreting halo, we would expect a difference between the GAS and the DM runs, in the opposite sense of that shown in the top left panel of Figure 7. The figure shows a very slight tendency for larger mass ratios in the GAS runs. This suggests that also the accreting haloes tend to have a deficit of gas, with respect to the DM runs, although the difference is less significant than that found for the satellite mass. In addition, the merging times have a logarithmic dependence on the mass ratio.
Results shown in Figure 7 show then that longer merging times for Type-2 galaxies in the GAS runs are essentially due to a systematic decrease of the satellite mass, caused by ram–pressure stripping. Figure 8 shows again the satellite mass as a function of , but this time for all Type-2 galaxies identified at . At this earlier epoch, the cluster is not fully assembled yet, and the proto-cluster region contains gas with lower pressure. It is to be expected then that the effect of ram–pressure stripping is less significant. This expectation is confirmed by the results shown in the figure, which suggests no significant difference between the GAS and DM runs at this epoch.
It is worth noticing at this point that the effect of ram–pressure stripping is likely to be over-estimated in non–radiative simulations. In a more realistic case, we expect a significant fraction of baryons to be converted into stars before the effect of ram-pressure stripping becomes significant. This expectation, however, needs to be verified with hydrodynamical simulations which also include star formation and feedback processes.
4.4 The brightest cluster galaxies
In the previous sections, we have carried out a statistical comparison between the galaxy populations from the DM and GAS runs. The general level of agreement is quite good, although our analysis points out a number of interesting differences. In particular, we have shown that the presence of the gas affects the dynamics of subhaloes, so as to make an object-by-object comparison difficult. This difficulty does not hold for the brightest cluster galaxies (BCGs) which, due to their special location at the centre of the biggest halo in the simulation, can be unambiguously identified both in the DM and in the GAS runs. In this section, we will compare the BCG formation history in the two sets of runs used for our study.
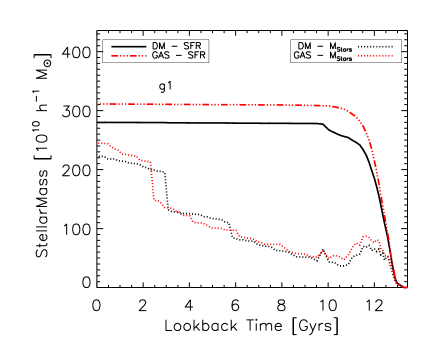
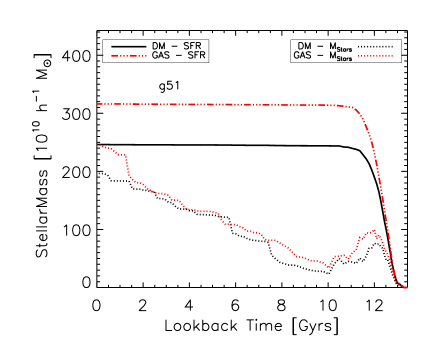
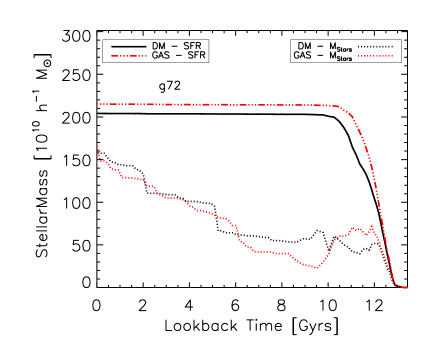
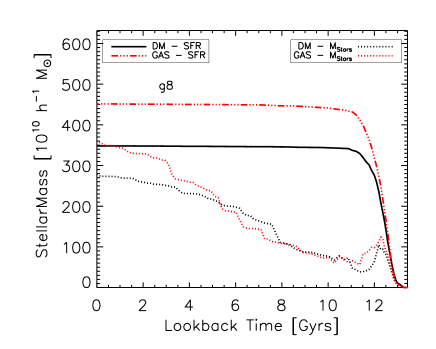
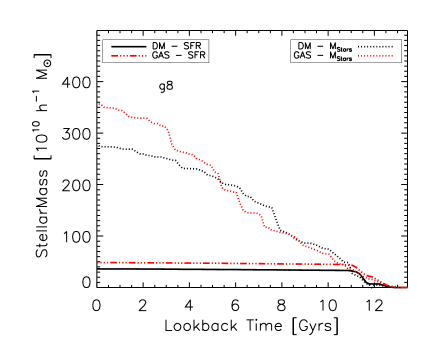
For each of the simulated clusters used in our study, we constructed the full merger tree of the final BCG tracing back in time all its progenitors and their histories. In Figure 9, we show as dotted lines the total stellar mass contained in the Type-0 progenitors of the BCG. This mass traces, for most of the time, the stellar mass of the main progenitor of the BCG. At very early times, it also includes the stellar mass of other central galaxies that belong to the tree of the BCG and that are accreted onto the cluster halo at later times (see Figure 1 of De Lucia & Blaizot 2007). We also show the integral of the star formation rate (SFR) in all the Type-0 progenitors for the DM runs (solid black lines) and for the GAS runs (dot-dashed red lines). The difference between the final stellar mass and the integral of the SFR is due to stellar mass losses333We recall that we adopt an instantaneous recycling approximation and that, for the adopted IMF, the recycled fraction is 0.3. In all the simulations used in this study, the integral of the SFR is constant over the last 10 Gyrs, suggesting that all stars that end up in the final BCGs where already formed at , in agreement with findings by De Lucia & Blaizot (2007). Figure 9 also shows that the BCGs in the GAS runs are systematically more massive than their counter-parts in the DM runs, confirming the visual impression from Figure 2. This difference amounts to a few per cent in the g72 simulation (lower left panel), but it reaches values larger than per cent of the final stellar mass for the g51 simulation (upper right panel). The difference is established at high redshift, during the formation of the bulk of the stars that end up in the final BCGs (i.e. the rising part of the curves showing the integral of the SFR).
We have verified that this difference is sometimes due to one massive satellite galaxy which merges with the main progenitor of the BCG within in the GAS run, while it gets a longer time-scale for merging in the DM run. This can be clearly seen in the case of the g51 cluster (upper right panel of Figure 9), where the red dotted line shows an increase of about in stellar mass due to a single merging event at a lookback time of Gyr. Note that this behaviour is opposite to the statistical trend that we have observed in section 4.3, where Type-2 galaxies in the GAS runs were found to have longer merging times.
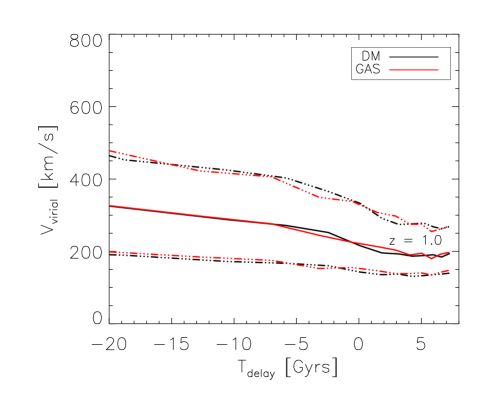
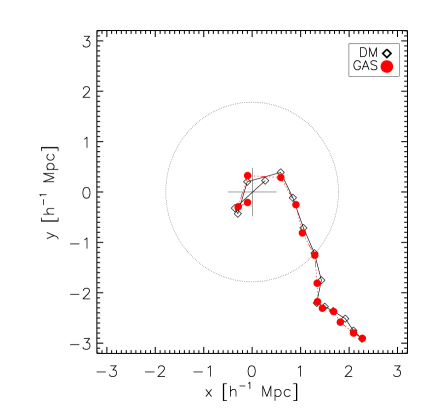
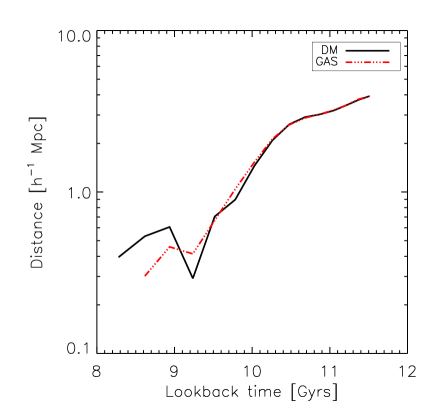
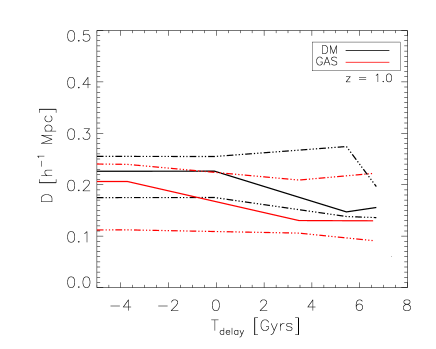
In order to understand in detail this difference, we show in the left panel of Figure 10 the orbit of the subhalo originating this Type-2 galaxy, before its merging with the g51 cluster. Black diamonds show the orbit from the the DM run, while red filled circles correspond to the orbit from the GAS run. The positions of the subhalo are initially very similar in the two runs. As it approaches the high-density environment of the cluster, it is slowed down by ram–pressure. The right panel of Figure 10 shows the evolution of the cluster-centric distance of the subhalo. The figure shows that the pericentric and apocentric passages in the GAS runs take place at a larger distance in the GAS run with respect to the DM run at a lookback time of about 9.3 Gyr, and at a smaller distance at a lookback time of about 8.9 Gyr. The subhalo has then a more circular orbit in the GAS run (see also Puchwein et al., 2005). Besides modifying the shape of the orbit and the timing of the merging, ram–pressure also makes the substructure more fragile. Indeed, this subhalo loses its identity 8.6 Gyr ago in the GAS run, at a cluster-centric distance of about . In the DM run, the same subhalo loses its identity about 8.3 Gyr ago, at a cluster-centric distance of about . Since the residual merging time assigned to the galaxy at its centre is proportional to the square of this distance (see Eq. 1), the resulting merging time in the GAS run is more than 40 per cent shorter than in the DM run, and the subhalo disappears about 0.3 Gyr earlier. The merging occurs before in the GAS run, and causes the sudden increase of the stellar mass of the BCG visible in the top right panel of Figure 9.
.
We recall that the upper right panel of Figure 7 shows that there is no significant difference, in terms of distance from the accreting halo, between the DM and GAS runs. This is in apparent contradiction with the above example. That figure was, however, obtained for all the Type-2 galaxies identified at , irrespective of their mass. In Figure 11, we repeat the same plot but considering only Type-2 galaxies with stellar masses larger than . These massive satellites belong to subhaloes that lose their identity at systematically smaller distances in the GAS runs, like in the example illustrated in Figure 10. This example is then not just a statistical fluctuation, but rather the result of a more general trend for massive Type-2 satellites whose number is, however, quite low.
Finally, we note that the difference between the mass of the BCGs in the DM and GAS runs is due mainly to a different number of progenitors, rather than to a difference in their intrinsic star formation rate. This is illustrated in Figure 12 which shows the amount of stars formed ‘in situ’ in the main progenitor of the BCG (solid black and dot-dashed red lines), and the total stellar mass in the main progenitor at each time (dotted lines). The stars formed in the main progenitor make up only a small fraction (about one tenth) of the final stellar mass in the BCG, and most of these stars are formed relatively early (more than 10 Gyrs ago). This is in agreement with results by De Lucia & Blaizot (2007, see their Figure 4). The figure shows that the amount of stars formed ‘in situ’ is comparable in the DM and GAS runs while the total mass in the main progenitor of the BCG in the GAS run increases more steeply than in the DM run, and reaches a final value that is about 1.3 times larger.
5 Conclusions and discussion
In this paper we have used numerical simulations to analyse how the presence of non–radiative gas dynamics affects the predictions of semi-analytic models of galaxy formation for the properties of cluster galaxies. The main results of our work can be summarised as follows.
-
1.
The stellar mass function of galaxies from DM-only runs is in quite good agreement with that obtained from non–radiative hydrodynamical runs. This result is a combination of two different and opposite effects.
-
•
Due to a reduced number of subhaloes in the GAS runs (see Figure 1), these simulations result in a galaxy population with a reduced number of Type-0 and Type-1 galaxies (i.e. central galaxies of a halo, either the main halo or a proper substructure).
-
•
Due to a systematic increase of the residual merging times assigned to Type-2 galaxies (those associated with haloes disrupted below the resolution limit of the simulation), the cluster galaxy population in the GAS runs contains a larger number of Type-2 galaxies than the DM runs.
-
•
-
2.
The longer merging times assigned on average to Type-2 galaxies in the GAS runs are due to ram–pressure stripping, which removes gas from the merging subhaloes and makes them more fragile. The effect of ram–pressure is more important at lower redshift, when the cluster has already assembled in a dominant structure with a high–pressure atmosphere that can efficiently remove gas from substructures. When considering the entire satellite population, we find a systematic difference between the DM and GAS runs in the sense that merging substructures are less massive in the runs with gas. This trend, however, is reversed when concentrating on the most massive satellites (see item iv below).
-
3.
Type-2 galaxies dominate the radial density profile of cluster galaxies particularly in the inner regions, in agreement with results by Gao et al. (2004). Galaxies associated with distinct dark matter substructures (Type-1 galaxies) exhibit a flatter distribution and their contribution to the inner regions of galaxy clusters is negligible. We did not find any significant difference, in terms of spatial distribution, between the DM and the GAS runs.
-
4.
Although a statistical comparison between galaxy populations from the two sets of runs results in a quite nice agreement, a one-to-one comparison for the brightest central galaxies shows that these galaxies tend to have larger stellar masses in runs with gas. The difference varies from cluster to cluster and it is generally due to single merging events of relatively massive satellites which get assigned lower merging times in the GAS runs (see the example shown in Figure 10). The final difference in stellar mass is then due primarily to a different accretion history of satellite galaxies in the two sets of runs, and not to intrinsic differences in the star formation rates in the main progenitor.
Our results demonstrate that predictions of semi-analytic models of galaxy formation are not significantly affected when non-radiative hydrodynamic simulations are used to construct the halo merger trees which provide the skeleton of the model. This statement is, however, correct only in a statistical sense. The presence of the gas induces significant differences in the timing of the halo mergers, and affects significantly the halo orbits making them more circular, on average. Although these effects might be over-estimated in our non–radiative runs, our results suggest that an accurate treatment of merging times is crucial for predicted quantities like the mass accretion history of model brightest cluster galaxies. As subhaloes are fragile systems that are rapidly reduced below the resolution limit of the simulation (De Lucia et al., 2004; Gao et al., 2004), the treatment of satellite mergers in semi-analytic models requires the use of analytic formulations (e.g. the Chandrasekhar formula). Recent work (Boylan-Kolchin et al., 2008; Jiang et al., 2008) has shown the limits of the formulation usually adopted in semi-analytic models. This recent work, however, does not provide consistent alternative formulations. Additional work is therefore needed in order to obtain a more realistic and detailed description of the merging process, which represents a crucial ingredient of semi-analytic models of galaxy formation.
Acknowledgements
We thank Volker Springel for making available the substructure finder and merger tree construction software that was originally developed for the Millennium Simulation project. We acknowledge useful discussions with Pierluigi Monaco and Giuseppe Murante. AS acknowledges the receipt of a Marie Curie Host Fellowships from the EARA-EST programme, and the hospitality of the Max-Planck-Institut für Astrophysik where this project was initiated. GDL acknowledges the receipt of a Short Visit Grant from the European Science Foundation (ESF) for the activity entitled ‘Computational Astrophysics and Cosmology’, and the hospitality of the Dipartimento di Astronomia dell’Università di Trieste where part of this work was carried out. We acknowledge financial contribution from the INFN-PD51 grant and the contract ASI I/016/07/0 (COFIS).
References
- Baugh (2006) Baugh C. M., 2006, Reports of Progress in Physics, 69, 3101
- Benson et al. (2000) Benson A. J., Cole S., Frenk C. S., Baugh C. M., Lacey C. G., 2000, MNRAS, 311, 793
- Benson et al. (2005) Benson A. J., Kamionkowski M., Hassani S. H., 2005, MNRAS, 357, 847
- Benson et al. (2001) Benson A. J., Pearce F. R., Frenk C. S., Baugh C. M., Jenkins A., 2001, MNRAS, 320, 261
- Boylan-Kolchin et al. (2008) Boylan-Kolchin M., Ma C.-P., Quataert E., 2008, MNRAS, 383, 93
- Cattaneo et al. (2007) Cattaneo A., Blaizot J., Weinberg D. H., Kereš D., Colombi S., Davé R., Devriendt J., Guiderdoni B., Katz N., 2007, MNRAS, 377, 63
- Chandrasekhar (1943) Chandrasekhar S., 1943, ApJ, 97, 255
- Cole et al. (1994) Cole S., Aragon-Salamanca A., Frenk C. S., Navarro J. F., Zepf S. E., 1994, MNRAS, 271, 781
- Cole et al. (2008) Cole S., Helly J., Frenk C. S., Parkinson H., 2008, MNRAS, 383, 546
- Cora et al. (2008) Cora S. A., Tornatore L., Tozzi P., Dolag K., 2008, MNRAS
- Croton et al. (2006) Croton D. J., Springel V., White S. D. M., De Lucia G., Frenk C. S., Gao L., Jenkins A., Kauffmann G., Navarro J. F., Yoshida N., 2006, MNRAS, 365, 11
- De Lucia & Blaizot (2007) De Lucia G., Blaizot J., 2007, MNRAS, 375, 2
- De Lucia et al. (2004) De Lucia G., Kauffmann G., Springel V., White S. D. M., Lanzoni B., Stoehr F., Tormen G., Yoshida N., 2004, MNRAS, 348, 333
- De Lucia et al. (2004) De Lucia G., Kauffmann G., White S. D. M., 2004, MNRAS, 349, 1101
- Dolag et al. (2008) Dolag K., Borgani S., Murante G., Springel V., 2008, ArXiv e-prints, 808
- Frenk et al. (1996) Frenk C. S., Evrard A. E., White S. D. M., Summers F. J., 1996, ApJ, 472, 460
- Gao et al. (2004) Gao L., De Lucia G., White S. D. M., Jenkins A., 2004, MNRAS, 352, L1
- Gao et al. (2004) Gao L., White S. D. M., Jenkins A., Stoehr F., Springel V., 2004, MNRAS, 355, 819
- Ghigna et al. (2000) Ghigna S., Moore B., Governato F., Lake G., Quinn T., Stadel J., 2000, ApJ, 544, 616
- Hatch et al. (2008) Hatch N. A., Overzier R. A., Röttgering H. J. A., Kurk J. D., Miley G. K., 2008, MNRAS, 383, 931
- Helly et al. (2003) Helly J. C., Cole S., Frenk C. S., Baugh C. M., Benson A., Lacey C., Pearce F. R., 2003, MNRAS, 338, 913
- Jiang et al. (2008) Jiang C. Y., Jing Y. P., Faltenbacher A., Lin W. P., Li C., 2008, ApJ, 675, 1095
- Kauffmann et al. (1999) Kauffmann G., Colberg J. M., Diaferio A., White S. D. M., 1999, MNRAS, 303, 188
- Kauffmann et al. (1993) Kauffmann G., White S. D. M., Guiderdoni B., 1993, MNRAS, 264, 201
- Komatsu et al. (2008) Komatsu E., Dunkley J., Nolta M. R., Bennett C. L., Gold B., Hinshaw G., Jarosik N., Larson D., Limon M., Page L., Spergel D. N., Halpern M., Hill R. S., Kogut A., Meyer S. S., Tucker G. S., Weiland J. L., Wollack E., Wright E. L., 2008, ArXiv e-prints, 803
- Li et al. (2007) Li Y., Mo H. J., van den Bosch F. C., Lin W. P., 2007, MNRAS, 379, 689
- Miley et al. (2006) Miley G. K., Overzier R. A., Zirm A. W., Ford H. C., Kurk J., Pentericci L., Blakeslee J. P., Franx M., Illingworth G. D., Postman M., Rosati P., Röttgering H. J. A., Venemans B. P., Helder E., 2006, ApJ, 650, L29
- Nagai & Kravtsov (2005) Nagai D., Kravtsov A. V., 2005, ApJ, 618, 557
- Nagamine et al. (2005) Nagamine K., Cen R., Hernquist L., Ostriker J. P., Springel V., 2005, ApJ, 618, 23
- Oppenheimer & Davé (2006) Oppenheimer B. D., Davé R., 2006, MNRAS, 373, 1265
- Pearce et al. (1999) Pearce F. R., Jenkins A., Frenk C. S., Colberg J. M., White S. D. M., Thomas P. A., Couchman H. M. P., Peacock J. A., Efstathiou G., The Virgo Consortium 1999, ApJ, 521, L99
- Puchwein et al. (2005) Puchwein E., Bartelmann M., Dolag K., Meneghetti M., 2005, A&A, 442, 405
- Saro et al. (2006) Saro A., Borgani S., Tornatore L., Dolag K., Murante G., Biviano A., Calura F., Charlot S., 2006, MNRAS, 373, 397
- Springel (2005) Springel V., 2005, MNRAS, 364, 1105
- Springel et al. (2005) Springel V., White S. D. M., Jenkins A., Frenk C. S., Yoshida N., Gao L., Navarro J., Thacker R., Croton D., Helly J., Peacock J. A., Cole S., Thomas P., Couchman H., Evrard A., Colberg J., Pearce F., 2005, Nature, 435, 629
- Springel et al. (2001) Springel V., White S. D. M., Tormen G., Kauffmann G., 2001, MNRAS, 328, 726
- Springel et al. (2001) Springel V., Yoshida N., White S., 2001, New Astronomy, 6, 79
- Tormen et al. (1997) Tormen G., Bouchet F., White S., 1997, MNRAS, 286, 865
- Vollmer et al. (2001) Vollmer B., Cayatte V., Balkowski C., Duschl W. J., 2001, ApJ, 561, 708
- Yoshida et al. (2001) Yoshida N., Sheth R. K., Diaferio A., 2001, MNRAS, 328, 669
- Yoshida et al. (2002) Yoshida N., Stoehr F., Springel V., White S. D. M., 2002, MNRAS, 335, 762