Effect of Helium Sedimentation on X-ray Measurements of Galaxy Clusters
Abstract
The uniformity of the helium-to-hydrogen abundance ratio in X-ray emitting intracluster medium (ICM) is one of the commonly adopted assumptions in X-ray analyses of galaxy clusters and cosmological constraints derived from these measurements. In this work, we investigate the effect of He sedimentation on X-ray measurements of galaxy clusters in order to assess this assumption and associated systematic uncertainties. By solving a set of flow equations for a H-He plasma, we show that the helium-to-hydrogen mass ratio is significantly enhanced in the inner regions of clusters. The effect of He sedimentation, if not accounted for, introduces systematic biases in observable properties of clusters derived using X-ray observations. We show that these biases also introduce an apparent evolution in the observed gas mass fractions of X-ray luminous, dynamically relaxed clusters and hence biases in observational constraints on the dark energy equation of state parameter, , derived from the cluster distance-redshift relation. The Hubble parameter derived from the combination of X-ray and Sunyaev-Zel’dovich effect (SZE) measurements is affected by the He sedimentation process as well. Future measurements aiming to constrain or to better than 10% may need to take into account the effect of He sedimentation. We propose that the evolution of gas mass fraction in the inner regions of clusters should provide unique observational diagnostics of the He sedimentation process.
Subject headings:
diffusion — cosmological parameters — X-rays: clusters1. Introduction
Clusters of galaxies are powerful cosmological probes and have the potential to constrain properties of dark energy and dark matter. Recent development in X-ray observations of galaxy clusters have produced a large statistical sample of clusters and start to deliver powerful cosmological constraints (Allen et al., 2004, 2008; Mantz et al., 2008; Vikhlinin et al., 2008) that are complimentary to and competitive with other techniques (e.g., supernova, baryon acoustic oscillation, and weak lensing). This has motivated construction of the next-generation of X-ray satellite missions (e.g., eROSITA) to push the precision cosmological measurements based on large X-ray cluster surveys. However, in the era of precision cosmology, the use of clusters as sensitive cosmological probes require solid understanding of cluster gas physics, testing of simplifying assumptions, and assessing associated systematic uncertainties.
One of the commonly adopted assumptions in X-ray cluster analyses include the uniformity of the helium-to-hydrogen abundance ratio with nearly primordial composition in X-ray emitting intracluster medium (ICM). At present, there is no observational test of this assumption, since both H and He in the ICM are fully ionized, which makes it difficult to measure their abundances using traditional spectroscopic techniques. Theoretically, on the other hand, it has long been suggested that heavier He nuclei slowly settle in the potential well of galaxy clusters and cause a concentration of He toward their center (Abramopoulos et al., 1981; Gilfanov & Syunyaev, 1984; Qin & Wu, 2000; Chuzhoy & Nusser, 2003; Chuzhoy & Loeb, 2004; Ettori & Fabian, 2006). In the era of precision cosmology, this could be a source of significant systematic uncertainties in X-ray measurements of galaxy clusters and cosmological parameter derived from these measurements (Markevitch, 2007).
Thus, the primary goal of the present work is to assess the validity of this assumption and associated systematic uncertainties in X-ray measurements of key cluster properties as well as cosmological parameters derived from these observations. In this work, we investigate the effects of He sedimentation on X-ray measurements of galaxy clusters by solving a set of diffusion equations for a H-He plasma in the ICM. By taking into account observed temperature profiles obtained by recent X-ray observations (Vikhlinin et al., 2006; Pratt et al., 2007; Leccardi & Molendi, 2008; George et al., 2008), we show that the observed temperature drop in the cluster outskirts lead to a significant suppression of He sedimentation, compared to the results based on the isothermal cluster model (Chuzhoy & Loeb, 2004). Our analysis indicates that the He sedimentation has negligible effect on X-ray measurements in the outer regions of clusters (e.g., ), and it does not affect cluster mass measurements obtained at the sufficiently large cluster radius. The effect of He sedimentation, on the other hand, introduces increasingly larger biases in X-ray measurements in the inner regions and could affect cosmological constraints, including the dark energy equation of state parameter derived from distance-redshift relation as well as derived from the combination of X-ray and Sunyaev-Zel’dovich effect (SZE).
The paper is organized as follows. In § 2, we describe the dependence of X-ray clusters measurements on He abundance in the ICM. The physics of He sedimentation and cluster models are discussed in § 3. In § 4, we present results of our He sedimentation calculations and investigate their effects on cluster properties and cosmological constraints derived from X-ray cluster observations. Main conclusions are summarized in § 6.
2. Effect of He Abundance on X-ray Measurements
The observed X-ray surface brightness of a cluster is primarily from bremsstrahlung continuum emission of electrons scattering off of protons and He nuclei, which is given by the integral of the emission along the line of sight,
| (1) | |||||
| (2) |
where is the He-to-H abundance ratio and is the band-limited cooling function resulted from free-free emission of electrons scattering off ion species , which is proportional to . The derivation of the second expression takes into account the charge dependence of cooling function and the fact that the number density of electron is given by . Since is observed and fixed, the proton number density inferred from X-ray observations depends on x, as . The derived gas mass density therefore depends on x as,
| (3) |
The gas mass is the volume integral of equation (3). The hydrostatic mass profile of a spherically-symmetric cluster depends on the local value of He abundance through the mean molecular weight of particles ,
| (4) |
Note that the hydrostatic mass at a fixed mean overdensity, , is given by . The gas mass fraction is then defined as .
For the primordial abundance (X = 0.75, Y = 0.25 by mass), the He-to-H abundance ratio is and the mean molecular weight is . If, for example, the He-to-H abundance ratio is enhanced by a factor of two from the primordial value, the analysis based on the assumption of the primordial abundance causes an underestimate of by 5% and an overestimate of by 12%.
3. Helium Sedimentation in X-ray Custers
3.1. Diffusion Equations
Particle diffusion in clusters is characterized by the Burgers equations of a multicomponent fluid (Burgers, 1969). Each species obeys an equation of continuity and momentum conservation,
| (5) | |||||
| (6) |
Here the species has mass , charge , density , partial pressure , and velocity , where is the proton mass. The center-of-mass of a fluid element moves with a velocity . The differential, or diffusion, velocity between species and the fluid element is then . These diffusion velocities satisfy mass and charge conservation,
| (7) | |||||
| (8) |
Note that the summations include both ions and electrons. To satisfy these conservation laws, for each sinking helium nuclei, there are roughly four protons and two electrons that float up.
Equation (6) describes forces acting on a species , and it is the balance of these forces that ultimately determines the rate of sedimentation. For a sinking He nucleus, the gravitational force () is counteracted by three types of forces provided by the induced electric field (), the pressure gradient () of the ICM, and the drag force due to collisions with surrounding particles. Note that we neglected small terms including the inertial term () and the shear stresses (or viscosity) due to collisions among the same species. We also neglected terms related to the coupling of thermal and particle diffusions, which lead to an underestimate of the He-to-H mass ratio by 20% in the radial range considered in this work (see § 5).
Note that the sedimentation destroys hydrostatic equilibrium since redistribution of particles introduce a temporal change in the total gas pressure. However, hydrostatic equilibrium can be restored quickly. This equilibrium restoring acquires a net inflow with a mean velocity ,
| (9) |
where is the total gas pressure for ideal gas, and is the gas density. Equations (5)-(9) describe the process of particle diffusion in the ICM.
3.2. Resistance Coefficient
When the plasma is sufficiently rarefied, which is the case for the ICM, particle pairs interact via a pure Coulomb potential. In the absence of magnetic field and turbulence, the resistance coefficient is given by Chapman & Cowling (1952) as,
| (10) |
where is the reduced mass of species and , and a typical value of the Coulomb logarithm is for the H-He plasma in the ICM. Resistance coefficient describes the momentum transfer rate of species per unit volume due to collisions with species (in units of ). The resistance coefficient, , is inversely proportional to the ICM temperature. Therefore, particle transport is more efficient in the ICM with higher temperature. Note that heat transport via the same particle collision physics gives that the thermal conductivity depends on as .
However, magnetic field and turbulence, present in real clusters, can significantly modify the resistance coefficients. To date, theoretical work on this subject has predicted a wide range of the magnetic suppression factor, , where is the Spitzer thermal conductivity (Spitzer, 1962), depending sensitively on the strength and the geometry of magnetic field as well as the nature of MHD turbulence. In the case of a tangled magnetic field, the thermal conductivity may be moderately suppressed () relative to the Spitzer value (Narayan & Medvedev, 2001; Chandran & Maron, 2004). Magnetothermal instability tends to drive magnetic field lines to a radial direction, which gives the suppression of (Parrish et al., 2008). It was also suggested that MHD turbulence may provide the magnetic suppression factor of order unity (Cho & Lazarian, 2004; Lazarian, 2007).
Observationally, one can use the strength of observed temperature gradients in the ICM to constrain the efficiency of thermal conductivity. Observed large-scale, negative ICM temperature gradients set the upper limit on the thermal conductivity, for a keV cluster with a typical age of 7 Gyr (Loeb, 2002). Observations of A754 also yield a suppression factor for the bulk of the ICM (Markevitch, 2003). The width of cold fronts observed by recent X-ray observations suggests a considerably smaller suppression factor () (Markevitch & Vikhlinin, 2007, for a review). This, however, is a local constraint which is not applicable to a cluster as a whole. One might also imagine that the abundance profile of heavy nuclei (e.g., Fe) with X-ray emission lines may provide further insights into the efficiency of particle diffusion. Though possible in principle, interpretation of the abundance profile is complicated by the fact that the ICM is enriched continuously by stripping of metal-enriched gas from cluster galaxies, and that the process of sedimentation is generally slower for heavier nuclei.
Given the current large uncertainties in diffusion coefficients due to the lack of knowledge on magnetic field and turbulence in the ICM, we parametrize the effective resistance coefficients as , where we take as a free parameter. In order to illustrate how our results depend on the suppression factor, we consider two cases with (un-magnetized) and (tangled magnetic field). The former should be taken as an extreme model, while the latter is roughly corresponds to the current observational limit discussed above. Note, however, that all current observations are consistent with (conduction fully suppressed). We, therefore, caution that may be orders of magnitude below the unity.
3.3. Sedimentation Velocity
To develop physical insights into the process of He sedimentation, it is useful to consider a drift velocity of a trace He particle in a background of hydrogen, i.e, and . In this limiting case, equations (6) for the two species are decoupled. The right-hand side of the equations for H vanishes, thereby fixing an electric field, . Substituting into the equation of motion for He, we obtain the sedimentation velocity of He nuclei as , which gives
| (11) | |||||
where the induced electric field counteracts gravity and suppresses the sedimentation speed by . At a fixed density, the sedimention velocity is generally larger for higher temperature () and gravity (). Note that the pressure gradient () term in equation (6) further suppresses the sedimentation process. Typical sedimentation timescale in clusters is generally longer than the Hubble time. The equilibrium distributions to the Burgers equation (Abramopoulos et al., 1981; Qin & Wu, 2000; Chuzhoy & Nusser, 2003) are therefore not applicable for clusters. Instead, a full time-dependent calculation is required for this analysis.
3.4. Cluster Models and Initial Conditions
We set up cluster models and initial conditions as follows. Initially, we assume that the ICM consists of a primordial H and He plasma uniformly throughout clusters. We ignore the contribution of heavier elements of .
For the total mass distribution, we adopt the Navarro-Frenk-White (NFW) density profile (Navarro et al., 1997),
| (12) |
where , is a scale radius, and is a normalization constant. Mass enclosed within a radius is then given by . Throughout this work, we define the cluster mass to be , where is a radius of a spherical region within which the mean enclosed mass density is times the critical density of the universe . We adopt and the concentration (V06). We also consider , where some of the X-ray measurements are also made. In this cluster model, .
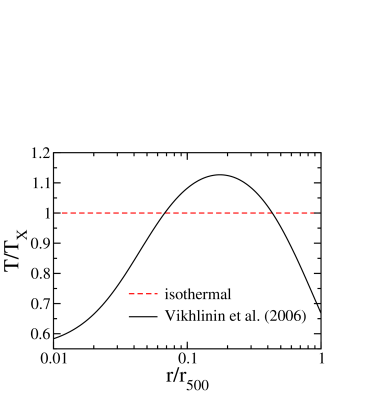
We consider two ICM temperature models: (1) the isothermal temperature profile , and (2) the observed temperature profile obtained with deep Chandra observations of nearby relaxed clusters (V06) given by
| (13) |
where , and is the X-ray spectral temperature, which is related to , where and (V06). For an illustration, we plot these ICM temperature profiles in Figure 1. The observed temperature peaks around , and decreases at both inner and outer radii. For example, the temperature drops by nearly a factor of from the peak value at and .
We set up the initial gas distribution by assuming hydrostatic equilibrium of the ICM in the potential well of clusters dominated by dark matter,
| (14) |
where the gravitational acceleration at a radius is . For each temperature profile , we derive the initial gas density profile as,
| (15) |
where the central density is normalized by requiring = 0.15 (V06), and is the central temperature for each ICM temperature model. For isothermal case, the density profile reproduces the analytical form given by with (Makino et al., 1998).
Finally, we consider two types of mass accretion histories (MAHs) of clusters: (1) a static cluster with a fixed mass, (2) the MAHs of cluster-size halos calibrated with N-body simulations of cluster formation. For the latter, we adopt an analytical expression of averaged MAHs of halos given by van den Bosch (2002),
| (16) |
where is the cluster mass at present time, is the formation redshift defined as , and is a parameter that determines the shape of MAHs of dark matter halos, and it is strongly correlated with . This functional form provides a reasonable description of the MAHs of simulated clusters for a typical value of in the range of (Tasitsiomi et al., 2004) and an average formation redshift of (Cohn & White, 2005, see also Berrier et al. 2008). 111Note that the equation (16) provides a reasonable description of the MAHs of simulated galactic-size halos (Wechsler et al., 2002) by tuning a free parameter to (see Appendix A in van den Bosch, 2002). For the cluster-size halos, we find that provides a reasonable description of their MAHs and the average formation time of a large statistical samples of clusters-size halos extracted from N-body simulations (Cohn & White, 2005, see also Berrier et al. 2008). The points that are particularly relevant for this work are that a typical present-day cluster grows by a factor of two in mass in the past Gyr since , while an equal-mass cluster at higher redshift () forms in a considerably shorter timescale ( Gyr). This suggests that the high-z clusters are generally much less affected by the process of He sedimentation than their low-redshift counterparts. In §4.1-4.3, we use the simple static cluster model to investigate the dependence of the He sedimentation efficiency on some of the key cluster parameters, including the temperature, the age, and the magnetic suppression factor. In § 4.4, we use the realistic MAHs to investigate evolution in X-ray observable properties with redshift. Throughout this work, we use cosmological parameters: , , , and (Komatsu et al., 2008).
4. Results
4.1. Spatial Distribution and Evolution of He Abundance
Starting from the initial cluster model described in § 3.4, we follow the diffusion process in the H and He plasma by solving equations (5)-(9) numerically. At each time step, equations (6)-(8) are solved to obtain diffusion velocities () for H, He and electrons as well as electric field (). Using these diffusion velocities, we update the abundance of each species by solving equations (5) and (9) together. We repeat this procedure through the mass accretion histories of galaxy clusters. We use 600 spatial grids logarithmically spaced in a computational domain of and set the diffusion velocities to zero at both inner and outer boundaries. These choices ensure that results are robust in regions of our interest ().
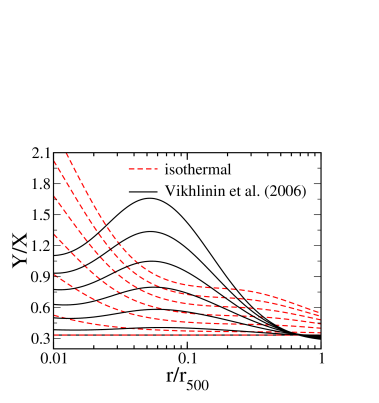
Figure 2 shows evolution of a spatial distribution of the He-to-H mass fraction () of a keV cluster with . Here we compare results of the isothermal model and those of the V06 model. This comparison shows that the observed temperature drop in the outer regions significantly suppresses the process of He sedimentation in the outskirts () of clusters. The efficiency of He sedimentation, however, is enhanced in the inner regions near the peak of the observed temperature profile, and it is suppressed again in the inner most regions () due to the observed temperature drop at these radii. At , the He abundance in the V06 model is very close to the primordial value (Y/X = 0.333). The effect of He sedimentation is negligible at this radius, and these results are fairly independent of cluster age and the value of . These conclusions are in stark contrast with the result of the isothermal model which gives considerably larger He abundance of . In the V06 model, the value of increases rapidly toward inner regions and peaks at . The mass fraction ratio increases to at and at for the cluster age of 7 Gyr.
4.2. Effect on Gas Mass, Total Mass, and Gas Mass Fraction
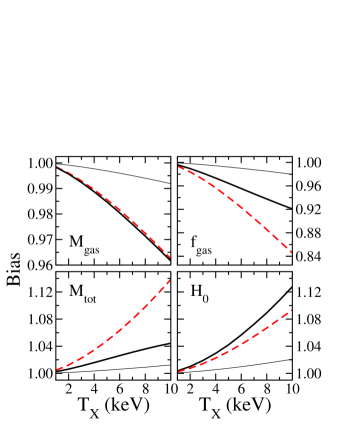
As we discussed in § 2, the spatial variation in the He abundance caused by the mass segregation could introduce observational biases in X-ray measurements of galaxy clusters. Figure 3 shows biases in X-ray measurements of gas mass, total mass, and gas mass fraction at for three sedimentation models: the isothermal model with (dashed line), the V06 model with (thick-solid line) and (thin-solid line). Results are shown for a typical cluster age of Gyr and for a range of average cluster temperatures ( keV). Here we define these biases to be ratios between the quantities derived by assuming the primordial abundance and their true values in our cluster models, which corresponds to the values that would have been obtained if the sedimentation effect has been taken into account in X-ray data analyses.
Comparing results of two different models, we find that biases in X-ray measurements of total cluster mass at are considerably smaller in the V06 model. In the case of a hot ( keV), un-magnetized () cluster, for example, the total mass is overestimated by 4% and 14% for the V06 model and isothermal model, respectively. The biases in , on the other hand, are underestimated by 4% for both models. Note that these values are similar for two different temperature models. This is because measurements, obtained by integrating the gas density over the cluster volume, depend primarily on the average ICM temperature (), and relatively insensitive to the details of ICM temperature profiles. is then biased low by 8% and 16% for V06 model and isothermal model, respectively. Note that the bias in above is obtained by integrating from the cluster center to the radius . This yields a large bias than the one evaluated by using the local He abundance at (Markevitch, 2007).
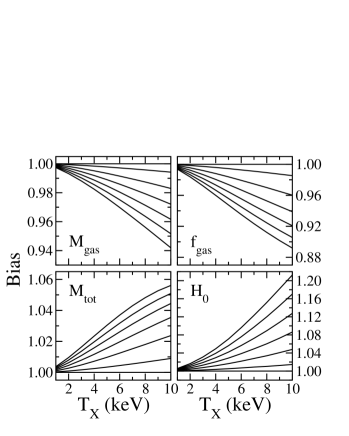
The biases in X-ray measurements are very sensitive to the average ICM temperature () as well as the magnetic suppression factor (). The biases are considerably smaller in cluster with smaller values of or , because the sedimentation process is slow in these clusters with larger resistance coefficient. We find that the biases at become negligible () for keV or . These biases also depend sensitively on the age of clusters. Figure 4 illustrates that these biases increase rapidly with the cluster age and cause the apparent evolution of X-ray measurements of hot, dynamically relaxed clusters. Our sedimentation model based on the observed V06 temperature profile predicts that the biases in are likely less than 10% for a realistic range of cluster parameters (including the cluster age, , and ). Note also that the biases become negligible in cluster outskirts () for all systems.
4.3. X-ray and SZE-derived Hubble Constant
Measurements of angular diameter distance derived from the combination of X-ray and Sunyaev-Zel’dovich Effect (SZE) observations also depend on the assumed He abundance, x, as,
| (17) |
where the expression was obtained by canceling electron densities in both the X-ray surface brightness (see eq. [2]) and the SZE comptonization parameter . Since , the X-ray+SZE derived measurements could be affected by the He sedimentation process. As shown in the bottom-right panels of Figures 3 and 4, our model suggests that the sedimentation could introduce biases in the X-ray+SZE derived measurements high by about , with the exact value depending on the cluster age, temperature, as well as the magnetic suppression factor. This effect is of the same sign and order as the 6% offset seen between the X-ray and SZE-derived Hubble constant () (Bonamente et al., 2006) and result of the Hubble Key Project () (Freedman et al., 2001). Given the errors in the current X-ray+SZE measurements, our models with and are both consistent with the observed offset. As proposed by Markevitch (2007), the comparison of the X-ray+SZE derived and independent measurements could be used to constrain the He abundance in clusters.
4.4. Evolution of Cluster Gas Mass Fraction
The evolution of cluster gas mass fraction of X-ray luminous, dynamically, relaxed clusters can provide powerful observational constraints on the equation of state of dark energy (Sasaki, 1996; Pen, 1997; Ettori et al., 2003; Allen et al., 2004; LaRoque et al., 2006; Allen et al., 2008). The sensitivity to lies in the dependence of the observed to the angular diameter distance, ,
| (18) |
where the observed is at . Recent measurements of the evolution based on Chandra X-ray observations of 42 bright, dynamically relaxed galaxy clusters yielded , by assuming a flat geometry and standard priors on and . The combined analysis of plus CMB and SNIa measurements constrains to better than , (Allen et al., 2008).
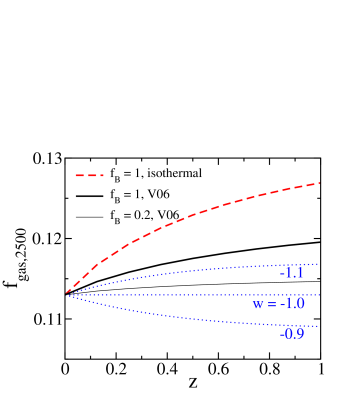
Here we point out that the effect of He sedimentation can introduce an apparent evolution in X-ray measurements of cluster gas mass fractions, which could lead to systematic biases in observational constraints on the dark energy equation of state, . This is illustrated in Figure 5, where we show evolution of the observed gas mass fraction at by using the realistic, time-dependent MAHs given by equation (16) in order to follow the He sedimentation process in a growing cluster-size halo, starting from a proto-cluster at . Our sedimentation models show that the observed gas mass fraction is overestimated by , , and at , for the isothermal model with , V06 model with and with , respectively. The apparent evolution in arises because clusters at lower-redshifts have had more time to experience the sedimentation on average.
As shown in Figure 5, the effect of He sedimentation is degenerate with changes in the dark energy equation of state, . Note that the changes in by -10% (relative to the fiducial CDM cosmology with ) corresponds to the changes in by about between and . The effect of He sedimentation is to make the best-fit more negative, i.e., . For example, results of the V06 model with () are degenerate with the cosmological models with () without sedimentation. The isothermal model with , which should be taken as an extreme case, requires . Given the measurement uncertainties ( in ), current constraints on should not be affected significantly by the effect of He sedimentation. However, future X-ray measurements aiming to constraint to better than 10% will need to take into account of this effect. Note that the effect would be larger for a population of dynamically relaxed clusters than the average population considered here.
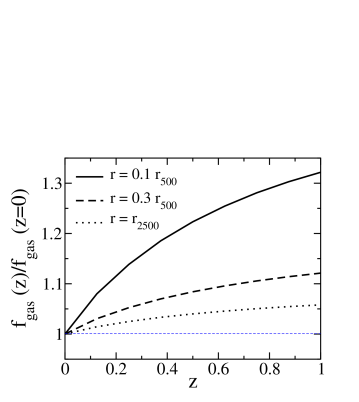
Given that the variation in the He abundance in clusters are unknown at present, it would be interesting to ask whether the current X-ray data could be used to constrain the abundance distribution. Here we propose that the evolution in the inner cluster regions, where the effect of sedimentation is expected to be larger, can be used as sensitive probes of the He sedimentation process. In Figure 6, we illustrate evolution of (V06 model with ) at three different radii, including , , and . This figure shows that changes in between and 1 are amplified significantly in the inner regions of clusters. At , evolves by from to 1, which could be detected with current data. If the gas mass fraction evolution is detected, it can provide unique constraints on the efficiency of He sedimentation, which in turn provides constraints on the magnetic and turbulent suppression of particle diffusion in the weakly magnetized ICM. Non-detection is also interesting, as it will provide an upper limit on the efficiency of particle diffusion in the ICM.
5. Discussions
Here we comment on additional effects that may affect our sedimentation calculations. First, turbulent mixing will likely play an important role in determining the efficiency of sedimentation. Turbulence, on the one hand, will tend to mix fluid elements from different parts of the cluster and to counteract the effect of sedimentation, but it may also enhance the rate of sedimentation by increasing the mobility of the ions. Detailed investigation of the effect of turbulence on sedimentation process is out of the scope of the present work. But, we point out that recent hydrodynamical simulations of galaxy cluster formation uniformly indicate the presence of ubiquitous subsonic turbulent flow in clusters (Norman & Bryan, 1999; Nagai et al., 2003; Rasia et al., 2004; Kay et al., 2004; Faltenbacher et al., 2005; Dolag et al., 2005; Rasia et al., 2006; Nagai et al., 2007). These simulations indicate that the turbulence can provide about % of the total pressure support at even in relaxed systems, and its relative importance increases in cluster outskirts as well as unrelaxed clusters with recent major mergers (Lau, Kravtsov, Nagai, in preparation). It is therefore possible that turbulent mixing caused by gas accretion in cluster outskirts and/or major mergers may significantly modify the efficiency of the sedimentation. Hydrodynamical cluster simulations that also include the sedimentation physics will likely provide realistic assessment of this effect.
We also point out that the standard diffusion equations assume that the mean-free-path of the ions is small compared to the size of the system. The proton mean-free-path, however, could become a sizable fraction of the cluster size in their outskirts (Loeb, 2007). For a keV isothermal cluster, for example, the mean-free-path of proton is comparable to the cluster virial radius (). The validity of the fluid approximation, however, depends sensitively on the ICM temperature profile. For the cluster with the same , the mean-free-path in the V06 model, for example, is considerably smaller (9%) fraction of the virial radius, which makes the fluid approximation still reasonable in the radial range of our interests.
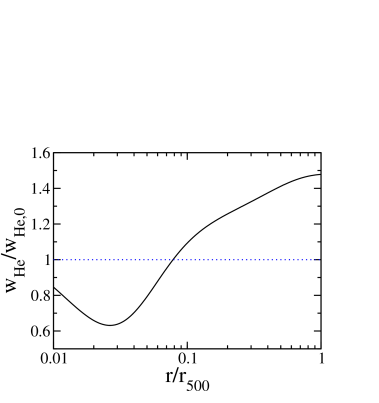
In this work, we also neglected the effect of thermal diffusion, which can cause the change in the diffusion speed. To assess the effect of thermal diffusion, we follow the formalisms presented in Burgers (1969) which takes into account the heat flow interferences, and apply it to the H-He plasma in the ICM. For isothermal case, the diffusion velocity is enhanced by , which agrees with the value reported by Chuzhoy & Loeb (2004). For non-isothermal case, we find that thermal diffusion enhances He sedimentation in the outskirts where the temperature gradient is negative, but suppresses He sedimentation in the inner region () with positive temperature gradient. Our analysis indicates that the contribution of thermal diffusion to the diffusion velocity by about throughout clusters. Figure 7 shows the change in He sedimentation speed caused by the effect of thermal diffusion as a function of . Note that the thermal diffusion causes relatively small change in the at cluster outskirts (e.g., ), despite its large fractional change in diffusion velocity. It is because that the diffusion speed was very small there to start with. Using the scaling of with time given by Chuzhoy & Loeb (2004), we find that the effect of thermal diffusion on is less than 20%.
It has been suggested that the enhancement of He abundance in the central regions might cause the decline of the observed Fe abundance (Ettori & Fabian, 2006). To assess this effect, we repeat the He sedimentation calculations for the three cool-core clusters (including Centaurus, A2199, A1795) presented in Ettori & Fabian (2006), using their observed gas density and temperature profiles. Our calculations indicate that the enhancement of He in the core of the Centaurus cluster is less than 20% from the primordial He abundance, even in the extreme case of un-magnetized cluster with the cluster age of 11 Gyr. This corresponds to a decline of the observed Fe abundance by only (see Fig. 4 of Ettori & Fabian, 2006). Similar results are found for A2199 and A1795. Note that the He sedimentation is significantly suppressed in the cool core regions. We thus conclude that the observed reduction in the iron abundance in some of the cool-core clusters cannot be explained by the He sedimentation alone.
6. Conclusions
In this work, we investigate effects of He sedimentation on X-ray measurements of galaxy clusters and their implication for cosmological constraints derived from these observations. By solving a set of flow equations for a H-He plasma and using observationally motivated cluster models, we show that the efficiency of He sedimentation is significantly suppressed in the cluster outskirts due to the observed temperature drop, while it is dramatically enhanced in the cluster core regions. Our sedimentation model based on the observed temperature profile suggest that the effect of helium sedimentation is negligible at , and it does not affect cluster mass measurements obtained at the sufficiently large cluster radius. However, the effect of sedimentation increases toward the inner regions of clusters and introduces biases in X-ray measurements of galaxy clusters. For example, at , biases in X-ray measurements of gas mass, total mass, and gas mass fractions, are at the level of . The effect of He sedimentation could also introduce biases in the estimate of the Hubble parameter derived from the combination of X-ray and SZE measurements, which could explain the observed offset in the X-ray+SZE derived and independent measurement from the Hubble Key project. We emphasize, however, that the magnitude of these biases depends sensitively on the cluster age, temperature, and magnetic and/or turbulent suppression in the ICM.
We show that the process of He sedimentation introduces the apparent evolution in the observed gas mass fractions of X-ray luminous, dynamically relaxed clusters. The effect of He sedimentation could lead to biases in observational constraints of dark energy equation of state at a level of 10%. These biases tend to make the value of more negative. Current measurements based on evolution (Allen et al., 2004, 2008) should not be significantly affected by these biases. However, future measurements aiming to constrain to better than 10% may need to take into account the effect of He sedimentation. For cosmological measurements, one way to minimize these biases is to extend the X-ray measurements to a radius well beyond . At the same time, the evolution of cluster gas mass fraction in the inner regions of clusters should provide unique observational diagnostics of the He sedimentation process in clusters.
References
- Abramopoulos et al. (1981) Abramopoulos, F., Chanan, G. A., & Ku, W. H.-M. 1981, ApJ, 248, 429
- Allen et al. (2008) Allen, S. W., Rapetti, D. A., Schmidt, R. W., Ebeling, H., Morris, R. G., & Fabian, A. C. 2008, MNRAS, 383, 879
- Allen et al. (2004) Allen, S. W., Schmidt, R. W., Ebeling, H., Fabian, A. C., & van Speybroeck, L. 2004, MNRAS, 353, 457
- Bonamente et al. (2006) Bonamente, M., Joy, M. K., LaRoque, S. J., Carlstrom, J. E., Reese, E. D., & Dawson, K. S. 2006, ApJ, 647, 25
- Burgers (1969) Burgers, J. M. 1969, Flow Equations for Composite Gases (New York: Academic Press, Inc.)
- Chandran & Maron (2004) Chandran, B. D. G., & Maron, J. L. 2004, ApJ, 602, 170
- Chapman & Cowling (1952) Chapman, S., & Cowling, T. G. 1952, The Mathematical Theory of Non-Uniform Gases (Cambridge: Cambridge University Press)
- Cho & Lazarian (2004) Cho, J., & Lazarian, A. 2004, Journal of Korean Astronomical Society, 37, 557
- Chuzhoy & Loeb (2004) Chuzhoy, L., & Loeb, A. 2004, MNRAS, 349, L13
- Chuzhoy & Nusser (2003) Chuzhoy, L., & Nusser, A. 2003, MNRAS, 342, L5
- Cohn & White (2005) Cohn, J. D., & White, M. 2005, Astroparticle Physics, 24, 316
- Dolag et al. (2005) Dolag, K., Vazza, F., Brunnetti, G., & Tormen, G. 2005, MNRAS, 364, 753
- Ettori & Fabian (2006) Ettori, S., & Fabian, A. C. 2006, MNRAS, 369, L42
- Ettori et al. (2003) Ettori, S., Tozzi, P., & Rosati, P. 2003, A&A, 398, 879
- Faltenbacher et al. (2005) Faltenbacher, A., Kravtsov, A. V., Nagai, D., & Gottlöber, S. 2005, MNRAS, 358, 139
- Freedman et al. (2001) Freedman, W. L., Madore, B. F., Gibson, B. K., Ferrarese, L., Kelson, D. D., Sakai, S., Mould, J. R., Kennicutt, Jr., R. C., Ford, H. C., Graham, J. A., Huchra, J. P., Hughes, S. M. G., Illingworth, G. D., Macri, L. M., & Stetson, P. B. 2001, ApJ, 553, 47
- George et al. (2008) George, M. R., Fabian, A. C., Sanders, J. S., Young, A. J., & Russell, H. R. 2008, ArXiv e-prints, 807
- Gilfanov & Syunyaev (1984) Gilfanov, M. R., & Syunyaev, R. A. 1984, Soviet Astronomy Letters, 10, 137
- Kay et al. (2004) Kay, S. T., Thomas, P. A., Jenkins, A., & Pearce, F. R. 2004, MNRAS, 355, 1091
- Komatsu et al. (2008) Komatsu, E., Dunkley, J., Nolta, M. R., Bennett, C. L., Gold, B., Hinshaw, G., Jarosik, N., Larson, D., Limon, M., Page, L., Spergel, D. N., Halpern, M., Hill, R. S., Kogut, A., Meyer, S. S., Tucker, G. S., Weiland, J. L., Wollack, E., & Wright, E. L. 2008, ApJS, submitted (arXiv:0803.0547)
- LaRoque et al. (2006) LaRoque, S. J., Bonamente, M., Carlstrom, J. E., Joy, M. K., Nagai, D., Reese, E. D., & Dawson, K. S. 2006, ApJ, 652, 917
- Lazarian (2007) Lazarian, A. 2007, in American Institute of Physics Conference Series, Vol. 932, Turbulence and Nonlinear Processes in Astrophysical Plasmas, 58–68
- Leccardi & Molendi (2008) Leccardi, A., & Molendi, S. 2008, A&A, accepted (arXiv:0804.1909)
- Loeb (2002) Loeb, A. 2002, New Astronomy, 7, 279
- Loeb (2007) —. 2007, Journal of Cosmology and Astro-Particle Physics, 3, 1
- Makino et al. (1998) Makino, N., Sasaki, S., & Suto, Y. 1998, ApJ, 497, 555
- Mantz et al. (2008) Mantz, A., Allen, S. W., Ebeling, H., & Rapetti, D. 2008, MNRAS, 387, 1179
- Markevitch (2003) Markevitch, M., Mazzotta, P., Vikhlinin, A., Burke, D., Butt, Y., David, L., Donnelly, H., Forman, W. R., Harris, D., Kim, D.-W., Virani, S., & Vrtilek, J. 2003, ApJ, 586, L19
- Markevitch (2007) Markevitch, M. 2007, ApJL, submitted (arXiv:0705.3289)
- Markevitch & Vikhlinin (2007) Markevitch, M., & Vikhlinin, A. 2007, Phys. Rep., 443, 1
- Nagai et al. (2003) Nagai, D., Kravtsov, A. V., & Kosowsky, A. 2003, ApJ, 587, 524
- Nagai et al. (2007) Nagai, D., Vikhlinin, A., & Kravtsov, A. V. 2007, ApJ, 655, 98
- Narayan & Medvedev (2001) Narayan, R., & Medvedev, M. V. 2001, ApJ, 562, L129
- Navarro et al. (1997) Navarro, J. F., Frenk, C. S., & White, S. D. M. 1997, ApJ, 490, 493
- Norman & Bryan (1999) Norman, M. L., & Bryan, G. L. 1999, in LNP Vol. 530: The Radio Galaxy Messier 87, ed. H.-J. Röser & K. Meisenheimer, 106
- Parrish et al. (2008) Parrish, I. J., Stone, J. M., & Lemaster, M. N. 2008, ApJ, submitted (arXiv:0806.2148)
- Pen (1997) Pen, U.-L. 1997, New Astronomy, 2, 309
- Pratt et al. (2007) Pratt, G. W., Böhringer, H., Croston, J. H., Arnaud, M., Borgani, S., Finoguenov, A., & Temple, R. F. 2007, A&A, 461, 71
- Qin & Wu (2000) Qin, B., & Wu, X. 2000, ApJ, 529, L1
- Rasia et al. (2006) Rasia, E., Ettori, S., Moscardini, L., Mazzotta, P., Borgani, S., Dolag, K., Tormen, G., Cheng, L. M., & Diaferio, A. 2006, MNRAS, 369, 2013
- Rasia et al. (2004) Rasia, E., Tormen, G., & Moscardini, L. 2004, MNRAS, 351, 237
- Sasaki (1996) Sasaki, S. 1996, PASJ, 48, L119
- Spitzer (1962) Spitzer, L. 1962, Physics of Fully Ionized Gases (Physics of Fully Ionized Gases, New York: Interscience (2nd edition), 1962)
- Tasitsiomi et al. (2004) Tasitsiomi, A., Kravtsov, A. V., Gottlöber, S., & Klypin, A. A. 2004, ApJ, 607, 125
- van den Bosch (2002) van den Bosch, F. C. 2002, MNRAS, 331, 98
- Vikhlinin et al. (2008) Vikhlinin, A., Burenin, R. A., Ebeling, H., Forman, W. R., Hornstrup, A., Jones, C., Kravtsov, A. V., Murray, S. S., Nagai, D., Quintana, H., & Voevodkin, A. 2008, ApJ, submitted (arXiv:0805.2207)
- Vikhlinin et al. (2006) Vikhlinin, A., Kravtsov, A., Forman, W., Jones, C., Markevitch, M., Murray, S. S., & Van Speybroeck, L. 2006, ApJ, 640, 691
- Wechsler et al. (2002) Wechsler, R. H., Bullock, J. S., Primack, J. R., Kravtsov, A. V., & Dekel, A. 2002, ApJ, 568, 52