2 II. Institut für Theoretische Physik, Universität Hamburg, Luruper Chaussee 149, D-22761 Hamburg, Germany
Survival probability in diffractive dijet photoproduction
Abstract
We confront the latest H1 and ZEUS data on diffractive dijet photoproduction with next-to-leading order QCD predictions in order to determine whether a rapidity gap survival probability of less than one is supported by the data. We find evidence for this hypothesis when assuming global factorization breaking for both the direct and resolved photon contributions, in which case the survival probability would have to be -dependent, and for the resolved or in addition the related direct initial-state singular contribution only, where it would be independent of .
LPSC 08-115
1 Introduction
The central problem for hard diffractive scattering processes, characterized by a large rapidity gap in high-energy collisions, is whether they can be factorized into non-perturbative diffractive parton density functions (PDFs) of a colorless object (e.g. a pomeron) and perturbatively calculable partonic cross sections. This concept is believed to hold for the scattering of point-like electromagnetic probes off a hadronic target, such as deep-inelastic scattering (DIS) or direct photoproduction [1], but has been shown to fail for purely hadronic collisions [1, 2]. Factorization is thus expected to fail also in resolved photoproduction, where the photon first dissolves into partonic constituents, before these scatter off the hadronic target. The separation of the two types of photoproduction processes is, however, a leading order (LO) concept. At next-to-leading order (NLO) of perturbative QCD, they are closely connected by an initial-state (IS) singularity originating from the splitting (for a review see [3]), which may play a role in the way factorization breaks down in diffractive photoproduction [4]. The breaking of the resolved photoproduction component only leads to a dependence of the predicted cross section on the factorization scale [4]. Since this -dependence is unphysical, it must be remedied also for the factorization breaking of the resolved part of the cross section, e.g. by modifying the IS singular direct part. A proposal how to achieve this has been worked out in [4] and has been reviewed already in the proceedings of the workshop on HERA and the LHC of 2004-2005 [5] (see also [6]). Since from a theoretical point of view only the suppression of the resolved or in addition the IS singular direct component [4] is viable, it is an interesting question whether the diffractive dijet photoproduction data show breaking of the factorization, how large the suppression in comparison to no breaking will be, and whether the breaking occurs in all components or just in the resolved plus direct IS component. The value of the suppression factor or survival probability can then be compared to theoretical predictions [7] and to the survival probability observed in jet production in collisions at the Tevatron [2] and will be of interest for similar diffractive processes at the LHC.
Since 2005 no further developments occurred on the theoretical side. On the experimental side, however, the final diffractive PDFs (DPDFs), which have been determined from the inclusive measurements of the diffractive structure function by the H1 collaboration, have been published [8]. Also both collaborations at HERA, H1 and ZEUS, have now published their final experimental data of the cross sections for diffractive dijet photoproduction [9, 10]. Whereas H1 confirm in [9] their earlier findings based on the analysis of preliminary data and preliminary DPDFs, the authors of the ZEUS analysis [10] reached somewhat different conclusions from their analysis. Specifically, the H1 collaboration [9] obtained a global suppression of their measured cross sections as compared to the NLO calculations. In this comparison [9], the survival probability is R = 0.5, independent of the DPDFs fit used, i.e. fit A or B in Ref. [8]. In addition they concluded that the assumption that the direct cross section obeys factorization is strongly disfavored by their analysis. The ZEUS collaboration, on the other hand, concluded from their analysis [10], that, within the large uncertainties of the NLO calculations, their data are compatible with the QCD calculations, i.e. that no suppression would be present.
Due to these somewhat inconsistent results we made a new effort [11] to analyze the H1 [9] and the ZEUS [10] data, following more or less the same strategy as in our earlier work [12, 13] on the basis of the NLO program of [12, 13] and the new DPDFs sets of Ref. [8]. The H1 and the ZEUS dijet data cannot be compared directly, since they have different kinematic cuts. In particular, in the H1 measurements [9] (4) GeV and , and in the ZEUS measurements [10] (6.5) GeV and (these and all other variables used in this review are defined in [11, 12, 13] and in the corresponding experimental contribution in these proceedings). It is clear that in order to establish a global suppression, i.e. an equal suppression of the direct and the resolved cross section, the absolute normalization and not so much the shape of the measured cross section is very important. This normalization depends on the applied kinematic cuts. Of course, the same cuts must be applied to the NLO cross section calculation. In case of a resolved suppression only, the suppression depends on the normalization of the cross sections, but also on the shape of some (in particular the , , , and ) distributions, and will automatically be smaller at large [3]. Distributions in and (or ) are not sensitive to the suppression mechanism. The distribution in , on the other hand, is sensitive to the functional behavior of the DPDFs, in particular of the gluon at large fractional momenta.
In the meantime, the H1 collaboration made an effort to put more light into the somewhat contradictory conclusions of the H1 [9] and ZEUS [10] collaborations by performing a new analysis of their data, now with increased luminosity, with the same kinematic cuts as in [9], i.e. the low- cut, and the high- cut as in the ZEUS analysis [10]. The results have been presented at DIS 2008 [14] and will be published soon. We have performed a new study of these H1 [14] and ZEUS data [10] to show more clearly the differences between the three data sets [15]. In this contribution we shall show a selection of these comparisons. The emphasis in these comparisons will be, how large the survival probability of the diffractive dijet cross section will be globally and whether the model with resolved suppression only will also describe the data in a satisfactory way. In section 2 we show the comparison with the H1 data [14] and in section 3 with the ZEUS data [10]. Section 4 contains our conclusions.
2 Comparison with recent H1 data
The recent H1 data for diffractive photoproduction of dijets [14] have several advantages as compared to the earlier H1 [9] and ZEUS [10] analyses. First, the integrated luminosity is three times higher than in the previous H1 analysis [9] comparable to the luminosity in the ZEUS analysis [10]. Second, H1 took data with low- and high- cuts, which allows for a comparison of [9] with [10]. The exact two kinematic ranges are given in [14]. The ranges for the low- cuts are as in the previous H1 analysis [9] and for the high- cuts are chosen as in the ZEUS analysis with two exceptions. In the ZEUS analysis the maximal cut on is larger and the data are taken in an extended -range. The definition of the various variables can be found in the H1 and ZEUS publications [9, 10]. Very important is the cut on . It is kept small in both analyses in order for the pomeron exchange to be dominant. In the experimental analysis as well as in the NLO calculations, jets are defined with the inclusive -cluster algorithm [16, 17] in the laboratory frame. At least two jets are required with the respective cuts on and , where refers to the jet with the largest (second largest) .
Before we confront the calculated cross sections with the experimental data, we correct them for hadronization effects. The hadronization corrections are calculated by means of the LO RAPGAP Monte Carlo generator. The factors for the transformation of jets made up of stable hadrons to parton jets were supplied by the H1 collaboration [14]. Our calculations are done with the ‘H1 2006 fit B’ [8] DPDFs, since they give smaller diffractive dijet cross sections than with the ‘H1 2006 fit A’. We then take with GeV, which corresponds to the value used in the DPDFs ‘H1 2006 fit A, B’ [8]. For the photon PDFs we have chosen the NLO GRV parameterization transformed to the scheme [18].
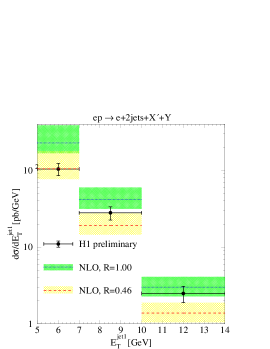
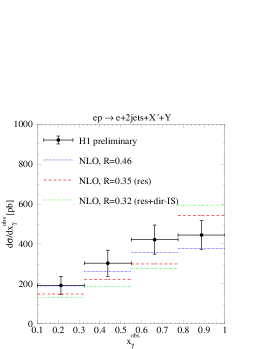
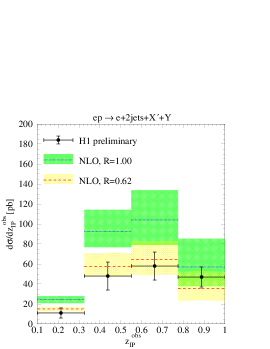
As it is clear from the discussion of the various preliminary analyses of the H1 and ZEUS collaborations, there are two questions which we would like to answer from the comparison with the recent H1 and the ZEUS data. The first question is whether a suppression factor, which differs substantially from one, is needed to describe the data. The second question is whether the data are also consistent with a suppression factor applied to the resolved cross section only. For both suppression models it is also of interest whether the resulting suppression factors are universal, i.e. whether they are independent of the kinematic variables of the process. To give an answer to these two questions we calculated first the cross sections with no suppression factor ( in the following figures) with a theoretical error obtained from varying the common scale of renormalization and factorization by factors of 0.5 and 2 around the default value (highest ). In a second step we show the results for the same differential cross sections with a global suppression factor, adjusted to at the smallest -bin. As in the experimental analysis [14], we consider the differential cross sections in the variables , , , , , , , and [15]. Here we show only a selection, i.e. the cross sections as a function of , and . For the low- cuts, the resulting suppression factor is , which gives in the lowest -bin a cross section equal to the experimental data point. The error comes from the combined experimental statistical and systematic error. The theoretical error due to the scale variation is taken into account when comparing to the three distributions. The results of this comparison are shown in Figs. 1a-c. With the exception of Fig. 1a , where the comparison of is shown, the other two plots are such that the data points lie outside the error band based on the scale variation for the unsuppressed case. However, the predictions with suppression agree nicely with the data inside the error bands from the scale variation. Most of the data points even agree with the predictions inside the much smaller experimental errors. In (see Fig. 1a) the predictions for the second and third bins lie outside the data points with their errors. For and this cross sections falls off stronger with increasing than the data, the normalization being of course about two times larger for . In particular, the third data point agrees with the prediction. This means that the suppression decreases with increasing (see also Fig. 5 below). This behavior was already apparent when we analyzed the first preliminary H1 data [12, 13]. Such a behavior points in the direction that a suppression of the resolved cross section only would give better agreement with the data, as we shall see below. The survival probability agrees with the result in [14], which quotes (stat.) 0.10 (syst.), determined by fitting the integrated cross section. From our comparison we conclude that the low- data show a global suppression of the order of two in complete agreement with the results [12, 13] and [9] based on earlier preliminary and final H1 data [9].
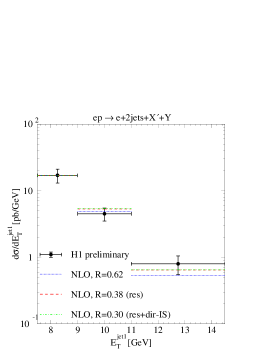
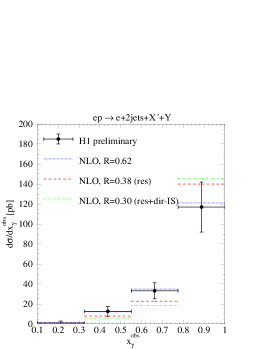
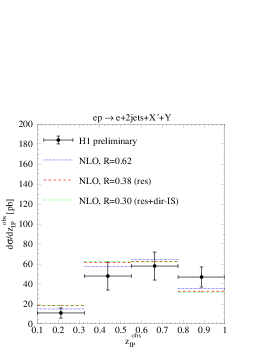
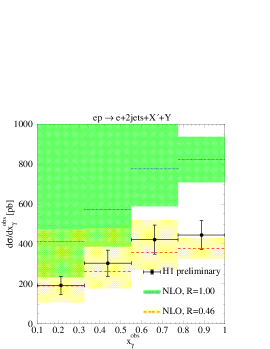
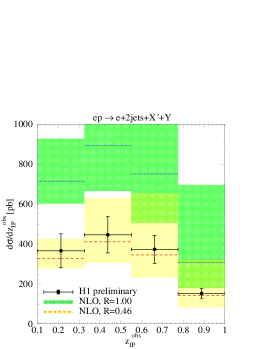
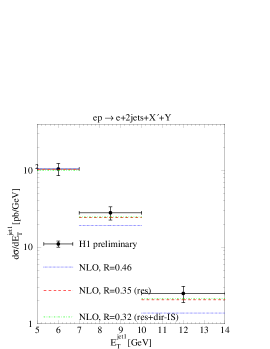
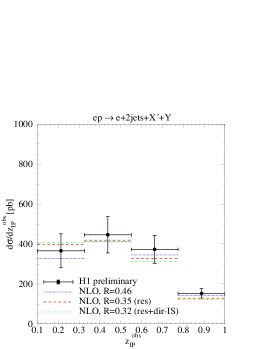
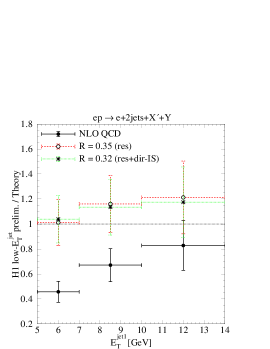
Next we want to answer the second question, whether the data could be consistent with a suppression of the resolved component only. For this purpose we have calculated the cross sections in two additional versions: (i) suppression of the resolved cross section and (ii) suppression of the resolved cross section plus the NLO direct part which depends on the factorization scale at the photon vertex [4]. The suppression factors needed for the two versions will, of course, be different. We determine them again by fitting the measured for the lowest -bin (see Fig. 2a). Then, the suppression factor for version (i) is (denoted res in the figures), and for version (ii) it is (denoted res+dir-IS). The results for , and are shown in Figs. 2a-c, while the six other distributions can be found in [15]. We also show the global (direct and resolved) suppression prediction with already shown in Figs. 1a-c. For the cross section as a function of , the agreement with the global suppression () and the resolved suppression ( or ) is comparable. For , the agreement improves considerably for the resolved suppression only (note the logarithmic scale in Fig. 2a). The global suppression factor could, of course, be -dependent, although we see no theoretical reason for such a dependence. For , which is usually considered as the characteristic distribution for distinguishing global versus resolved suppression, the agreement with resolved suppression does not improve. Unfortunately, this cross section has the largest hadronic corrections of the order of [14]. Second, also for the usual photoproduction of dijets the comparison between data and theoretical results has similar problems in the large -bin [19], although the -cut is much larger there. In total, we are tempted to conclude from the comparisons in Figs. 2a-c that the predictions with a resolved-only (or resolved+direct-IS) suppression are consistent with the new low- H1 data [14] and the survival probability is (only resolved suppression) and (resolved plus direct-IS suppression), respectively.
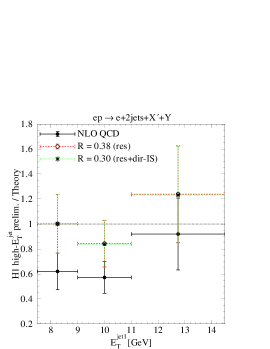
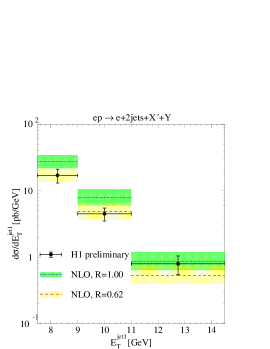
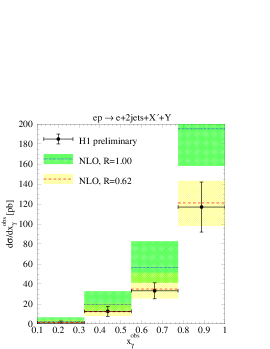
The same comparison of the high- data of H1 [14] with the various theoretical predictions is shown in the following figures. The global suppression factor is obtained again from a fit to the smallest -bin. It is equal to , again in agreement with the H1 result (stat.) 0.14 (syst.) [14]. The same cross sections as for the low- comparison are shown in Figs. 3a-c for the two cases (no suppression) and (global suppression), while the six others can again be found in [15]. As before with the exception of and (not shown), most of the data points lie outside the results with their error bands and agree with the suppressed prediction with inside the respective errors. However, compared to the results in Figs. 1a-c the distinction between the band and the band and the data is somewhat less pronounced, which is due to the larger suppression factor. We also tested the prediction for the resolved (resolved+direct-IS) suppression, which is shown in Figs. 4a-c. The suppression factor fitted to the smallest bin came out as (res) and (res+dir-IS), which are almost equal to the corresponding suppression factors derived from the low- data. In most of the comparisons it is hard to observe any preference for the global against the pure resolved (resolved plus direct-IS) suppression. We remark that the suppression factor for the global suppression is increased by , if we go from the low- to the high- data, whereas for the resolved suppression this increase is only . Under the assumption that the suppression factor should not depend on , we would conclude that the resolved suppression would be preferred, as can also be seen from Fig. 5. A global suppression is definitely observed also in the high- data and the version with resolved suppression explains the data almost as well as with the global suppression.
In Fig. 5 we show the ratio of of the -distribution as measured by H1 to the NLO QCD prediction without (full), with resolved-only (dashed), and with additional direct IS suppression (dotted). Within the experimental errors, obviously only the former, but not the latter are -dependent.
3 Comparison with ZEUS data
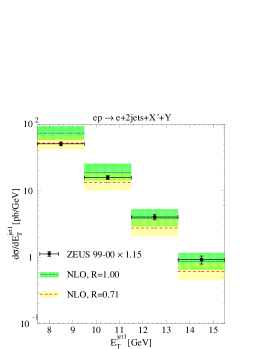
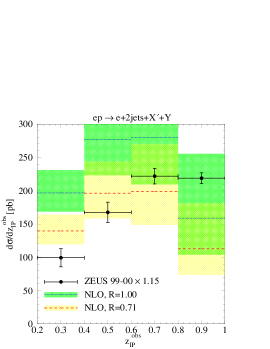
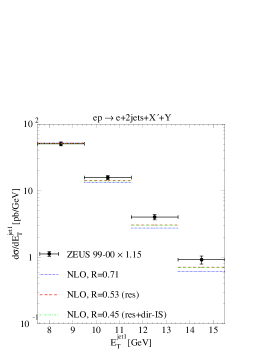
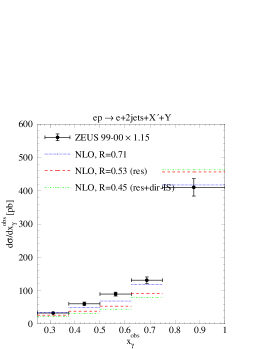
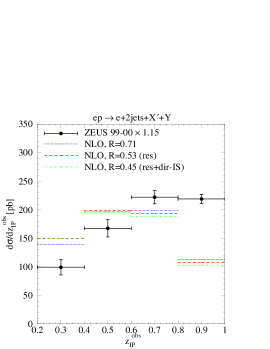
In this section we shall compare our predictions with the final analysis of the ZEUS data, which was published this year [10], in order to see whether they are consistent with the large- data of H1. The kinematic cuts [10] are almost the same as in the high- H1 measurements. The only major difference to the H1 cuts is the larger range in the variable . Therefore the ZEUS cross sections will be larger than the corresponding H1 cross sections. The constraint on is not explicitly given in the ZEUS publication [10]. They give the cross section for the case that the diffractive final state consists only of the proton. For this they correct their measured cross section by subtracting in all bins the estimated contribution of a proton-dissociative background of . When comparing to the theoretical predictions they multiply the cross section with the factor in order to correct for the proton-dissociative contributions, which are contained in the DPDFs ‘H1 2006 fit A’ and ‘H1 2006 fit B’ by requiring GeV. We do not follow this procedure. Instead we leave the theoretical cross sections unchanged, i.e. they contain a proton-dissociative contribution with GeV and multiply the ZEUS cross sections by to include the proton-dissociative contribution. This means that the so multiplied ZEUS cross sections have the same proton dissociative contribution as is in the DPDF fits of H1 [8]. Since the ZEUS collaboration did measurements only for the high- cuts, (6.5) GeV, we can only compare to those. In this comparison we shall follow the same strategy as before. We first compared to the predictions with no suppression () and then determine a suppression factor by fitting to the smallest -bin. Then we compared to the cross sections as a function of the seven observables , , , , , and instead of the nine variables in the H1 analysis. The distribution in is equivalent to the -distribution in [14]. The theoretical predictions for these differential cross sections with no suppression factor () are shown in Figs. 6a-g of [11], together with their scale errors and compared to the ZEUS data points, and a selection is shown in Fig. 6. Except for the - and -distributions, most of the data points lie outside the theoretical error bands for . In particular, in Figs. 6b, c, e, f and g, most of the points lie outside. This means that most of the data points disagree with the unsuppressed prediction. Next, we determine the suppression factor from the measured at the lowest -bin, 7.5 GeV GeV, and obtain . This factor is larger by a factor of than the suppression factor from the analysis of the high- data from H1. Curiously, this factor is exactly equal to the correction factor we had to apply to restore the dissociative proton contribution. Taking the total experimental error of from the experimental cross section in the first bin into account, the ZEUS suppression factor is to be compared to in the H1 analysis [14], so that both suppression factors agree inside the experimental errors.
If we now check how the predictions for compare to the data points inside the theoretical errors, we observe from Figs. 6a-g of Ref. [11] that, with the exception of and , most of the data points agree with the predictions. This is quite consistent with the H1 analysis (see above) and leads to the conclusion that also the ZEUS data agree much better with the suppressed predictions than with the unsuppressed prediction. In particular, the global suppression factor agrees with the global suppression factor obtained from the analysis of the H1 data inside the experimental error.
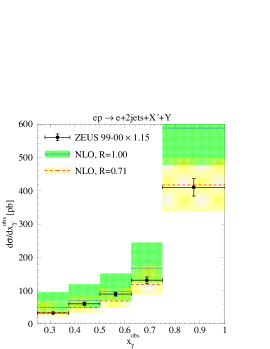
Similarly as in the previous section we compared the ZEUS data also with the assumption that the suppression results only from the resolved cross section. Here, we consider again (i) only resolved suppression (res) and (ii) resolved plus direct suppression of the initial-state singular part (res+dir-IS). For these two models we obtain the suppression factors and , respectively, where these suppression factors are again obtained by fitting the data point at the first bin of . The comparison to the global suppression with and to the data is shown in Figs. 7a-g of [11] and a selection in Fig. 7. In general, we observe that the difference between global suppression and resolved suppression is small, i.e. the data points agree with the resolved suppression as well as with the global suppression.
4 Conclusion
In conclusion, we found that most of the data points of diffractive dijet photoproduction in the latest H1 analyses with low- and high- cuts and in the final ZEUS analysis with the same high- cuts disagree with NLO QCD predictions within experimental and theoretical errors. When global factorization breaking is assumed in both the direct and resolved contributions, the resulting suppression factor would have to be -dependent, although we see no theoretical motivation for this assumption. Suppressing only the resolved or in addition the direct initial-state singular contribution by about a factor of three, as motivated by the proof of factorization in point-like photon-hadron scattering and predicted by absorptive models [7], the agreement between theory and data is at least as good as for global suppression, and no -dependence of the survival probability is needed.
References
- [1] Collins, J.C., Phys. Rev. D57, 3051 (1998)
- [2] Affolder, A.A. et al., Phys. Rev. Lett. 84, 5043 (2000)
- [3] Klasen, M., Rev. Mod. Phys. 74, 1221 (2002)
- [4] Klasen, M. and Kramer, G., J. Phys. G31, 1391 (2005)
- [5] Bruni, A., Klasen, M., Kramer, G., and Schaetzel, S. Prepared for the Workshop on the Implications of HERA for LHC Physics, CERN, Geneva, Switzerland, 26-27 Mar 2004
- [6] Klasen, M. and Kramer, G., AIP Conf. Proc. 792, 444 (2005)
- [7] Kaidalov, A.B., Khoze, V.A., Martin, A.D., and Ryskin, M.G., Phys. Lett. B567, 61 (2003)
- [8] Aktas, A. et al., Eur. Phys. J. C48, 715 (2006)
- [9] Aktas, A. et al., Eur. Phys. J. C51, 549 (2007)
- [10] Chekanov, S. et al., Eur. Phys. J. C55, 177 (2008)
- [11] Klasen, M. and Kramer, G., Mod. Phys. Lett. A23, 1885 (2008)
- [12] Klasen, M. and Kramer, G. Prepared for 12th Int. Workshop on Deep Inelastic Scattering, Strbske Pleso, Slovakia, 14-18 Apr 2004
- [13] Klasen, M. and Kramer, G., Eur. Phys. J. C38, 93 (2004)
- [14] Aktas, A. et al. Prepared for 16th Int. Workshop on Deep Inelastic Scattering, London, England, 7-11 Apr 2008
- [15] Klasen, M. and Kramer, G. DESY 08-109, LPSC 08-113, to be published
- [16] Ellis, S.D. and Soper, D.E., Phys. Rev. D48, 3160 (1993)
- [17] Catani, S., Dokshitzer, Y.L., Seymour, M.H., and Webber, B. R., Nucl. Phys. B406, 187 (1993)
- [18] Glueck, M., Reya, E., and Vogt, A., Phys. Rev. D46, 1973 (1992)
- [19] Aktas, A. et al., Phys. Lett. B639, 21 (2006).