Relation Between Stellar Mass and Star Formation Activity in Galaxies1
Abstract
For a mass-selected sample of 66544 galaxies with photometric redshifts () from the Cosmic Evolution Survey (COSMOS), we examine the evolution of star formation activity as a function of stellar mass in galaxies. We estimate the cosmic star formation rates (SFR) over the range , using the rest-frame 2800 Å flux (corrected for extinction). We find the mean SFR to be a strong function of the galactic stellar mass at any given redshift, with massive systems (log) contributing less (by a factor of 5) to the total star formation rate density (SFRD).
Combining data from the COSMOS and Gemini Deep Deep Survey (GDDS), we extend the relation as a function of stellar mass to . For massive galaxies, we find a steep increase in the relation to ; for the less massive systems, the SFRD which also increases from z to 1, levels off at . This implies that the massive systems have had their major star formation activity at earlier epochs () than the lower mass galaxies.
We study changes in the SFRDs as a function of both redshift and stellar mass for galaxies of different spectral types. We find that the slope of the SFRD-z relation for different spectral type of galaxies is a strong function of their stellar mass. For low and intermediate mass systems, the main contribution to the cosmic SFRD comes from the star-forming galaxies while, for more massive systems, the evolved galaxies are the most dominant population.
1 Introduction
Among the most outstanding issues in observational astronomy today is understanding the physics of the star formation process and the parameters responsible for it. The cosmic evolution of the star formation rate (SFR), for example, provides clues towards the assembly of mass and the development of the Hubble sequence, while parameters which govern the star formation activity are directly responsible for the evolution of galaxies. Despite significant progress on this subject in recent years, there are still a number of open questions concerning the star formation process in galaxies.
The main problems in studying star formation in galaxies can be divided into two general groups: first, uncertainties due to dust extinction and variation in properties of different star formation diagnostics (Cram et al., 1998; Hopkins et al., 2001; Sullivan et al., 2001); second, lack of knowledge about the parameters which control star formation activity in galaxies (Ellison et al 2007; Li et al 2007; Kaufmann et al 2007; Gomez et al 2005). There have been major advances in resolving the problems in the first group by comparing star formation rate (SFR) estimates from different diagnostics (Cram et al., 1998; Hopkins et al., 2003; Hopkins, 2004; Daddi et al, 2007), investigating the cause of their difference (Sullivan et al., 2001) and exploring the role of dust extinction in SFR measurements (Calzetti et al., 2007; Sullivan et al., 2001). Due to severe observational constraints, however, there has been little progress in addressing problems in the second group.
Cowie et al. (1996) first studied dependence of the specific SFR (SFR per unit mass) with redshift. They found the star forming galaxies to have relatively brighter absolute K-band luminosities () at higher redshifts () compared to those at lower-. As the is analogous to the integrated stellar mass of galaxies, they conclude that higher mass systems to mainly contribute to the star formation rate density (SFRD) at higher redshifts with the main contribution shifting to lower mass systems at lower-, a phenomenon they called “downsizing”. This was confirmed in later studies of nearby galaxies (Brinchmann et al., 2004; Heavens et al., 2004) and more distant systems (Juneau et al., 2005; Zheng et al., 2007; Scoville et al., 2007b). Observed changes in “downsizing” as a function of redshift reveals that, the most massive galaxies form first, with galaxy formation proceeding later on to smaller systems (Juneau et al., 2005).
The correlation between stellar mass and SFR in galaxies as a function of redshift provides insights into the integrated SFR over the history of galaxies and hence, a picture of galaxy evolution over cosmic time (Papovich et al., 2006; Dickinson et al., 2004). Moreover, study of these relations for different morphological types of galaxies elucidates the origin of the Hubble sequence (Abraham et al 2007; Scarlata et al 2007).
Here, we study the relation between SFR with stellar mass and redshift, using a homogeneous, complete and unbiased sample of galaxies covering a wide range in all these parameters. We use the extensive multiwavelength data from the Cosmic Evolution Survey- COSMOS (Scoville et al 2007a, Mobasher et al 2007; Capak et al 2007a). The combination of the depth, area and wavelength coverage in COSMOS is extremely beneficial for such investigations and complements existing deeper but smaller area surveys (Juneau et al., 2005; Glazebrook et al., 2005; Giavalisco et al., 2004). Results from this study are extensively used in Scoville et al (2007b) to explore the influence of local density enhancement on star formation activity in galaxies.
Throughout this paper we assume km s-1 Mpc-1, and . Magnitudes are given in the AB system.
2 Observations, Photometric Redshifts and Stellar Masses
We use the photometric data obtained from our imaging surveys of the COSMOS field. This includes data in U (CFHT), BVriz (Subaru) and Ks (Kitt Peak/CTIO) bands, covering the entire 2 sq. deg. area of the COSMOS field. Details of the photometric observations and data reduction are presented in Capak et al. (2007a) and Taniguchi et al (2007). For the present study, we use a subset of the i-band selected catalog, extended over the entire COSMOS field and complete to mag. To this magnitude limit, we derive accurate photometric redshifts and spectral types (Mobasher et al 2007) and can reliably estimate the SFRs. This covers a significantly larger area with a depth similar to previous studies (see the compilation by Hopkins and Beacom 2006).
Photometric redshifts for galaxies in COSMOS are calculated using the template fitting method incorporating priors, as described in Mobasher et al. (2007). For each object, we derive the photometric redshift, the redshift probability distribution and the best-fitting spectral type. The spectral types cover E, Sbc, Scd and Im templates (Coleman et al. 1980, extended to the UV and NIR by Bolzonella et al. 2000) in addition to two starburst templates (Kinney et al., 1996). We also consider extinction as an independent variable in the SED fits.
It is possible that by considering extinction as a free parameter in the fit, we increase the likelihood of degeneracy in the final result (i.e. redshift, dust extinction and presence of the old population all make the SEDs redder). This is examined in Mobasher et al (2007) by studying the accuracy of photometric redshifts by comparing the photometric () and spectroscopic () redshifts for a sample of galaxies in the COSMOS with available such data, expressed by the ratio: . The smallest rms scatter between the estimated photometric and available spectroscopic redshifts is obtained when treating the extinction as a free parameter (see Table 4 and Figure 5 in Mobasher et al 2007). We find with a small fraction (2.5%) of outliers, defined as . Since Mobasher et al (2007) use a sub-sample of the COSMOS galaxies with available spectroscopy to calibrate photometric redshifts, it is possible that the photometric redshift sample is biased against fainter galaxies, for which spectroscopic data do not exist in COSMOS. To minimize this, we constrain the sample to galaxies with as these have the most reliable photometric redshifts and least number of outliers (Mobasher et al 2007).
We estimate the stellar mass corresponding to each galaxy, using the photometric redshift, the rest-frame V-band absolute magnitudes () and ratio dependent on the spectral type estimated from the best fit SED for each galaxy, as described in Mobasher et al (2007).
3 Star Formation Rates from UV Luminosities
The SFRs associated with individual galaxies are estimated using rest-frame 2800 Å fluxes. We estimate this for each galaxy, using photometric data covering UBVrizK bands. This is done by interpolating between the two bands that straddle rest-frame 2800 Å wavelength, making use of the shape of the best-fit SED when doing the interpolation. The exception is at low redshifts (), where we use the observed U-band magnitude, extrapolated to 2800 Å using the best-fit SED. Having the observed apparent flux, K-correction and photometric redshifts obtained from the best-fit SEDs, we then estimate the absolute flux in rest-frame 2800 Å. A detailed description of this technique is presented in Dahlen et al. (2007).
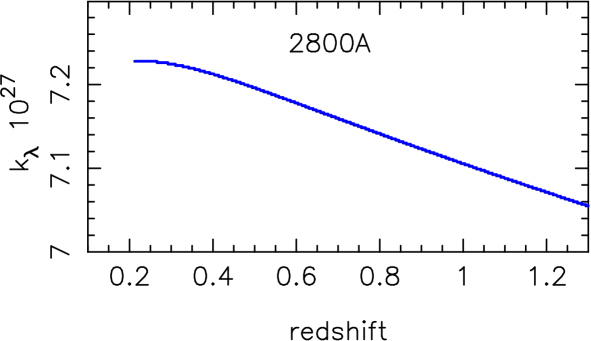
The UV luminosity at 2800 Å is mainly produced by short-lived O and B stars and is therefore closely related to the ongoing star formation activity. Here, we follow the approach in Dahlen et al. (2007) to relate the UV flux to the SFR. This involves using predictions from stellar synthesis models and assuming parametric forms for the past star formation history to mimic the evolution of the SFR with redshift, as summarized below. We derive the conversion factor between the UV flux and the ongoing SFR, using the stellar population synthesis code GALEXEV (Bruzual & Charlot, 2003). We assume solar metallicity and a modified Salpeter IMF spanning , but having a turnover at low mass (Baldry & Glazebrook, 2003). To model the dependence of SFR on redshift, we use a parametric fit to the data from the Great Observatories Origins Deep Survey (GOODS), presented in Giavalisco et al. (2004) and parameterized in Strolger et al. (2004). Convolving the past SFR history with the results from the stellar synthesis models, we derive a redshift dependent conversion factor, , between the ongoing SFR and UV flux as
| (1) |
The dependence of on redshift is shown in Figure 1. Note that we use the same volume averaged past SFR history to calcluate the conversion factor for all galaxies. Therefore, galaxies that have SFR histories significantly different from the average, may be assigned a SFR that differs from the actual value. Furthermore, galaxies of different stellar masses are characterized by different star formation histories (Panter et al 2007), introducing a mass-dependent bias into the SFR estimates for individual galaxies. We do not correct the SFR calibration here for this effect, as this is highly model-dependent and introduces more free parameters into the analysis. Moreover, any such correction would complicate the interpretation of a mass-SFR-redshift relation discussed in the following sections. We show the redshift dependence of the conversion factor in Figure 1, illustrating only a weak dependence with a change of only 2% over the redshift interval considered here. This suggests that the dependence on the assumed SFR history is weak when deriving the SFR. While this is an acknowledged source of uncertainty affecting calibration of the SFR for any individual galaxy, it has no effect on the estimates of the total SFR density (SFRD). This is because the SFRD is calculated by integrating over UV luminosity functions estimated from the data, after scaling the UV luminosity appropriately to SFR using the redshift dependent conversion shown in Figure 1. We will return to the discussion of the accuracy of the SFR calibration again in section 5.1, when we compare our estimated SFRDs with those derived independently and compiled from literature.
Accurate estimate of dust extinction is essential in correcting the SFRs measured from rest-frame UV (2800 Å) flux. Using the extinction values estimated for invidual galaxies through the SED fits, and assuming a Calzetti extinction law (Calzetti et al., 2000), we derive the reddening, , for each galaxy. To examine the accuracy of the values in this study, we explore their distribution for different spectral types of galaxies. As expected, we find the median extinction () values to increase in galaxies from old and evolved to young and star-forming spectral types. Furthermore, we estimate the dust corrected SFRDs as presented in section 5.1, with different extinction corrections: the median values for each spectral type, individual extinction corrections for each galaxy and a constant value for all the galaxies. We find that the final results do not depend on the specific prescription for extinction correction.
4 Sample Selection and Completeness
The sample considered in the present study is selected in i-band. This is the filter with the deepest COSMOS photometry and provides a sample most like a mass-selected survey (at least to ). Samples of star forming galaxies, selected based on emission lines ([OII], H), broad-band (i.e. UV, U- band), far-infrared or radio flux, can be very biased, since they select only a particular class of galaxies. This is the main reason for selecting a sample resembling a stellar mass-selected survey over much of its redshift range. The final sample has:
-
•
: the majority of the objects fainter than this limit escape detection at some wavelengths (especially in the near-infrared), resulting in poor wavelength coverage of the SEDs and thus, uncertain photometric redshifts, SFRs and stellar masses.
-
•
. The lower-limit for the photometric redshift is adopted to minimize extrapolation to rest-frame 2800 Å for low redshift galaxies, while the upper-limit is selected to avoid objects with uncertain photometric redshifts (Mobasher et al 2007).
-
•
: this allows a sample complete in terms of stellar mass. (Figure 2 shows the distribution of stellar mass as a function of redshift). We find that galaxies with redder SEDs (i.e. those with spectral types resembling the early-type systems), are highly incomplete to while this is the appropriate completness limit for galaxies with bluer SEDs (corresponding to later-type systems).
-
•
0 /yr M⊙/yr: this will exclude sources with excessive (and probably uncertain) SFRs, which could dominate the SFR densities, and AGNs wrongly classified as star-forming galaxies due to their extreme UV flux. Figure 3 shows the SFR distribution as a function of redshift. Very few galaxies are found to have and therefore, the results are not sensitive to the upper limit for the SFRs.
-
•
: to allow the selection of galaxies from the same part of the luminosity function at different redshifts and minimize luminosity (stellar mass) dependent biases. This criterion excludes only an additional 61 galaxies on top of the above criteria, predominantly located in the middle two redshift bins.
After applying the above selection criteria, we have a total of 66544 galaxies in our sample. Following Scoville et al (2007b), we divide the sample into the following redshift bins: (5594 galaxies); (9608); (22374) and (28968). In terms of stellar mass, our combined sample is complete to M⊙ over the redshift range .
The fraction of the AGNs in the final sample is (a total of 1865 sources. M. Salvato -private communication), as identified by their X-ray flux. We remove all the identified AGNs from the sample. There is a possibility that the final sample is still contaminated by a small number of AGNs. However, while massive galaxies at could host obscure AGNs (Daddi et al 2007), the fraction of galaxies at with strong nuclear activity is small. It is also likely that we miss a population of highly dusty star-forming galaxies with masses above our stellar mass completeness limit. Our estimated global SFRs are therefore likely to be lower limits, although our corrections for dust obscuration to the rest-frame UV flux and the technique used to estimate the total SFRDs are expected to account for the majority of such missing systems.
5 Results
5.1 Measurement of the Star Formation Densities
The aim of this study is to explore the effect of stellar mass on the star formation activity in galaxies and to follow its behavior as a function of look-back time. Previous such studies have either been too shallow (i.e. 2dF and SDSS- Gomez et al 2005) or, covered only small volumes with very few sources (Juneau et al., 2005), therefore, suffering from cosmic variance. The present study, based on the COSMOS field, uses data in a wide (2 sq. deg) area to medium depth, providing a highly homogeneous sample in the range , with well-known selection bias.
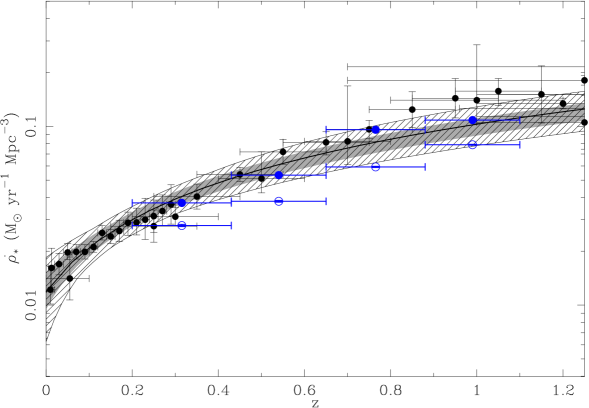
We estimate the star formation rate densities (SFRD) in four redshift intervals: ; ; and . In each redshift interval the SFRD is estimated in two ways: (1) by summing over the extinction corrected SFRs for galaxies above the stellar mass completeness limit in each redshift interval and normalizing them to the volume corresponding to that redshift slice; (2) by integrating the rest-frame UV luminosity function of galaxies (corrected for extinction) in the above redshift intervals, measuring the UV luminosity densities and converting them to SFRDs. The SFRDs from the two methods are listed in Table 1, with the evolution of the SFRD with redshift, derived from the COSMOS galaxies, presented in Figure 4. This is compared with the SFRDs estimated independently from other studies, as compiled in (Hopkins & Beacom, 2006). All the data in Figure 4 are scaled to a modified Salpeter IMF described by Baldry & Glazebrook (2003). Errorbars are measured assuming Poisson statistics. The SFRDs per redshift bin estimated from the sum of the contributions from individual galaxies is lower than those derived from the rest-frame UV LF (Table 1 and Figure 4). This is due to the absence of sources fainter than the flux limit of the survey from this method. The agreement between the SFRDs estimated here using the extinction corrected rest-frame UV LF, and those in the literature over the redshift range is very good, given that the SFRDs are measured from different diagnostics, different surveys and are based on different prescriptions for extinction correction. The agreement here lends support to our estimated values for redshift, SFR and extinction. Because of their selection wavelengths, however, all these surveys are biased against very dusty, extremely star-forming galaxies (Afonso et al., 2003), implying the estimated SFRDs in Figure 4 are likely lower limits. We further discuss this and its implications in section 6.
5.2 Relation between the SFRDs and Stellar Mass
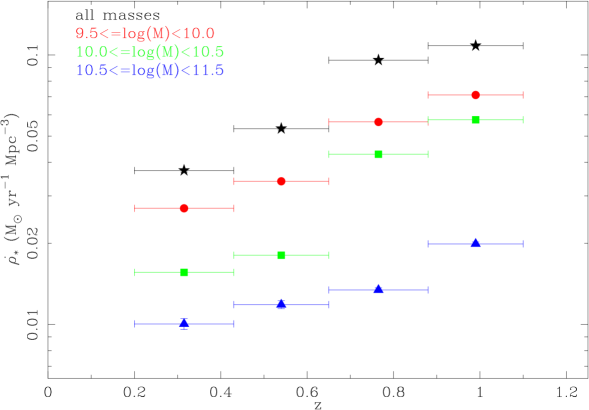
The main result of this paper is presented in Figure 5, where we find changes in the SFRDs as a function of redshift and stellar mass. We divide the sample into three mass intervals: , and in order to have a sufficient number of galaxies in each stellar mass interval. The points corresponding to the lower mass bins are likely to be lower limits due to incompletness. Errorbars correspond to Poisson statistics, and are often smaller than the symbol size. We find that for galaxies in all mass intervals, there is a clear increase in the SFRDs with redshift, changing by a factor of 2 to 4 over the redshift range considered here. Moreover, at any given redshift, more massive galaxies () contribute less (by a factor of 5) to the total SFRD. This is because they have already gone through their intensive star formation phase and have built up their mass. Results from Figure 5 also imply that, while massive galaxies continue to undergo modest star formation activity to , they have acquired most of their mass before this redshift (i.e. ). The results here are consistent with the “downsizing” picture of galaxy formation, where the SFR changes from high-mass to low-mass systems (Cowie et al. (1996); Juneau et al. (2005)).
The mass-dependent evolution of the SFRDs show progressively smaller contributions to the total SFRD (including all masses) as the SFRD declines to low-. The fraction of the total SFRD, however, is more or less constant over the redshift range probed for each mass bin (i.e. at any given mass bin, the ratio of the SFRD in that bin to the total SFRD does not change over the redshift range considered here). This result differs significantly from that found by Seymour et al (2008) for the evolution in the high-luminosity end of the luminosity function, where very strong mass-dependent evolution is seen for this fractional contribution to the total SFRD. This result is likely to be due to the different region of the luminosity function sampled by different selection effects arising at different wavelengths. Furthermore, the radio selected sample used in Seymour et al (2008) is mainly dominated by galaxies from the high-end of the luminosity function while the optically selected sample here is more typically dominated by galaxies.
Using a sample of galaxies detected at 24 m wavelength, Zheng et al (2007) studied the evolution of the SFRD with redshift as a function of stellar mass. Their sample covers the same redshift range as the present study and uses a “dust-free” measure of the SFR by combining the UV and total infrared flux (8-1000 m) for individual galaxies. Therefore, by comparing our results with those in Zheng et al (2007), one could quantify possible dust-induced biases in Figure 5, despite the very different selection criteria used for these samples. The results from the two studies are compared in Figure 6, where they are divided into the same mass intervals. Over the redshift range covered by these studies, the rate of change of the SFRDs with redshift (i.e. the slope of the SFRD- relations) is the same, independent of the stellar mass. For the intermediate mass galaxies with , there is excellent agreement between the the two studies. However, for the lowest mass bin at , the SFRD estimated here is significantly higher (by a factor of 5) at all redshifts. This discrepancy is not caused by dust extinction in our estimate of the SFRD compared to Zheng et al (2007), as this would have led to a relatively smaller SFRD (with respect to Zheng et al) for our sample. This is likely a consequence of both incompleteness and selection effects in the lowest mass bin of Zheng et al (2007). Their method of infrared (24 m) stacking, based on the optically selected sample of COMBO-17 sources in this bin, is biased against optically faint low-mass galaxies. These are exactly those systems that are likely (by virtue of dust obscuration) to be, on average, brighter in the infrared wavelengths than that measured by the stacking result from the optically detected sources. This causes a bias, leading to an underestimation in the inferred SFRD for their lowest mass bin. Moreover, the inclusion of low-mass red galaxies in the stacking analysis (as done by Zheng et al 2007) would serve to reduce the infered average SFR, adding another bias towards underestimating the true SFRD. A detailed investigation of the extent of the bias in the low mass bin of Zheng et al (2007) study would be facilitated by discriminating between blue (star-forming) and red (non-star-forming) populations. Given the above discussion, it is likely that their result for the lowest mass bin is an underestimate. The disagreement seen in the lowest mass bin in Figure 6 is therefore not surprising. To summarize, while for the intermediate mass galaxies the SFRDs at different redshifts are in excellent agreement, the observed discrepancy for the lowest mass galaxies is likely caused by incompletness and selection bias in the Zheng et al sample. Correcting for these effects brings the Zheng et al’s result into better agreement with that in the present study. For the highest mass bin ( M⊙), there is serious incompletness in our sample, which explains the relatively lower SFRDs measured for galaxies with higher stellar mass from the present study.
We find the number density evolution in the present sample to depend on the stellar mass of galaxies. The impact of this number density evolution on the SFRD can be interpreted by considering the ratio of the SFRD () to the number density of star forming galaxies (), , defined as the “characteristic star formation rate” (cSFR), as a function of mass and redshift. The cSFR remains flat for our low-mass galaxies, at a level of yr-1, while dropping by more than an order of magnitude for high mass systems from yr-1 at to yr-1 at . Intermediate masses show an intermediate level of evolution, with their cSFRs comparable to the high-mass objects at high-, and to low-mass objects at low-. This behavior exhibits the characteristics of “downsizing” in galaxy evolution in the sense that the cSFR decreases with redshift faster for massive galaxies than for low-mass systems.
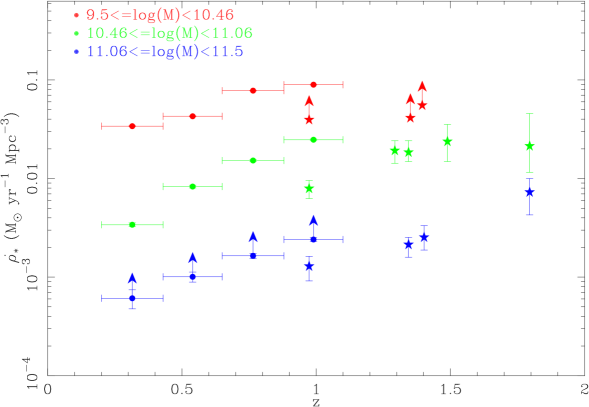
Using spectroscopic observations of galaxies over the range , selected from Gemini Deep Deep Survey (GDDS), Juneau et al. (2005) studied changes in the SFRDs with redshift as a function of stellar mass of galaxies. This provides a natural extension of the COSMOS study to . To study the behavior of this relation over the redshift range covered by the combined COSMOS and GDDS, we divide our sample into the same mass bins as those in Juneau et al. (2005) and compare the results in Figure 7. For the most massive galaxies we find the trend in SFRD with redshift to continue to , however for the less massive systems it flattens around . This implies that downsizing has been effective at , and that the massive galaxies were formed before after going through a period of intensive star formation activity. Results in Figures 5 and 7 confirm that, at any given redshift out to , massive galaxies contribute less to the total SFRDs than objects with smaller stellar mass. However, although the sample here is selected to be close to Juneau et al’s galaxies (in terms of the range in their stellar mass), differences in the selection criteria between the two samples is likely to affect the above result.
5.3 Evolution of the SFRD as a Function of Stellar Mass and Galaxy Type
The coverage of the COSMOS field by the Advanced Camera for Surveys (ACS), on-board the Hubble Space Telescope (HST), provides high resolution imaging of galaxies and measurement of their morphologies. Since the coverage is in only one HST-ACS band, it is not possible to measure morphologies for galaxies at the same rest-frame wavelength in all the 4 redshift bins studied here. We therefore use the spectral types as a proxy to rest-frame ACS morphologies. We have already shown that our estimated spectral types closely agree with the rest-frame morphologies in COSMOS (Capak et al 2007b). Nevertheless, one needs to be cautious that the spectral types and morphologies of galaxies are only loosely related. In the following discussion, these terms are used synonymously. Moreover, relations involving photometric redshifts, spectral types and stellar masses of galaxies should be interpreted carefully as these parameters are not independently derived here.
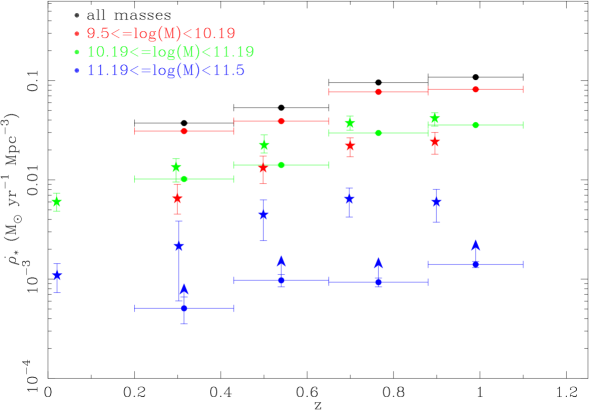
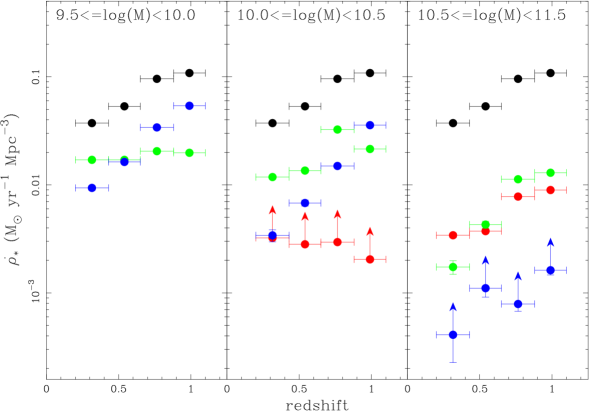
In Figure 8, we present the evolution of the SFRD with redshift as a function of both stellar mass and spectral type of galaxies. The spectral types are divided into those with redder SEDs (early types), intermediare color SEDs (spirals) and bluer SEDs (late-types and starbursts)- (Mobasher et al 2007). As with any type classification, there will be some level of misclassification or systems that do not fall easily into the defined spectral types. For the following discussion this limitation must be kept in mind. In particular, there is some ambiguity regarding irregular galaxies, which may in some instances fall either in the “spiral” or “starburst” classes as all these are represented by SEDs similar to those of star-forming galaxies. Nevertheless, we find a clear trend for all the spectral types in Figure 8. Due to serious incompleteness in galaxies with redder SEDs at , the relation for these galaxies is not shown in Figure 8. For the low and intermediate mass galaxies, starbursts dominate the star formation activity at high redshifts with a comparable contribution from spirals at lower redshifts. Also, for the lowest mass systems (), we find a steep increase with redshift in the SFRD for starbursts, compared to that for the spirals which remain unchanged with redshift. However, for the intermediate mass systems (), the slope of the SFRD- relation increases for both spirals and starbursts, with the spirals making a relatively higher contribution to the total SFRD at lower redshifts. For higher mass galaxies, the sample is dominated by early-types, with the spirals showing a relatively steeper change in their SFRD with redshift compared to earlier types. This is consistent with the expectation from the downsizing scenario that the most massive systems are dominated by early-type old galaxies, which have undergone intense star formation activity at higher redshifts (). An interesting feature in Figure 7 is that the slope of the SFRD- relation for different spectral types of galaxies are strong functions of their stellar mass.
Perhaps the most revealing population in this diagram are the starbursts. These are a dominant form of star formation in galaxies at , but their prevalance at lower redshifts declines progressively with decreasing redshift. This is reflected in the sharp decrease from to of the starburst contribution to the SFRD with redshift for low and intermediate mass systems. The fact that most definitions of a starburst favor low-mass star forming galaxies can be seen in the relatively large contribution of this population in the lowest-mass bin, and progressively less towards higher masses. In the high-mass bin, there are too few starbursts observed to reliably fit luminosity functions, and the lower limits shown reflect the sum over the detected population only. Overall, starbursts account for the majority of the star formation in low- to mid-mass systems at higher redshifts (), but at lower redshifts the dominant population shifts to the spiral types in these mass ranges. The lower the galaxy mass, the lower the redshift to which the starbursts remain dominant, consistent with the low-mass irregular starburst galaxies seen in the local universe (Figure 3 in Kennicutt 1998). This is a consequence of the change of slope of SFRD- relations found in different stellar mass intervals.
The spiral types are the dominant contributors at low redshift and low and intermediate mass, although they make a contribution similar to the early types in the highest mass bin. The evolution of the SFRD for spirals is flatter than any other classes, which is due to a transformation from starburst to spiral spectral types with decreasing redshift. We should note that, particularly for early types, the lowest mass systems are expected to form their stars very late in most hierarchical models.
6 Discussion
A number of studies in recent years have explored changes in SFRD with redshift as a function of the stellar mass of galaxies (Glazebrook et al., 2005; Juneau et al., 2005; Zheng et al., 2007). Here we investigate this relation using a large and homogeneous sample of galaxies with well-known selection biases, accurate photometric redshifts, SFR estimates and stellar mass measurements.
We find a strong dependence of the SFRD on stellar mass in the range , with higher mass galaxies ( M⊙) contributing less (by an order of magnitude) to the global SFRD than lower mass systems at any given redshift. However, the rate of evolution of the SFRD with redshift is the same, regardless of the stellar mass of galaxies, in agreement with the independent study by Zheng et al (2007), in which the effect of dust obscuration in selection of star forming galaxies and measurement of their SFRs is taken into account.
Using the GDDS with spectroscopic redshifts in the range , Juneau et al. (2005) studied this relation from to . The combined COSMOS and GDDS data show that for high mass galaxies (), the upward trend in the SFRD continues to , while for lower mass systems, after a steep increase with redshift, the SFRD flattens at . This implies that massive galaxies produced most of their stars by (when the Universe was Gyr old), with the less massive galaxies hosting efficient star formation activity only after . These results confirm that the stellar mass of galaxies regulates the relative contribution of a galaxy to the global SFRD, consistent with the “downsizing” scenario for the formation of galaxies. Moreover, we find that galaxy “downsizing” was already occuring at and has continued to the present epoch.
The estimated SFRD in this study is likely to be a lower limit due to selection at optical bands biasing against dusty star-forming galaxies, which could significantly contribute to the global SFRD. Using a near-IR selected sample with , mimicking a mass selected sample complete to M⊙, Caputi et al (2006) estimated the space density of Luminous Infrared Galaxies (LIRGs) and Ultra-Luminous Infrared Galaxies (ULIRGs) in the range , similar to the redshift range covered in the present study. They found that 24% of galaxies with M⊙ M⊙ are either LIRGs or ULIRGs (excluding AGNs), with a negligible fraction of LIRGs and ULIRGs to have masses in excess of M⊙. Furthermore, using the MIPS observations in the GOODS-S field, Caputi et al (2005) show a very small fraction of LIRGs or ULIRGs at to have M⊙. Indeed, ULIRGs of any stellar mass are found to be very rare below (Flores et al, 1999; Caputi et al, 2006; Le Floc’h et al., 2005). The conclusion from these studies is that, the fraction of massive ( M⊙) LIRGs and ULIRGs at is very small, implying that these objects do not significantly contribute to the total SFRD over this redshift range. Since the majority of the LIRGs and ULIRGs at are associated with intermediate mass systems, the absence of these galaxies from our sample is likely to lead to an underestimation of the contribution from these objects (i.e. intermediate mass systems) to the global SFRD. Moreover, (Le Floc’h et al., 2005) found that at , dusty starbursts with M⊙ yr-1 dominate the cosmic star formation density, with their contribution increasing from 50% at to 80% at (i.e. only 20% of the SFRD at is due to the UV bright galaxies). Any selection bias against these galaxies may possibly compromise our estimate of the SFRD in the range . We believe that a possible bias against such galaxies does not affect our results here. By estimating the SFRDs through integrating the rest-frame UV(2800 Å) luminosity functions (corrected for dust obscuration) over their entire magnitude range, we incorporate a contribution from galaxies at the faint-end of the UV luminosity function, where heavily obscured starbursts would lie. The excellent agreement between our estimated SFRDs from COSMOS and those based on the sample compiled by Hopkins and Beacom (2006) in Figure 4 supports the fact that the bias against dusty starburst galaxies does not significantly affect the results in the present study. We note that Hopkins and Beacom (2006) estimate the total contribution to the SFRD from their compilation by combining the SFRD inferred from the UV and far-infrared luminosities. Nevertheless, the limitations imposed by selection criteria and any biases so introduced remains a major source of uncertainty in any such study.
Using a sample of 24 m selected galaxies in GOODS-S, Daddi et al (2007) found a roughly linear relation between the stellar mass and SFR densities. For a given mass, the SFRD at was larger by factors of and relative to the star formaing galaxies at and respectively. This is roughly consistent with our results in the two highest mass bins in Figure 6. In the range , the observed 24 m wavelength corresponds to rest-frame m bands, sampling the PAH features which are most sensitive to the star forming galaxies. The agreement between or results and Daddi et al (2007) further implies that the potential selection bias against dusty star forming galaxies in our sample is not significantly affecting the estimated SFR densities.
By dividing our sample into three spectral types; ellipticals, spirals and starbursts, we study the evolution (with redshift) of the SFRD-Mass relation for each type. A striking feature, presented in Figure 7, is that the slope of the SFRD relations, found for different spectral types of galaxies are strong functions of the stellar mass. We find the massive galaxies, which are dominated by early-types, to significantly contribute to the total SFRD at earlier epochs (). This is expected as more massive galaxies are able to support higher rates of star formation than lower mass systems, all else being equal. For the intermediate mass systems, the contribution from early-type galaxies to the global SFRD is minimal, with no significant change with redshift. The relation for lower mass systems, which are dominated by spirals and starbursts, show a progressive build up of the stellar mass (i.e. increasing SFRD) with cosmic time. The results here imply that the stellar mass of galaxies plays a crucial role in determining their star formation activity and spectral types and governs the contribution of individual galaxies to the total SFRD.
7 Summary and Conclusion
Using multiwavelength data from the COSMOS survey we studied the dependence of the cosmic star formation density on redshift, stellar mass and spectral types. We explored the main parameters which govern the star formation process in galaxies. Our main results are summarized as follows:
-
•
There is a strong dependence of the SFRD on stellar mass of galaxies, with the most massive syatems (log) contributing least (by a factor of 5) to the cosmic SFRD at any given redshift.
-
•
Combining data from the COSMOS and GDDS, we extend the mass relation to . For high mass galaxies, we find a steep increase in this relation till . This implies that the massive galaxies seen today, went through intensive star formation activity at , to generate their current stellar mass. For the less massive systems, the relation flattens at , indicating that these systems are currently undergoing build up of their mass, with most of their stellar mass formed at lower redshifts ().
-
•
We study dependence of the SFRDmass relation on the spectral type of galaxies. We find that the slope of the SFRD relation for different spectral types is a strong function of their stellar mass. For low and intermediate mass systems, the main contribution to the cosmic SFR comes from the star-forming galaxies while, for more massive galaxies, older and redder galaxies are the most dominant population, with their contribution to the global SFRD increasing with redshift.
References
- Abraham et al. (2007) Abraham, R., et al. 2007, in “Galaxy Evolution across the Hubble Time,” Proceedings IAU Symposium No. 235, eds F. Combes & J. Palou
- Afonso et al. (2003) Afonso, J., Hopkins, A., Mobasher, B., Almeida, C. 2003, ApJ, 597, 269
- Baldry & Glazebrook (2003) Baldry, I. K., Glazebrook, K. 2003, ApJ, 593, 258
- Bell & de Jong (2001) Bell, E. F., de Jong, R. S. 2001, ApJ, 550, 212
- Bolzonella et al. (2000) Bolzonella, M., Miralles, J.-M., Pelló, R. 2000, A&A, 363, 476
- Brinchmann et al. (2004) Brinchmann, J., Charlot, S., White, S. D. M., Tremonti, C., Kauffmann, G., Heckman, T., Brinkmann, J. 2004, MNRAS, 351, 1151
- Bruzual & Charlot (2003) Bruzual, G., Charlot, S. 2003, MNRAS, 344, 1000
- Calzetti et al. (2000) Calzetti, D., Armus, L., Bohlin, R. C., Kinney, A. L., Koornneef, J., Storchi-Bergmann, T. 2000, ApJ, 533, 682
- Calzetti et al. (2007) Calzetti, D. 2007, in “Pathways through an Eclectic Universe”, ASP Conference Series, 2007, eds. J.H. Knapen, T.J. Mahoney, and A. Vazdekis (arXiv:0707.0467)
- Capak et al. (2007a) Capak, P., et al. 2007, ApJS, 172, 99
- Capak et al. (2007b) Capak, P., et al. 2007, ApJS, 172, 284
- Caputi et al (2006) Caputi, K. I.; McLure, R. J.; Dunlop, J. S.; Cirasuolo, M.; Schael, A. M. 2006, Mon. Not. R. Astr. Soc. 366, 609
- Coleman et al. (1980) Coleman, G. D., Wu, C.-C., Weedman, D. W. 1980, ApJS, 43, 393
- Cowie et al. (1996) Cowie, L. L., Songaila, A., Hu, E. M., Cohen, J. G. 1996, AJ, 112, 839
- Cram et al. (1998) Cram, L., Hopkins, A., Mobasher, B., & Rowan-Robinson, M. 1998, ApJ, 507, 155
- Daddi et al (2007) Daddi, E. et al astro-ph 07052831
- Dahlen et al. (2007) Dahlen, T., Mobasher, B., Dickinson, M., Ferguson, H. C., Giavalisco, M., Kretchmer, C., Ravindranath, S. 2007, ApJ, 654, 172
- Dickinson et al. (2004) Dickinson, M., et al. 2004, ApJ, 600, L99
- Ellison et al (2007) Ellison et al astro-ph 07114833
- Flores et al (1999) Flores, H., et al. 1999, ApJ, 517, 148
- Giavalisco et al. (2004) Giavalisco, M., et al. 2004, ApJ, 600, L103
- Glazebrook et al. (2005) Glazebrook, K., et al. 2005, in “Maps of the Cosmos,” Proceedings of IAU Symposium No. 216, eds. M. Colless, L. Staveley-Smith, R. Stathakis
- Gómez et al. (2003) Gómez, P. L., et al. 2003, ApJ, 584, 210
- Heavens et al. (2004) Heavens, A., Panter, B., Jimenez, R., Dunlop, J. 2004, Nature, 428, 625
- Hopkins (2004) Hopkins, A. M. 2004, ApJ, 615, 209
- Hopkins & Beacom (2006) Hopkins, A. M., & Beacom, J. F. 2006, ApJ, 651, 142
- Hopkins et al. (2003) Hopkins, A. M., et al. 2003, ApJ, 599, 971
- Hopkins et al. (2001) Hopkins, A. M., Connolly, A. J., Haarsma, D. B., Cram, L. E. 2001, AJ, 122, 288
- Juneau et al. (2005) Juneau, S., et al. 2005, ApJ, 619, L135
- Kaufmann et al. (2007) Kaufmann, T., Wheeler, C., Bullock, J. S. astro-ph 7060210
- Kinney et al. (1996) Kinney, A. L., Calzetti, D., Bohlin, R. C., McQuade, K., Storchi-Bergmann, T., Schmitt, H. R. 1996, ApJ, 467, 38
- Le Floc’h et al. (2005) Le Floc’h, E., et al. 2005, ApJ, 632, 169
- Lewis et al. (2002) Lewis, I., et al. 2002, MNRAS, 334, 673
- Li et al. (2007) Li, C., Kauffmann, G., Heckman, T., Jing, Y. P., White, S. D. M. astro-ph 07113792
- Madau et al. (1996) Madau, P., Ferguson, H. C., Dickinson, M. E., Giavalisco, M., Steidel, C. C., Fruchter, A. 1996, MNRAS, 283, 1388
- Mobasher et al. (2007) Mobasher et al. 2007 ApJ Suppl. 172, 117
- Panter et al. (2007) Panter, B., Jimenez, R., Heavens, A. & Charlot, S. 2007 Mon. Not. R. Astr. Soc 378, 1550
- Papovich et al. (2006) Papovich, C., et al. 2006, ApJ, 640, 92
- Salpeter (1955) Salpeter, E. E. 1955, ApJ, 121, 161
- Scoville et al. (2007a) Scoville, N. Z et al 2007a ApJ Suppl. 172, 1
- Scoville et al. (2007b) Scoville, N. Z et al 2007b ApJ Suppl. 172, 150
- Seymour et al. (2008) Seymour, N., et al., 2008, MNRAS, 386, 1695
- Strolger et al. (2004) Strolger, L.-G., et al. 2004, ApJ, 613, 200
- Sullivan et al. (2001) Sullivan, M., Mobasher, B., Chan, B., Cram, L., Ellis, R., Treyer, M., Hopkins, A. 2001, ApJ, 558, 72
- Zheng et al. (2007) Zheng, X. Z., Bell, E. F., Papovich, C., Wolf, C., Meisenheimer, K., Rix, H.-W., Rieke, G. H., Somerville, R. 2007, ApJ, 661 L41
| z | M⊙/yr/Mpc3 | M⊙/yr/Mpc3 |
|---|---|---|
| LF | simple sum | |