Further author information: (Send correspondence to S.B.)
S.B.: E-mail: sandrine@strw.leidenuniv.nl, Telephone: +31 (0)71 527 8433
The eSMA: description and first results
Abstract
The eSMA (“extended SMA”) combines the SMA, JCMT and CSO into a single facility, providing enhanced sensitivity and spatial resolution owing to the increased collecting area at the longest baselines. Until ALMA early science observing (2011), the eSMA will be the facility capable of the highest angular resolution observations at 345 GHz. The gain in sensitivity and resolution will bring new insights in a variety of fields, such as protoplanetary/transition disks, high-mass star formation, solar system bodies, nearby and high- galaxies. Therefore the eSMA is an important facility to prepare the grounds for ALMA and train scientists in the techniques.
Over the last two years, and especially since November 2006, there has been substantial progress toward making the eSMA into a working interferometer. In particular, (i) new 345-GHz receivers, that match the capabilities of the SMA system, were installed at the JCMT and CSO; (ii) numerous tests have been performed for receiver, correlator and baseline calibrations in order to determine and take into account the effects arising from the differences between the three types of antennas; (iii) first fringes at 345 GHz were obtained on August 30 2007, and the array has entered the science-verification stage.
We report on the characteristics of the eSMA and its measured performance at 230 GHz and that expected at 345 GHz. We also present the results of the commissioning and some initial science-verification observations, including the first absorption measurement of the C/CO ratio in a galaxy at =0.89, located along the line of sight to the lensed quasar PKS 1830211, and on the imaging of the vibrationally excited HCN line towards IRC+10216.
keywords:
Submillimeter; Instrumentation: interferometers, high angular resolution; Solar System: general; Stars: formation, protoplanetary disks, late-type, outflows; Galaxies: general, high-redshift1 INTRODUCTION
The submillimeter window is critically important for astronomy because it probes cold and dense environments whose spectral energy distribution peaks in this wavelength range. Moreover, the submillimeter window offers unique access to numerous high-excitation lines of molecules. With its dry atmosphere, Mauna Kea is a privileged location to open this window and peer into the dense, dust-enshrouded regions of the Universe. The Caltech Submillimeter Observatory (CSO) and James Clerk Maxwell Telescope (JCMT) were among the first submillimeter facilities worldwide and have allowed astronomers to obtain novel results with undiminished success since their first-light on Mauna Kea in the mid-eighties.
Despite their numerous advantages, these single-dishes have a limited angular resolution and the SubMillimeter Array (SMA), the first imaging interferometer at submillimeter wavelengths, was built on Mauna Kea with the goal of providing high-angular resolution observations in this regime. The SMA consists of 86-m dishes provided by the Smithsonian Astrophysical Observatory (SAO, USA) and ASIAA (Taiwan). Following the successful realization of using the 10.4-m CSO and 15-m JCMT as a two-antenna interferometer (1992-1995, see Ref. 1, 2), it was foreseen, as the first SMA antennas were brought to Mauna Kea almost a decade ago, to combine the SMA with the JCMT and the CSO into an “extended SMA” or eSMA, providing enhanced sensitivity and spatial resolution compared with the SMA. The JCMT-SMA Memorandum of Understanding was signed in 2001; the CSO later agreed to join the project. Over the last two years, there has been substantial progress toward making the eSMA into a working interferometer.
The eSMA is now in a position to start fully exploiting the advantages which motivated the three individual observatories to embark on this joint venture:
-
•
Increased resolution: With the CSO in the array, the longest baseline extends to 782 m, compared to 509 m for the SMA in very-extended configuration. This corresponds to an angular resolution better than at 345 GHz.
-
•
Increased sensitivity: The addition of the CSO and JCMT doubles the collecting area of the SMA alone from 226 to 488 m2. Together with dual polarization (and depending on the assumptions made for the values of the system temperatures in Eq. 7 of Appendix B), this provides an improvement of up to a factor of in observing speed, compared to the current, single polarized SMA. Moreover, this extra collecting area is located on the longest baselines / highest angular resolution, where it is most critically needed.
In this paper, we describe the technical challenges encountered in the process of joining the CSO and JCMT to the SMA, outline some sciences objectives, and present the first results obtained with this facility.
2 TECHNICAL DESCRIPTION
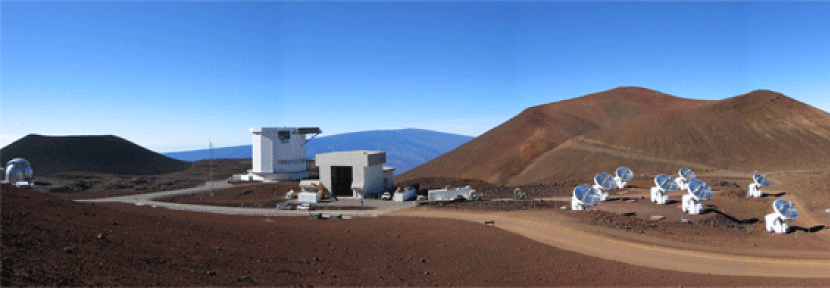
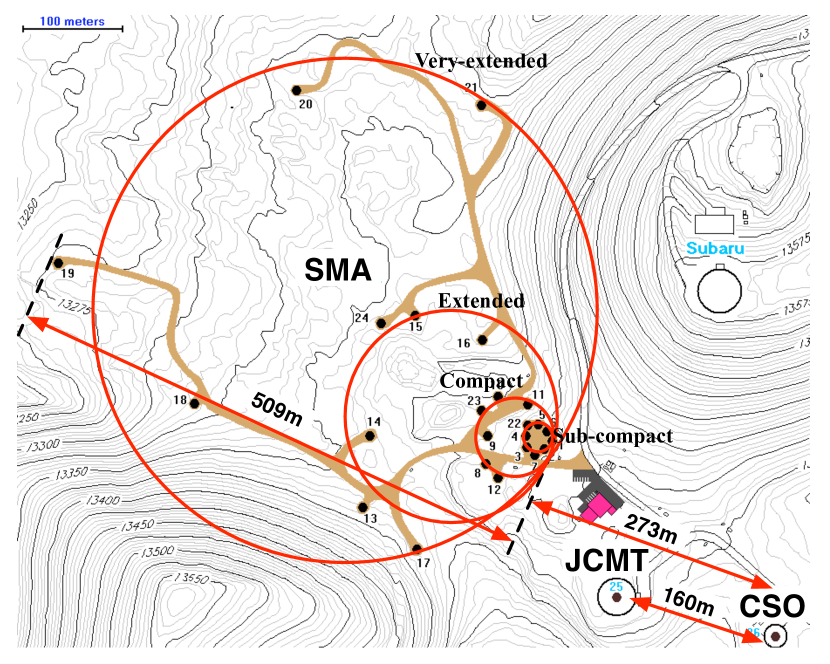
The CSO, JCMT and SMA, which together make the eSMA, are pictured in the left panel of Fig. 1, while the right panel shows the locations of the JCMT and CSO and the pad-positions for the SMA antennas. In this section, we describe the hardware and operational issues inherent to the eSMA, as well as some of the tests that have been carried out to try and solve the problems intrinsic to this heterogeneous array. Note that although the eSMA is designed to operate in the 320-355 GHz window, the testing to date has been done at lower frequencies (230-270 GHz).
2.1 Hardware
2.1.1 Adding the JCMT and CSO to the SMA array
Sumitomo single mode fibers were pulled from the SMA control building
and spliced into the existing fiber between the CSO and JCMT in
2000. These fibers distribute the LO reference signals from the SMA to
the CSO and JCMT receivers and carry the returning IF signal back to the
SMA correlator.
In addition, multi-mode fiber bundles were installed
for computer communications and control.
Following the commissioning of the SMA itself,
SMA IF/LO conditioning and control electronics were
duplicated and installed at the CSO and the JCMT.
The above steps were absolutely necessary in order to have
identical LO chains for all the telescopes involved, which
is essential for eSMA operations, as a fixed cable length is assumed
in the correlation.
Furthermore,
the fibers and
attached equipment have been configured to reside within the SMA
network, transparently extending the array to include the CSO and
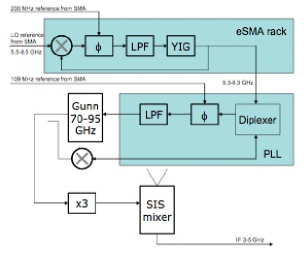
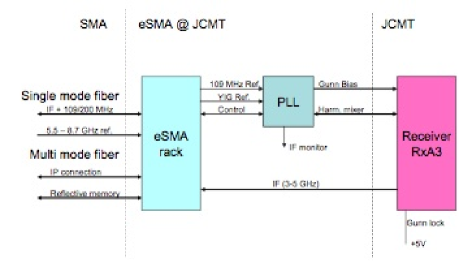
JCMT antennas. Schematic views of the LO/PLL circuit and of the
crate connections are shown in Fig. 2.
SMA control to the JCMT and the CSO is channeled through dedicated computers at each telescope. The dedicated computers also control the SMA specific IF/LO conditioning electronics. They receive commands through Remote Procedure Call (RPC) and reflective memory, which is also used to report back the antenna status. With only minor differences, control of the SMA Antenna equipment at the JCMT and CSO is identical to the rest of the array. However, the receivers, telescope, and control software of the JCMT and CSO are different from those at the SMA and each other and require a custom interface. A simplified ASCII command set, implementable via e.g. a serial line connection, was designed as the common interface between the observatories. This effectively allows the SMA to take remote control of the JCMT and CSO and monitor status information such as tracking errors. The latter is important because the different telescopes have different slew-rates and cable-wraps, resulting in a different routing and arrival time on target; individual baselines are flagged until both telescopes are on target. Using the interface the SMA can also control e.g. the switching of loads in front of the receivers in order to carry out calibrations. The implementation of the full interface command-set is ongoing as of summer 2008.
The eSMA required a modification of the correlator software at the SMA. As the SMA is designed to operate in dual-frequency mode with 8 antennas, there is enough hardware for running the eSMA 10-antenna single-frequency configuration (45 baselines). Since August 2007, the eSMA has been observing successfully with all 45 baselines.
2.1.2 Heterogeneous array issues
For all practical purposes, the SMA antennas are identical, so that telescope-specific issues typically cancel out. The CSO and JCMT, however, are of a completely different design resulting in a more complicated situation requiring special corrective measures.
Heterodyne receivers used in submillimeter astronomy observe a single linear polarization and, because of the different optical configuration, each type of telescope observes a different polarization while pointed to the same target. To correct for this half-wave plates are installed in the beam at the CSO and JCMT that automatically rotate to a common polarization as a function of elevation.
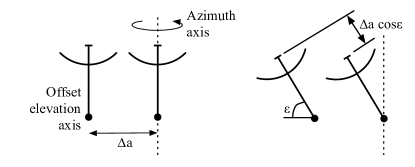
The rotation of the plates introduces elevation dependent phase terms. Additional elevation dependent phase terms arise from purely mechanical issues. Examples are a pronounced non-intersection of axes term at the CSO and a measureable drop of the elevation axis at the JCMT when moving from horizon to zenith. Unfortunately such phase terms are degenerate with regular baseline terms and their separation is time-consuming, requiring dedicated and repeated tracking of sources differing e.g. only in elevation (see section 2.3). Presently the eSMA is converging towards the required maximum residual baseline uncertainty of 0.1 mm.
The observing software at the SMA also required modifications to take the differences between the telescopes into regard: e.g. for interferometric pointing observations the smaller beams of the CSO and JCMT need to be accounted for.
2.2 eSMA operations
Operations of the eSMA are completely controlled from the SMA side. The SMA is typically staffed during the first half of the night and during the second half, it is controlled completely remotely either from Cambridge, Massachusetts (4 out of 5 weekdays) or from Taipei, Taiwan (1 out of 5). However, neither the CSO nor the JCMT are set up for the level of remote, un-attended observing as is usual for the SMA. Currently during eSMA commissioning both the CSO and JCMT are independently staffed. Once the commissioning has finished it is expected to support eSMA observations with a single shared team for the CSO and JCMT. The requirement for such a team to remain available at the summit throughout the night will likely be dictated more by security and safety issues than technical constraints.
2.3 Baselines effects
As mentioned in section 2.1.2, a significant amount of time has been spent during the testing phase to perform necessary array calibration observations. These observations are designed to determine accurately the relative positions of the individual elements (“baselines”) along with antenna-dependent terms (non-intersection of the axes, etc.). All these terms affect in particular the ability to transfer phase calibration solutions from calibrators to target sources and therefore, ultimately, our ability to accurately image a region in the sky. To prevent this potential issue, these baseline- and antenna-dependent terms must be determined to a fraction of a wavelength (typically 0.1 mm).
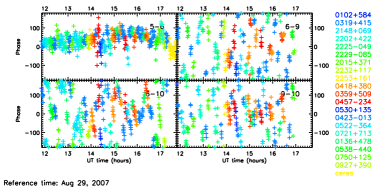
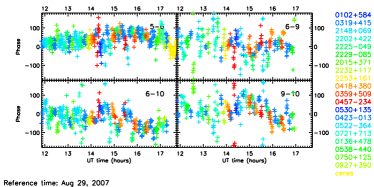
For an homogeneous array, the relative antenna positions are typically obtained from observations of unresolved calibration sources for which the positions are known. The phase of such calibrators should ideally be zero but due to the uncertainties in the positions, it is in fact given by Eq. 1 of Appendix A.1. Observations of sources spanning a large range of hour angles and declinations hence allow us to derive the uncertainties in the , and respectively. Figure 3 shows the effect of solving for the relative positions. The initial values found from these August 29, 2007 observations were (, , ) = 10.25, 8.53, 14.11 mm and 8.82, 3.14, 22.96 mm for the JCMT and CSO, respectively.
 |
 |
However, for an heterogeneous array, these solutions are degenerate as they encompass antenna-dependent terms as well as the relative positions. Therefore, additional tests have been performed, for which a carefully chosen subset of quasars have been observed. For example, a pair of quasars with similar right ascension but opposite declination can allow determination of elevation effects (e.g. those due to the non-intersection of the azimuth and elevation axes – see Appendix A.2). Indeed, in this case, the difference between the phases of two such quasars is independent of the uncertainties in the and positions and can be fitted with elevation terms only.Another appropriate choice is a pair with similar declination and different R.A. In this case, using the functional form of the dependence of the phase on the elevation derived with the first pair of quasars, this second pair then provides a good solution for the and positions.
2.4 eSMA properties and (expected) performances
Table 1 summarizes the capabilities of the eSMA in comparison with the SMA alone, both in single (sp) and dual (dp) polarization modes. Estimates for the sp mode were obtained from the SMA sensitivity calculator: http://sma1.sma.hawaii.edu/beamcalc.html, assuming a frequency of 345 GHz, 6.7 hr of on-source integration time (H.A.=5), a source declination of 25∘, and good atmospheric conditions (pvw=1.5 mm). Factors between sp and dp modes can be found in Appendix B.
| Array | eSMAsp | eSMAsp | eSMAdp | SMAsp | SMAdp |
| (Band in GHz) | (230) | (345) | (345) | (230) | (345) |
| Frequency range (GHz) | 210–280 | 315–380 | 320–355 | 272–349 | 320–355 |
| Number of baselines | 45 | 45 | 28 | 28 | 28 |
| Total collecting area (m2) | 488 | 488 | 431 | 226 | 226 |
| Longest baseline (m) | 782 | 509 | |||
| Resolution (arcsec) | 0.220.55 | 0.180.32 | 0.240.32 | ||
| Resolution (AU at 150 pc) | 30-80 | 25-50 | 35-50 | ||
| Continuum (mJy/beam) | 2.1 | 1.1 | 0.9 | 2.3 | 1.6 |
| Line (K per 1 km/s channel) | 12.4 | 5.6 | 4.6 | 10.7 | 7.6 |
notes. — (i) sp and dp denote single and dual polarization modes respectively ; eSMAsp is 86 m + 10.4 m + 15 m while eSMAdp is 66 m + 10.4 m + 15 m (see text for details). (ii) Resolutions are given for uniform weighting and sensitivities for natural weighting. — (iii) Bold characters denote values measured for the 7-hr track on PKS 1830211 (see Sec. 5.1); note that those data were obtained under worse (pvw3-4 mm) weather conditions than assumed for the estimates, and were reduced using uniform weighting.
Note that the eSMA currently operates in single polarization mode. The JCMT has the capability to combine with the SMA in dual polarization, once the SMA will be fully equipped with the appropriate receivers. Within one or two years the CSO may also have that capability. In the event of dual-polarization observations with the eSMA, two SMA antennas will have to be dropped from the array due to correlator capacities.
3 SCIENCE OBJECTIVES
The eSMA will address a number of key issues in a large range astrophysics topics, from Solar System objects and galactic low- and high-mass star-forming regions to high- galaxies. Science projects that will benefit the most from eSMA compared with the SMA alone are those that fall into the following categories: (i) detecting and imaging faint continuum sources (of order a few mJy) at subarcsec resolution; (ii) detecting and imaging thermal ( 30 K) lines tracing dense gas at subarcsec resolution; (iii) providing larger samples of moderately bright sources for statistical analysis; and (iv) providing the best possible data on key template sources prior to ALMA as a reference.
Examples of science cases where the eSMA will have an impact have been
described in a report of a workshop held at Leiden Observatory, the Netherlands
in early 2007. Information can be found at:
http://www.leidenuniv.nl/bottinelli/esma-workshop/report_esma_workshop.pdf.
These science cases include the following:
-
•
Solar System objects. — The high sensitivity and angular resolution of eSMA will enable important studies of Solar System objects to be carried out, such as comets, Kuiper Belt Objects (KBOs), trans-Neptunian objects and Centaurs. These objects are likely to consist of the most unaltered matter from the Solar Nebula (see Ref. 3, and references therein), and are therefore essential to our understanding of the young Solar System. In particular, areas in which eSMA observations will provide crucial information are: (i) jet features from the nuclei of comets; (ii) atmospheric composition of, e.g., Pluto, Triton, KBOs; (iii) spatial variability in Io’s atmosphere and the potential link with volcanic mechanisms; (iv) kinematics of atmospheres (presence of “winds”, e.g. in Titan); (v) light-curves of asteroids.
-
•
Protoplanetary disks.— Circumstellar disks are an ubiquitous feature occurring in the star formation process, due to the conservation of angular momentum as the ISM condenses from cloud core to protostellar scales. Planet formation begins in the gas-rich disks around young pre-main sequence stars. The density, temperature and velocity distribution of these disks critically determines the growth of dust particles, affects the chemistry and coagulation of planetesimals, and controls the gas accretion and orbital migration of massive planets. Recent observations and modeling show that the combination of spatially resolved imaging and spectra at infrared and millimeter wavelengths is needed to make advances in this area.
The eSMA will have the sensitivity, dynamic range and resolution to enable the study of large and diverse samples of protoplanetary disks, leading to key constraints on theoretical models of disk structure. Three areas in which the eSMA will be particularly powerful include: (i) benchmarking the nearest disks prior to ALMA; (ii) young disks in the embedded phase of star formation, where the high angular resolution and sensitivity is needed to separate disks and envelopes; and (iii) transitional disks with large inner holes, perhaps indicative of planet formation. For embedded sources, they will also shed light onto the launching mechanism of the outflows and their relation to the properties of the disks.
-
•
High-mass star formation. — The eSMA will help answer several key questions in this area: (i) clustered star formation and the IMF; (ii) circumstellar kinematics on 1000 AU scales; (iii) pre-stellar phases.
The eSMA is very well suited to address these issues. Its high angular resolution is essential to separate individual sources in distant (few kpc), crowded protostellar clusters, or to map the structure and kinematics of the pre-stellar cores on scales on which fragmentation is expected to occur. Its high sensitivity is essential to measure a large range of masses and thus get a good sampling of the protostellar mass distribution. Moreover, its high operating frequency makes for a better mass sensitivity per unit flux density. Finally, in addition to providing mass determination from the continuum, eSMA observations of line emission (such as CH3OH, SiO, HCN, ions and deuterated species) could be used to measure the temperatures and densities of the sources, trace their molecular outflows, and measure their mid-infrared radiation field, that is, to pinpoint physical and chemical condition in the cores. -
•
Evolved stars. — Studying the later stages of stellar evolution is important for an understanding of stellar populations and the chemical enrichment of galaxies, as well as the life cycle of stars and matter. With its high spatial-resolving power at 345 GHz, the eSMA will be an excellent facility to map the dust and kinematics in the envelopes of late-type stars, as well as investigate the magnetic field of their outflows.
-
•
Nearby Galaxies: starbursts, mergers, and AGN. — Activity in galaxies is attributed to two main phenomena: extended starbursts and accretion onto a central supermassive black hole to form an active galactic nucleus (AGN). Both types of activity are fed by massive reservoirs of molecular gas and both may significantly affect their surrounding clouds through their strong radiation fields. Studying the molecular gas in active galaxies requires both high angular resolution and high sensitivity, even for very nearby AGN and starburst galaxies. The eSMA will be of great help to tackle this task by bringing new information in several topics: (i) separating AGN and starburst activity in Ultra-luminous infrared galaxies (ULIRGs); (ii) physical and chemical conditions of dense molecular gas in the heart of ULIRGs; (iii) excitation conditions in nearby active galaxies; (iv) detailed views of the inner few hundred parsec of nearby galaxies.
An important aspect of this program will be to combine new eSMA observations with existing SMA data to trace the emission on a broad range of spatial scales. Also, the high spatial resolution of the eSMA will make it possible, for the first time, to match molecular line observations to near-infrared ionic line observations in nearby galaxies.
-
•
High-redshift galaxies.— Submillimeter studies of high-redshift galaxies have been a key area of activity for all three of the observatories involved in the eSMA. Five topics have been identified where the eSMA can provide important new insights into the properties and nature of the important population of high-redshift submillimeter galaxies (SMGs): (i) Exploring the far-IR/radio correlation on kpc scales at high redshift; (ii) Beyond the confusion limit: imaging SMGs representative of the cosmic far-IR background; (iii) Imaging cold dust reservoirs in massive high-redshift AGN: witnessing the birth of massive ellipticals; (iv) Imaging bright SMGs with multiple radio counterparts: testing simulations of galaxy-galaxy mergers; (v) Imaging SMGs without radio counterparts: is there a significant population of distant, massive starbursts?
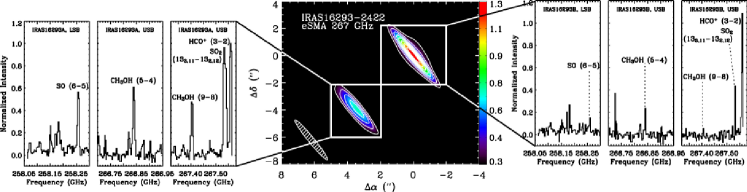
4 FIRST eSMA IMAGE OF A SCIENCE OBJECT: IRAS16293–2422
IRAS16293–2422 (hereafter IRAS16293) is a well-known young, solar-mass protostar, which consists, at arcsec resolution level, of two main components (IRAS16293A and IRAS16293B). IRAS16293 was observed on 2008 March 13 with the SMA in the compact configuration. Despite the far from optimal eSMA beam, the eSMA team chose to proceed with the observations because the good weather conditions and sufficient brightness of IRAS16293 would allow the data to be self-calibrated, thereby obtaining the first science-verification data.
Figure 4 shows the continuum as observed by the eSMA at 267 GHz. Although the absolute astrometry is lost in the process of self-calibration, the relative positions of the two components are consistent with the literature. Moreover, despite the facts that no high-spectral resolution data could be taken and that flux calibration could not be performed, the spectra displayed in Fig. 4 reproduce qualitatively well the particularities reported in the literature for this source, namely that the SE component (the weaker component in the continuum in the 1 mm wavelength range) has broader and stronger lines than the NW component[4, 5, 6] (Note that HCO+ seems brighter in the NW component, but this is probably due to the fact that this line is located near the edge of a band).
 |
5 FIRST SCIENTIFIC RESULTS
5.1 PKS 1830211: first direct absorption measurement of C/CO in a normal galaxy
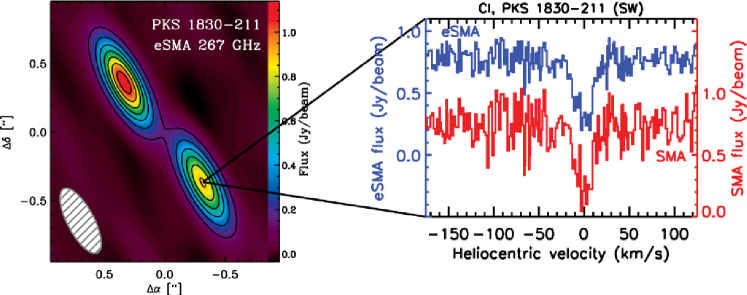
PKS 1830211 is a radio loud quasar with a redshift of = 2.507 [7]. Millimeter continuum emission images of PKS 1830211 show two compact components, north-east (NE) and south-west (SW), separated by . This double-peaked structure represents two images of the background quasar, magnified and distorted by a lensing system at = 0.88582 [8]. This lens was indirectly detected by the observations of broad H i and molecular absorptions in the millimeter spectra of PKS 1830211 (e.g., Ref. 8, 9, 10). Ref. 9 suggested it to be a spiral galaxy, which was recently confirmed by direct HST and IR images [11, 12]. Observations of absorption lines reported in Ref. 9, 13 show that the molecular absorption is most conspicuous towards the SW component, with only a weaker absorption feature detected in association with the NE component.
As shown by previous studies, the line of sight towards PKS 1830211 offers a
unique opportunity to study the physics and chemistry of the gas in
a random molecular cloud in
the lensing galaxy. Although several molecular species (CO, CS, HCN,
HNC, HCO+, H2S, H2CO, N2H+, and some of their
isotopologues) have been detected in this source, little is know about
the atomic content. However, this is important as atoms play a
dominant role in the energy balance of the gas, and observations of
atomic species such as C i can be used to determine the physical and
chemical conditions of the gas.
In particular, the [C i]/[CO] is often used as a diagnostic of the
type of PDRs from which they originate,
but such analyses refer to
emission line data averaged over large areas and suffer
from radiative transfer and excitation effects. The current eSMA data probe
the C/CO abundance ratio directly for the first time in absorption in
a dense molecular cloud.
Such a measurement has not yet been possible in our own Galaxy because of
the difficulty of doing subarcsec interferometry at 492 GHz. The C/CO
ratio is also an important ingredient for testing models for the formation
of more complex carbonaceous molecules.
5.1.1 eSMA observations
Observations of PKS 1830211 ((2000) = , (2000) = ) were carried out with the eSMA on 2008 April 14 (with eight SMA antennas in the very-extended configuration, vex), targeting the (3PP0) transition of C i at a rest frequency of 492.161 GHz. Table 2 summarizes the observed frequencies, spectral resolution, and resulting beam sizes. See Ref. 14 for a description of the data calibration and reduction process.
| Parameter | C i, eSMA | continuum, eSMA | continuum, SMA |
|---|---|---|---|
| Observed frequency (GHz)a | 260.97965 | 267 | 267 |
| Channel width | 0.93 km s-1 | 2 1.5 GHzb | 2 2 GHz |
| Beam size (FWHM) and P.A. | , | , | , |
a Corresponding to a rest frequency of 492.16065 GHz, from , with = 0.88582.
b Note that in the 230 GHz band, the eSMA bandwidth is limited by that of the JCMT’s receiver A3.
5.1.2 Results
The left panel of Fig. 5 shows the continuum map obtained with the eSMA, derived from line-free channels. C i absorption is only seen toward the southern component as shown in the right panel of Fig. 5. This illustrates the importance of sub-arcsecond data: the optical depth determination could be off by more than a factor of 2 if the two components were unresolved. Moreover, the comparison of the profiles obtained with the eSMA and SMA-only displayed in the right panel of Fig. 5 clearly shows the gain in sensitivity provided by the eSMA.
Together with additional SMA observations of CO absorption, we therefore obtained the first absorption measurement of the C/CO abundance ratio for an average line of sight in a dense molecular cloud in a normal spiral galaxy. A preliminary analysis indicates that the line profiles can be fitted with 2 or 3 components, each of which have a C/CO ratio of 1. This value indicates that the region of the lensing spiral galaxy at =0.889 intervening in the line of sight is mostly translucent cloud material.
5.2 IRC+10216
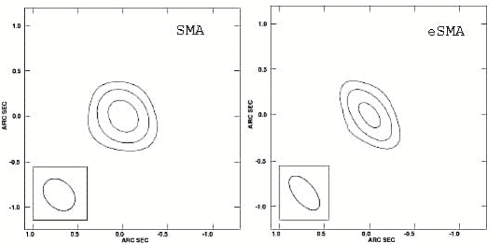
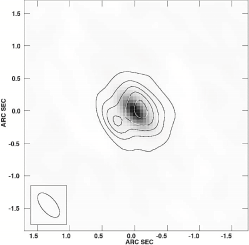
IRC+10216 is the best-studied carbon star that shows a very rich spectrum of molecular lines at millimeter and submillimeter wavelengths. Hydrogen cyanide (HCN) is known to show maser components towards a few carbon-rich evolved stars including IRC+10216. Previous observations at the CSO revealed that the HCN higher transition () of IRC+10216 even shows laser action [15]. eSMA observations of IRC+10216 were performed on 2008 April 14, with the correlator tuned to target the HCN components in the =(0,1,0) state[16]. The left and middle panels of Fig. 6 show a comparison of the continuum images taken with the SMA and with the eSMA, respectively. Signal-to-noise is improved by about 67% when we use the eSMA. The observations allowed us to spatially resolve the maser clump features for the first time as shown in the right panel of Fig. 6.
 |
 |
6 CONCLUSION
In the past two years, substantial progress has been achieved to make the eSMA into a fully functional instrument. Thanks to the dedication and commitment of the commissioning team and of all three observatories, the eSMA is now moving in the fast lane towards harvesting exciting new results, as demonstrated by the first scientific output of this array. Moreover, the numerous scientific areas to which the eSMA can make a significant contribution provide a bright perspective for the coming years.
Appendix A Phase dependence on baseline components and antenna-dependent terms
A.1 Baseline components (positions)
The phase of antenna , w.r.t. the reference antenna is given by:
| (1) |
where , and = declination, hour angle and elevation of the source, are the uncertainties in the positions of antenna .
A.2 Antenna-dependent terms: elevation
Elevation terms can be added to equation 1, assuming they are of the generic form , we have:
| (2) |
We expect that the phase variations proportional to are dominated by the non-intersection of the axes (see Fig. 7), we identify with the distance between the azimuth and elevation axes of antenna , absorbing any other (smaller) effects with a dependency into this term.
Now, if we look at the phase difference for two quasars and :
| (3) |
For Eq. 3 to be independent of the and terms, a pair of two quasars are observed, such that and , which yields and . We are left with the and terms and Eq. (3) yields:
| (4) |
Appendix B Sensitivity ratios for dual vs single polarization with the eSMA
In this section, we assume that the SMA, JCMT and CSO antennas are the same, except for their diameter (8, 15 and 10.4 m respectively) and their aperture efficiency, (0.67, 0.55 and 0.60 respectively).
For a homogeneous array, assuming a fixed integration time and bandwidth, the noise level is such that:
| (5) |
where is the system temperature,
is the effective aperture,
the aperture efficiency, the geometric collecting area,
the diameter of the antenna,
is the number of baselines, the number of antennas,
and = 1 or 2 for single or dual polarization respectively.
For a heterogeneous array, the denominator changes to the geometric mean over the antennas:
| (6) | |||||
| (7) |
where
are the number of SMA-SMA, SMA-JCMT, SMA-CSO and JCMT-CSO baselines, and
are the effective apertures of the SMA, JCMT
and CSO antennas and are 18.94, 97.19 and 50.97 m2 respectively.
Assuming identical for all antennas as a 0th order approximation,
and using the relevant values in Tab. 3 for the number of baselines,
we therefore obtain the following noise level ratios:
eSMAdp / eSMAsp = 0.83,
SMAdp / SMAsp = 0.71, and
eSMAdp / SMAsp = 0.43,
corresponding approximately to an improvement in observing speed of a factor of 1.5, 2, and
5, respectively.
| SMA-SMA | SMA-JCMT | SMA-CSO | JCMT-CSO | Total | |
|---|---|---|---|---|---|
| eSMAsp | 87/2 = 28 | 8 | 8 | 1 | 45 |
| eSMAdp | 65/2 = 15 | 6 | 6 | 1 | 28 |
| SMAsp | 87/2 = 28 | 0 | 0 | 0 | 28 |
| SMAdp | 87/2 = 28 | 0 | 0 | 0 | 28 |
a Configuration: note that due to correlator limitations, only six SMA antennas can be used for the eSMA dual polarization mode.
Acknowledgements.
A number of people made the eSMA technically possible. We would like to thank all of them for their involvement and dedication, in particular (but not limited to) Mark Bentum, Ken Brown, Jane Buckle, Todd Hunter, Leo de Jong, Derek Kubo, Rob Millenaar, Alison Peck, Glen Petitpas, Anthony Schinkel. We also thank all the Leiden workshop participants for stimulating discussions and for sharpening the eSMA science case, in particular the panel leaders Darek Lis, Jonathan Williams, Floris van der Tak, Christine Wilson, Wouter Vlemmings and Rob Ivison. We are grateful to Ronald Stark for continued support and encouragement. And last but not least, we are very much indebted to Ray Blundell, Gary Davis and Tom Phillips, the directors of the SMA, JCMT and CSO, without whom the eSMA would not be. The development of the eSMA has been facilitated by a grant from the Netherlands Organization for Scientific Research, NWO and NSF grant AST-0540882 to the Caltech Submillimeter Observatory.References
- [1] Lay, O. P., Carlstrom, J. E., Hills, R. E., and Phillips, T. G., “Protostellar accretion disks resolved with the JCMT-CSO interferometer,” Astrophys. J. Lett. 434, L75–L78 (Oct. 1994).
- [2] Lay, O. P., Carlstrom, J. E., and Hills, R. E., “NGC 1333 IRAS 4: Further Multiplicity Revealed with the CSO-JCMT Interferometer,” Astrophys. J. Lett. 452, L73+ (Oct. 1995).
- [3] Bockelée-Morvan, D., Lellouch, E., Biver, N., Paubert, G., Bauer, J., Colom, P., and Lis, D. C., “Search for CO gas in Pluto, Centaurs and Kuiper Belt objects at radio wavelengths,” Astr. Astrophys. 377, 343–353 (Oct. 2001).
- [4] Bottinelli, S., Ceccarelli, C., Neri, R., Williams, J. P., Caux, E., Cazaux, S., Lefloch, B., Maret, S., and Tielens, A. G. G. M., “Near-Arcsecond Resolution Observations of the Hot Corino of the Solar-Type Protostar IRAS 16293-2422,” Astrophys. J. Lett. 617, L69–L72 (Dec. 2004).
- [5] Kuan, Y.-J., Huang, H.-C., Charnley, S. B., Hirano, N., Takakuwa, S., Wilner, D. J., Liu, S.-Y., Ohashi, N., Bourke, T. L., Qi, C., and Zhang, Q., “Organic Molecules in Low-Mass Protostellar Hot Cores: Submillimeter Imaging of IRAS 16293-2422,” Astrophys. J. Lett. 616, L27–L30 (Nov. 2004).
- [6] Bisschop, S. E., Jorgensen, J. K., Bourke, T. L., Bottinelli, S., and van Dishoeck, E. F., “An interferometric study of the low-mass protostar IRAS 16293-2422: small scale organic chemistry,” ArXiv e-prints 807 (July 2008).
- [7] Lidman, C., Courbin, F., Meylan, G., Broadhurst, T., Frye, B., and Welch, W. J. W., “The Redshift of the Gravitationally Lensed Radio Source PKS 1830-211,” Astrophys. J. Lett. 514, L57–L60 (Apr. 1999).
- [8] Wiklind, T. and Combes, F., “The redshift of the gravitational lens of PKS1830-211 determined from molecular absorption lines,” Nature 379, 139–141 (Jan. 1996).
- [9] Wiklind, T. and Combes, F., “The Complex Molecular Absorption Line System at Z = 0.886 toward PKS 1830-211,” Astrophys. J. 500, 129–+ (June 1998).
- [10] Gérin, M., Phillips, T. G., Benford, D. J., Young, K. H., Menten, K. M., and Frye, B., “Redshifted Molecular Absorption Systems toward PKS 1830-211 and B0218+357: Submillimeter CO, C i, and H 20 Data,” Astrophys. J. Lett. 488, L31+ (Oct. 1997).
- [11] Courbin, F., Meylan, G., Kneib, J.-P., and Lidman, C., “Cosmic Alignment toward the Radio Einstein Ring PKS 1830-211?,” Astrophys. J. 575, 95–102 (Aug. 2002).
- [12] Winn, J. N., Kochanek, C. S., McLeod, B. A., Falco, E. E., Impey, C. D., and Rix, H.-W., “PKS 1830-211: A Face-on Spiral Galaxy Lens,” Astrophys. J. 575, 103–110 (Aug. 2002).
- [13] Muller, S., Guélin, M., Dumke, M., Lucas, R., and Combes, F., “Probing isotopic ratios at z = 0.89: molecular line absorption in front of the quasar PKS 1830-211,” Astr. Astrophys. 458, 417–426 (Nov. 2006).
- [14] Bottinelli, S., et al.. Astrophys. J. Lett. , in preparation (2008).
- [15] Schilke, P., Mehringer, D. M., and Menten, K. M., “A Submillimeter HCN Laser in IRC +10216,” Astrophys. J. Lett. 528, L37–L40 (Jan. 2000).
- [16] Shinnaga, H., et al.. Astrophys. J. , in preparation (2008).
- [17] Lay, O. P., PhD thesis, University of Cambridge (1995).