The AAT/WFI survey of the Monoceros Ring and Canis Major Dwarf galaxy: II. from l = (280 - 025)∘
Abstract
This paper concludes a systematic search for evidence of the Monoceros Ring and Canis Major dwarf galaxy around the Galactic Plane. Presented here are the results for the Galactic longitude range of l = (280 - 025)∘. Testing the claim that the Monoceros Ring encircles the entire Galaxy, this survey attempts to document the position of the Monoceros Ring with increasing Galactic longitude. Additionally, with the discovery of the purported Canis Major dwarf galaxy, searching for more evidence of its interaction is imperative to tracing its path through the Galaxy and understanding its role in the evolution of the Milky Way. Two new detections of the Monoceros Ring have been found at (l, b) = (280,15)∘ and (300,10)∘. Interestingly, in general there seem to be more detections above the Plane than below it; in this survey around of the firm Monoceros Ring detections are in the North. This coincides with the Northern detections appearing to be qualitatively denser and broader than their Southern counterparts. The maximum of the Galactic Warp in the South is also probed in this survey. It is found that these fields do not resemble those in the Canis Major region suggesting that the Warp does not change the shape of the CMD as is witnessed around Canis Major. The origins and morphology of the Monoceros Ring is still elusive primarily due to its enormous extent on the sky. Continued probing of the Galactic Outer Disc is needed before a consensus can be reached on its nature.
keywords:
Galaxy: formation – Galaxy: structure – galaxies: interactions| Fields (l,b)∘ | Regions per field | Average Seeing (arcsec) | Total Area () | Monoceros Ring | Average E(B-V) | Date (dd/mm/yy) |
|---|---|---|---|---|---|---|
| (280,15)∘ | 4 | 1.3 | 1.21 | No | 0.128 | 01/02/04 |
| (280,15)∘ | 3 | 1.0 | 0.93 | Yes | 0.083 | 25,30/01/04 |
| (300,20)∘ | 1 | 1.3 | 0.3 | No | 0.109 | 31/01/04 |
| (300,10)∘ | 3 | 1.2 | 0.93 | Yes | 0.171 | 25/01/04 |
| (340,20)∘ | 4 | 2.8,1.6 | 0.91 | No | 0.095 | 15-16/08/05 |
| (350,20)∘ | 4 | 2.2 | 0.91 | No | 0.055 | 15/08/05 |
| (350,20)∘ | 4 | 1.4 | 0.91 | No | 0.112 | 16/08/05 |
| (025,20)∘ | 5 | 2.0 | 1.14 | No | 0.137 | 15-16/08/05 |
| (025,20)∘ | 5 | 2.0 | 1.14 | No | 0.098 | 15-16/08/05 |
1 Introduction
The Monoceros Ring (MRi), discovered in 2002 (Newberg et al., 2002) has now been traced around the Galaxy from l = 75 - 260∘, as shown through the Sloan Digital Sky Survey (Newberg et al., 2002), Two-micron All Sky Survey (Rocha-Pinto et al., 2003), Isaac Newton Telescope Wide Field Camera Survey (Ibata et al., 2003) and the Anglo-Australian Telescope Wide Field Imager Survey (Conn et al., 2005a). Continuing around the Galactic plane, this survey extends these previous results to complete the first Wide Field Imager survey of the MRi around the Galaxy that began with the INT/WFC in Conn et al. (2005a). Studies into this structure have been discussed in Paper I of this series, (Conn et al., 2007), and references therein. Additional to this, an RR-Lyrae survey of the Galactic Halo using QUEST data has also revealed the presence of the MRi and investigated the overdensity in Canis Major (Vivas & Zinn, 2006; Mateu et al., 2007).
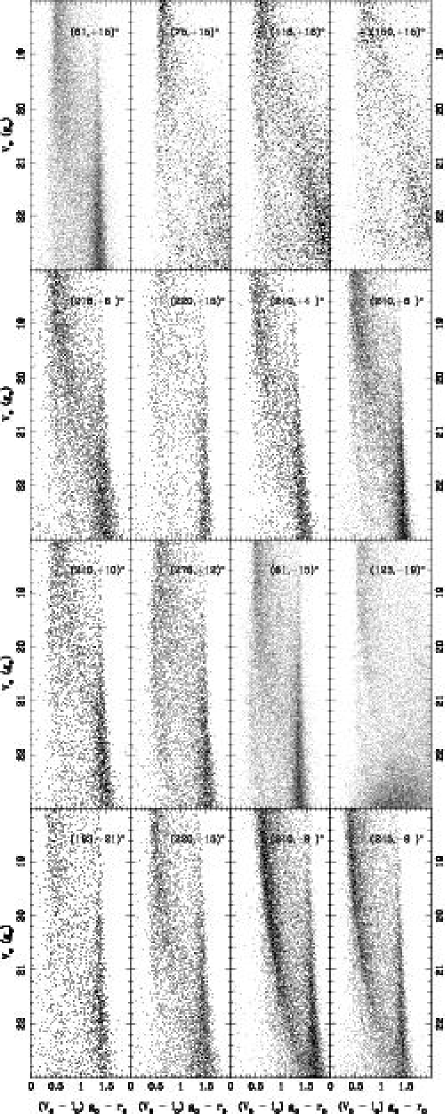
Residing in the Thick Disc of the Milky Way (MW), the MRi is revealed only by obtaining deep photometry of large patches of sky, typically greater than 1 square degree. In this preliminary first pass of the MW, the Thick Disc was sampled at Galactic latitudes nominally between b = 10∘-20∘ and about every 20 degrees in Galactic longitude. To date, the entire survey has strong detections of the MRi in 14 regions with 3 additional tentative detections out of 25 regions observed. It has been found on both sides of the Galactic plane at Galactic latitudes from 4∘ - 20∘ and its extent away from the plane is as yet undetermined although SDSS results suggest that it could be as high as +30∘ (Belokurov et al., 2007). Numerical simulations of the MRi as a tidal stream predict it to have multiple wraps around MW, although the current dataset cannot distinguish between different aspects of the stream nor whether the different detections are part of a coherent structure. Figure 1 shows the previous detections of the MRi as reported in Conn et al. (2005a) and Conn et al. (2007). Figure 2 of Paper I shows how these CMDs can be interpreted by showing the approximate location of the Thin, Thick and Halo stars in the field. Figure 5 of Paper I illustrates which components are being referenced when discussed in the text. Each of the fields in this figure are pixelated Colour-Magnitude diagrams. The pixel values represent the square-root of the number of stars in that pixel. Ordered by increasing Galactic Longitude, Figure 1 tentatively shows the changing strength and thickness of the MRi around the Plane. Qualitatively, the strength of the MRi can be seen in comparison with the MW components. Additionally, the only apparent difference between Northern and Southern detections is perhaps that the Southern MRi features appear qualitatively narrower than their Northern counterparts. There is no clear explanation as to why this is the case.
While there is more and more evidence regarding the true extent of this structure, there is very little information concerning many of its generic properties. As such, no direct measurement of the density profile of any part of the stream around the sky has been made, nor a complete understanding of its true extent on the sky. In the region covered by the SDSS, Jurić et al. (2008) and Ivezic et al. (2008), report on the presence of the MRi with regard to its number density, metallicity and kinematics. A clear overdensity of stars can be seen at a distance of 16 kpc (Jurić et al., 2008) and Ivezic et al. (2008) reports a mean metallicity of [Fe/H] = -0.95 with a scatter of around 0.15 dex. Kinematically, they show a spread of velocities rotating consistently faster than the Local Standard of Rest and in accordance with the predictions of Peñarrubia et al. (2005).
The only possible candidate for the stream’s progenitor is an overdensity of stars found in Canis Major but possible confusion with the Galactic Warp has created doubts on this detection. Numerical simulations created using the properties of these stars have predicted the location and extent of the MRi with good accuracy and so adds support to the dwarf galaxy scenario. This on-going debate centres on whether observations of the Canis Major overdensity conform to known Galactic structure, such as the Warp, or can be considered truly additional. Paper I of this series outlines some of the possible inconsistencies between predicted properties of the Galactic Warp and direct observations of these structures. In response to this López-Corredoira et al. (2007) have presented an explanation relying on only first order Galactic structure. Further refinement of the properties of the MRi are needed to determine whether CMa is the most likely candidate as its progenitor.
2 Observations and Reduction
The Anglo-Australian Telescope Wide Field Imager (AAT/WFI) at Siding Spring Observatory in New South Wales, Australia was used to conduct the current survey. The AAT/WFI is mounted at prime focus with a field of view of approximately 33 arcminutes on a side. It consists of eight 4k2k CCDs with a pixel scale of 0.2295 arcsec per pixel.
The observations were taken over three observing runs, the first on the 22-25 January 2004, the second on 30, 31st of January and 01 February 2004 with the third on the 14, 15 and 16th of August 2004. To minimise the fringing effects that are present when observing with other filters we employed the g (WFI SDSS #90) and r (WFI SDSS #91) filters. Exposure times used were a single 600 second exposure in g and two 450 second exposures in r. Twilight flats along with bias and dark frames were used for calibration, and Landolt Standard Star fields were observed roughly every two hours. Data reduction was performed using the Cambridge Astronomical Survey Unit (CASU) Pipeline (Irwin & Lewis, 2001), a thorough description of this process and the necessary calibrations are outlined in Paper I of this series.
This paper presents the final section of the survey using the AAT/WFI which observed fields from l = (280 - 25)∘ across the Galactic bulge. This is in addition to Paper I which covered fields in the regions l = (195 - 276)∘. Nine fields have been observed, and in general each field is approximately one square degree or four WFI pointings. A summary of the results of this survey is shown in Table 1.
3 Analysis
The magnitude completeness of the data has been estimated in the same manner as described in Paper I. In essence, this involves using overlapping regions of the observed fields to determine the completeness. The field at (l,b) = (300,-20)∘ has only one pointing and so with this approach no completeness estimate is possible. Table 2 presents the completeness profiles of each field based on the equation
| (1) |
| Fields (l,b)∘ | mc () | mc () | |
|---|---|---|---|
| (280, 15)∘ | 22.40 | 21.40 | 0.55 |
| (280, 15)∘ | 23.85 | 22.60 | 0.60 |
| (300, 20)∘ | no estimate possible | ||
| (300, 10)∘ | 23.30 | 22.40 | 0.30 |
| (340, 20)∘ | 21.80 | 20.70 | 0.45 |
| (350, 20)∘ | 23.10 | 22.30 | 0.30 |
| (350, 20)∘ | 23.40 | 22.40 | 0.75 |
| (025, 20)∘ | 22.60 | 21.70 | 0.60 |
| (025, 20)∘ | 22.60 | 21.70 | 0.60 |
Estimating the completeness provides a way to evaluate the quality of the data and helps to determine the reliability of the detections in the faint end of the Colour-Magnitude diagram (CMD). While in Paper I the completeness profile was used when making signal-to-noise estimates of the stream, the data here are not of sufficient quality to allow such a measurement. This is because many of these fields only have two or three pointings per region (fewer stars) coupled with poor seeing leading to a relatively bright limiting magnitude. With these factors, the MRi is not as clearly above the noise as in Paper I.
Following the method employed by Ibata et al. (2003), Conn et al. (2005a) and Paper I, we have used a main sequence fiducial to estimate the distance to the features seen in the CMDs. For a complete explanation of the process and errors involved see 4.1.2 of Paper I. The furthest distance to which this method can find the MRi is difficult to estimate. The number density of MRi stars per field and the distance to the MRi are obviously important to whether a detection is made. Additionally, the quality of the data in those fields will again directly influence the likelihood of a detection. Poor seeing and insufficient sky coverage could easily effect the ability of this method to make a successful detection. The findings of this survey suggest that if the MRi is within 20 kpc it will be detectable. Beyond this, it is highly dependent on the strength of MRi in the CMD and only one field has the MRi placed greater than 20 kpc. A possible reason for this is that a detection at a distance of 20 - 30 kpc involves a shift of 1.5 - 2.2 magnitudes from the base position at 11 kpc (g = 19.5). The turn-off of the shifted main sequence is now located at 22 magnitude where the photometric errors are starting to increase and thereby spread out the main sequence. In the absence of very deep or wide surveys this apparent limit of 20 kpc may remain the practical limit for finding the MRi.
3.1 Comparisons with the Besançon Model
The basic methodology we have employed when searching for additional structures in the outer Disc of the Galaxy is to make direct comparisons with the Besançon model which purports to predict its properties. While this approach is not favoured by some it has a few advantages. Firstly, and quite importantly it allowed the survey to be completed in a reasonable time frame. Adding an extra filter, such as a U band or i band filter, would have dramatically increased the time needed. Secondly, the dynamic range of the survey means that the brighter end of the survey can test the predicted properties of the bulk Milky Way components while the fainter end tests the outer Disc region. Since the MRi is only distinguishable in the Thick Disc/Halo part of the CMD, searching for its presence relies on looking at the fainter end of the CMD. The Canis Major dwarf galaxy feature as discussed in Paper I, is located more or less in the Thin Disc component. Indeed, since most of the debate concerning CMa revolves around whether the CMDs observed in the CMa region are explainable in terms of purely Disc components or whether an extra component exists in the same Colour-Magnitude space. It is for the latter possibility that the distance to the edge of the Thin Disc component has been determined for the fields in this part of the survey. Checking their position with respect to the model provides an opportunity to assess whether it is different and perhaps could be related to the CMa overdensity. For some fields, measuring the faint edge of the Thin disc cut-off has not been possible due to the CMDs not showing a clear edge. For these fields, the distance to the bright edge of the Thin Disc region has been found. So for each field there are three possible structures to be examined: the faint MRi component, which may represent additional MW substructure; the faint edge of the Thin Disc, which may represent a mis-identified CMa-type population as per Paper I; or the upper edge of the Thin Disc, which tests the model in these directions. The results of these parameters are presented in Table 3.
3.2 Survey Fields
| Fields (l,b)∘ | MRi offset | MRi dist | MW/CMa offset | MW/CMa dist |
|---|---|---|---|---|
| (mag) | (kpc) | (mag) | (kpc) | |
| (280,15)∘ | - | - | - | - |
| (280,15)∘ | 0.0 | 11.0 | - | - |
| (300,20)∘ | - | - | 0.8 | 7.6 |
| (300,10)∘ | 0.8 | 15.9 | 0.8 | 7.6 |
| (340,20)∘ | - | - | 0.2 | 10.0 |
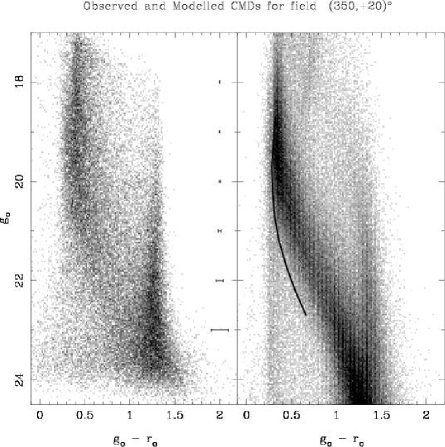
| (350,20)∘ | - | - | 0.5 | 8.7 |
| (350,20)∘ | - | - | 0.2 | 12.1 |
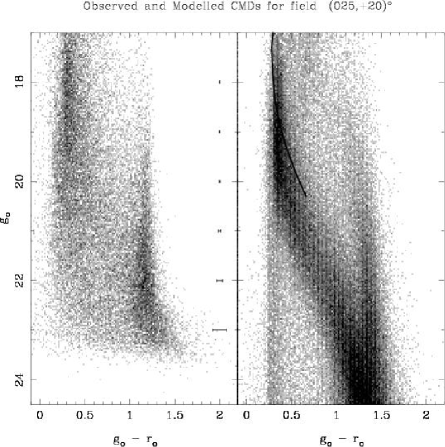
| (025,20)∘ | - | - | 2.0 | 4.4 |
| (025,20)∘ | - | - | 2.2 | 4.0 |
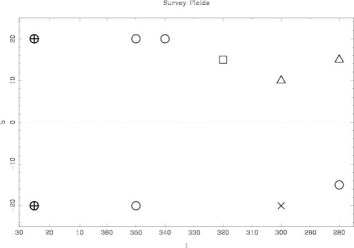
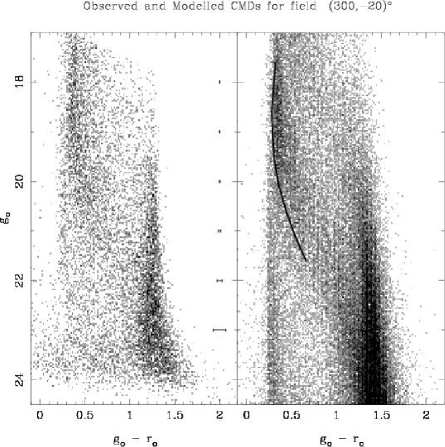
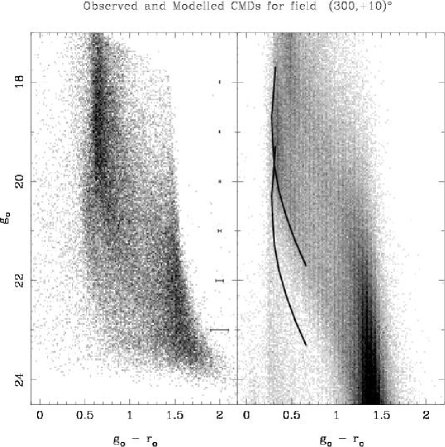
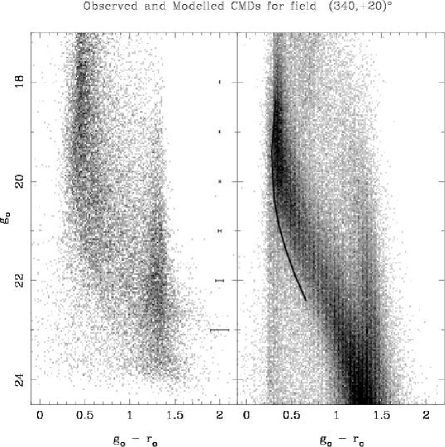
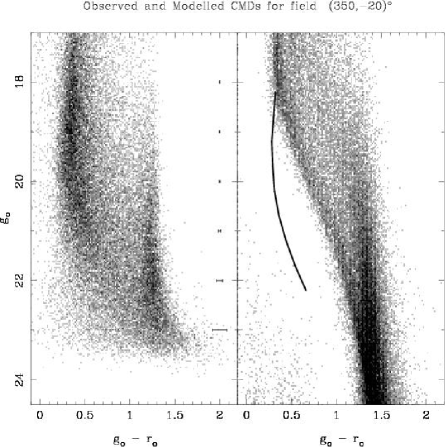
The location of each field, in Galactic coordinates, is shown graphically in Figure 2. Each field is presented in the following sections showing the CMDs with the appropriate main sequence type overlay as taken from the original Newberg et al. (2002) detection and described in Paper I. All magnitude offsets of the main sequence overlay are with respect to this Newberg et al. (2002) detection at 11.0 kpc. Table 3 summarizes the outcome of this study and uses the same formatting as in Paper I. It should be noted though that this paper does not find evidence of the Canis Major dwarf and the final column of Table 3 simply presents where the fiducial main sequence has been placed. In general, for this part of the survey, the Besançon model is well matched to the data and as such the dominant main sequence is easily attributed to known Galactic structure. The CMDs that we have used are density maps of the underlying distribution. Each pixel is the square root of the number of stars in that part of the CMD. This method provides better contrast of the structures especially in regions if high stellar density. A presentation of all the fields from previous AAT and INT surveys in which the Monoceros Ring is present can be seen in Figure 1. In the following sections we will provide the distance estimates to the major features present in each CMD from this part of the survey with an analysis of these results being presented in the Discussion (4).
3.2.1 Fields
The (280,-15)∘ field (Figure 3) is approximately 40 degrees from the purported dwarf galaxy in Canis Major and the features here seem less defined than in nearer fields. This is perhaps due to slight differences in the photometric solution for each frame combined with the brighter limiting magnitude. The strong main sequence seen in (l,b) = (273,-9)∘ (Figure 20 of Paper I) is not seen here although the increase in latitude away from the Galactic plane could account for this change. Deeper imaging of this region is necessary to confirm the lack of the CMa feature and to investigate the slight excess of stars in the region g∘ 21 and (g - r)∘ 1.0.
3.2.2 Fields
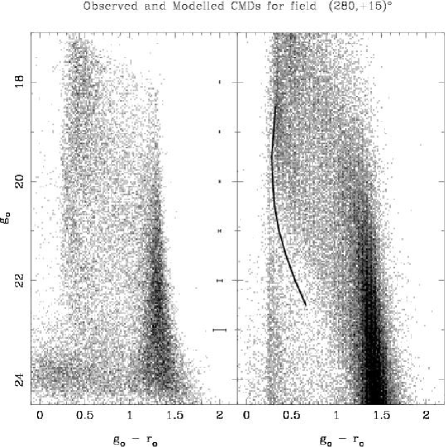
The (280,+15)∘ field (Figure 4) is similar to its corresponding field below the plane at (280,-15)∘. The comparison field from the Besançon model is presented here with the fiducial main sequence at the location of the additional main sequence present in the data. This main sequence has been interpreted as the Monoceros Ring. Interestingly, the MRi feature in this field is more extended than in others. The stream is perhaps extended or wrapped in this part of the sky or the MW components here have different strengths than the Besançon model predicts. A mix of the two is also possible. The fiducial shown marks the brighter edge of this feature. With only a small shift from the nearby detection at (276,+12)∘ (see Figure 1, the offset used for this feature is 0.8 magnitudes corresponding to 15.9 kpc heliocentrically. In comparison to the detection at (276,+12)∘, this is about 4 kpc further away. The lower edge of this feature is approximately 0.5 magnitudes fainter and thus would be estimated at around 20 kpc. No attempt has been made to estimate the width of this feature.
3.2.3 Fields
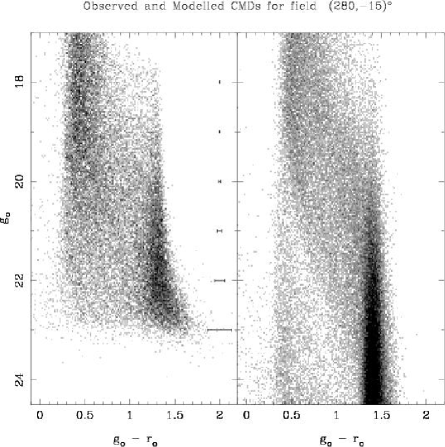
At (300,-20)∘ (Figure 5), the main sequence crossing the middle of the CMD is well matched by the synthetic CMD and corresponds to the location of the Disc stars seen in the model. The overlay is offset at -0.8 magnitudes or 7.6 kpc. There is perhaps a main sequence belonging to the MRi at the faint blue end of the CMD however the model does indicate that some stars should be expected in that location. Given the overall noisy quality of the CMD, no attempt is made to identify whether those stars may belong to the MRi. The strong main sequence defined by the fiducial is a good match with the model and thus is most likely of Galactic origin.
3.2.4 Fields
The (300,+10)∘ field (Figure 6) contains an obvious additional main sequence more distant than the expected Milky Way component. The original data for this field was slightly misaligned in colour after all the photometric calibrations were applied. To try to ensure the smallest shift possible when correcting this, the r magnitudes have all been shifted by 0.1 magnitudes. Taking the field without any differential extinction and shifting the others to match aligns the final CMD in the correct colour range and allows the main sequence overlay to be used to estimate the distance. Of course, shifting the data in this manner weakens the accuracy to which we can determine the distance. While the shift was small, all the distances reported for this field can only be seen as indicative and do not have the accuracy as reported in the other fields of the survey. The two overlays are offset by -0.8 magnitudes for the brighter main sequence and 0.8 for the fainter main sequence. These result in distance estimates of 7.6 kpc and 15.9 kpc respectively. The stronger main sequence is clearly related to the Galaxy given the good correlation with the model.
3.2.5 Fields
The data in this field (Figure 7) is a combination of two pointings which resulted in different limiting magnitude when calibrated. This could partly contribute to the lack of coherence in the data toward the limiting magnitude of the shallower sample (g∘22.5). When combining the two datasets the selection criteria has been tightened; in the other fields, if the object is classified a star in one filter and only possibly a star in the other it is accepted. With this CMD, only if in both filters the object is classified as a star has it been plotted. This was done to try and remove some of the additional noise in the CMD. Additionally however, an alignment in colour by 0.1 magnitudes redward was also required. This will impact on the accuracy of any distance estimates of structures within this field. The overlay is fitted to the lower extreme of the Milky Way main sequence and is a good match to the predictions of the model.
3.2.6 Fields
This field (Figure 8) shows a broad main sequence with an overlay placed with an offset of -0.5 magnitudes (8.7 kpc heliocentric distance). There is an obvious problem with the predictions of the model. In the following field, this problem was avoided by locating a field nearby which reproduced an acceptable CMD. Unfortunately, there was no nearby field in the model which resembled the data here and so was left as is. Indeed, comparing with the results of the Northern field it suggests that the data here consists solely of Galactic components.
3.2.7 Fields
As for the Southern field at this Galactic longitude, this field also had a problematic model CMD. However, it was noticed that a slight change in coordinates in the model produced a CMD much more similar to the data. So for this field, the comparison field is (347.5,+20)∘ rather than (350,+20)∘ (Figure 9). The (347.5,+20)∘ synthetic field is used here due to its similarity with the data. The contrast between the data and the model for the field in the South is deemed a glitch rather than a flaw in the entire model. The overlay here is placed at 0.2 magnitudes and corresponds to the fainter edge of the main sequence. It can be found at a heliocentric distance of 12.1 kpc, although, as with the Southern field, the main sequence in the model does seem to be stronger than the data. On the whole though, they are much more similar here than in previous fields.
3.2.8 Fields
This field (Figure 10) completes the Monoceros Ring survey below the Galactic plane which began with the INT/WFC survey. Despite having seeing of typically 2′′, the limiting magnitude of the data is still relatively deep. In comparison with the model, the strong main sequence is conspicuously missing from the data. In an attempt to compare the features, the bright end of the weak Milky Way main sequence in the data has been fit with an offset of -2.0 magnitudes. This converts to a distance estimate of 4.4 kpc which is reasonable match with the model. It is uncertain why this field lacks a strong Thin Disc presence in the data.
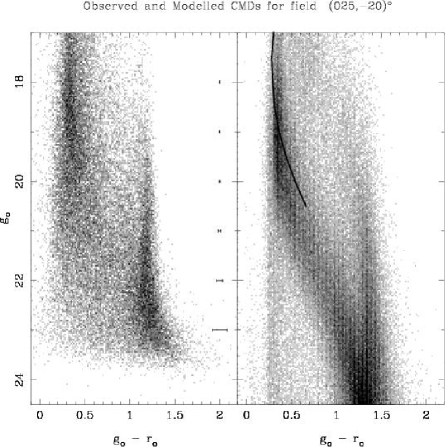
3.2.9 Fields
The final field of the survey on the Northern side of the plane (Figure 11) is remarkably similar to its Southern counterpart. Again the model predicts strong main sequence for the Thin Disc component which is not present in the data. To provide some point of comparison the approximate bright end of the weak Milky Way main sequence has been estimated and is found at an offset of -2.2 magnitudes or 4.0 kpc. The model predicts this edge here too. There is no evidence of the Monoceros Ring in this field.
4 Discussion
To date there are only two numerical simulations of the Monoceros Ring and Canis Major structures, these are from Martin et al. (2005) and Peñarrubia et al. (2005). The primary difference between these two models is that the Martin et al. (2005) model uses the properties of the Canis Major overdensity as its constraints and the Peñarrubia et al. (2005) model uses the data collected on the Monoceros Ring up to that time. The following two sections compare the findings of this paper, Paper I and the INT/WFC paper (Conn et al., 2005a) with these models. To make the comparison meaningful, in the next sections the MRi is assumed to be a tidal stream.
4.1 Comparing the observations with the Martin et al. (2005) model
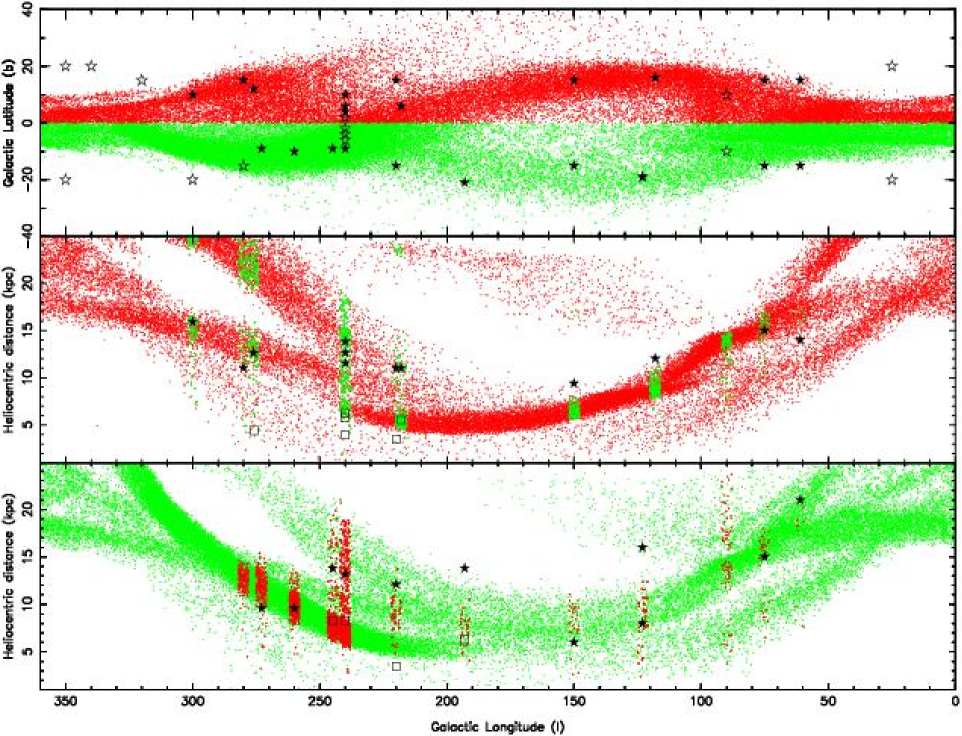
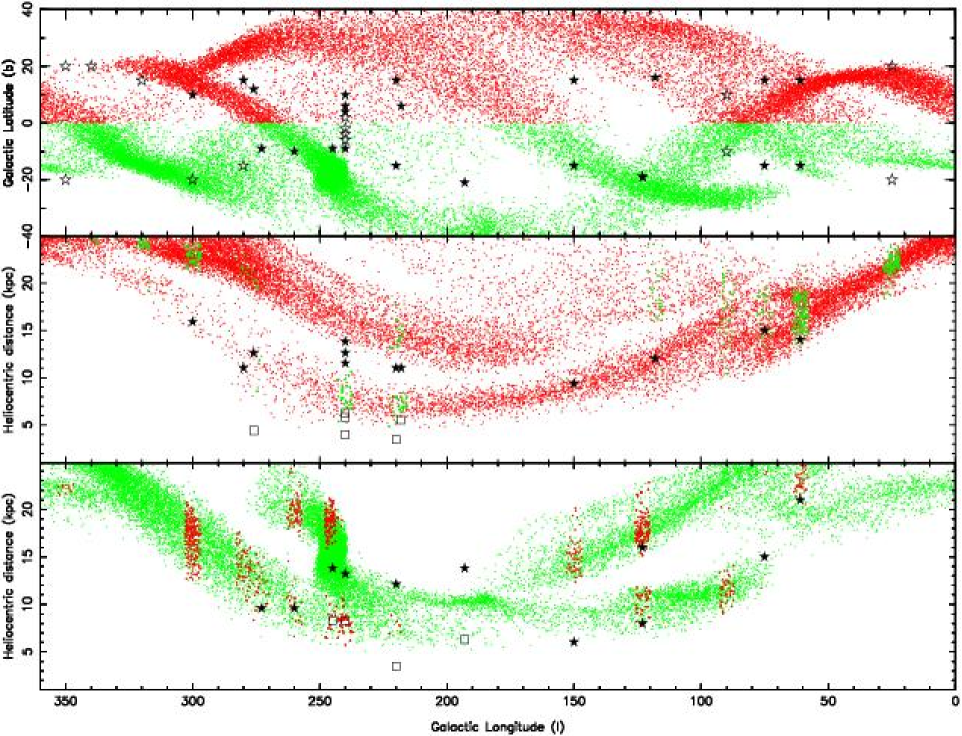
The numerical simulation of Martin et al. (2005) has been plotted with the results from the entire survey (this paper, Paper I and (Conn et al., 2005a)) in Figure 12. The top panel shows the model in (l,b) space dividing the points, by colour, for those above and below the Galactic Plane. All of the fields from the three papers have been overplotted as either full or open stars. Full stars represent fields with a Monoceros Ring detection and open stars are fields without a Monoceros Ring detection. Tentative detections have been included in this figure.
The middle panel contains only the points above the Plane plotted against Heliocentric distance. For each field, the prediction of the model for that location (l,b), is shown in green. This then allows direct comparison between the finding of the survey with the prediction of the model. To avoid clutter, the top panel only showed MRi detections but for completeness the CMa detections from Paper I, which reside in the same fields, are plotted as open squares. The fields between l = (200 - 300)∘ do seem to correspond well to the model although there are a spread of distances which are possible. The fields at (l,b) = (118,+16)∘ and (150,+15)∘ are at distances greater than the predicted location but they do vary in-step with the model and so could just represent the model stream being too close heliocentrically. At (l,b) = (90,+10)∘ there is a conspicuous absence of the MRi. While in other fields the overall data quality or area covered could be a reason for a non-detection, but here there is no such problem. It is unclear why the feature is absent. For the (l,b) = (75,+15)∘ field the detection again matches the model while the detection at (l,b) = (61,+15)∘ does not correspond well. The reasons for this is also uncertain.
The lower panel shows the predictions for the stream model below the Plane. Around l = (240 - 276)∘ the detections do roughly correspond with the model and from l = (60 - 240)∘ the connection is more or less correlated with the general direction of the stream. The two interesting omissions in the South are (l,b) = (90,-10)∘ and (l,b) = (280,-15)∘ as both these fields were expected to have MRi components. As per the Northern field at l = 90∘, the data quality in its Southern counterpart field is sufficiently high to robustly conclude no MRi feature is present here. For the l = 280∘ field, the limiting magnitude is the second worst in the sample but given that the predicted distance is more or less that of the original detection by (Newberg et al., 2002) it should be visible. The stream therefore does not pass through this field at the distances suggested by the model.
Non-detections of the stream also provide an opportunity to test the model. In all but a few cases the non-detections in the data are supported as non-detection regions in the model. The survey is too sparse to draw conclusions as to a potential path for the stream but it does serve as a basis for future studies and models.
4.2 Comparing the observations with the Peñarrubia et al. (2005) model
Interpreting the predictions of the Peñarrubia et al. (2005) model has been done in the same way as for the Martin et al. (2005) model, primarily by comparing the locations and distances of the observed structures with the distances and locations as predicted by the model (Figure 13). The lower two panels show the predicted stream locations from the model in each of the regions surveyed. Given that the Peñarrubia et al. (2005) model uses fewer particles than the Martin et al. (2005) model; a slightly bigger area has been chosen around each field to sample enough model data points. The correspondence with data is seemingly poorer for the Peñarrubia et al. (2005) model and several non-detection regions are supposedly populated by the stream.
For the Northern fields, many of the distances do seem to match the predictions of the model. Close inspection of the model shows that the detections are located on the wrong arm. Most of the fields observed are located in sparsely populated regions of the model and do not probe the predicted path of the model to higher latitudes. The field at l = 25∘ is possibly undetected due to the predicted distance of the stream here. As discussed in 3, it is estimated that the technique used is only sensitive to objects less than 20 kpc distant. The fields at (l,b) = (61 - 75)∘ could be seen as confirmation of the stream however the non-detection at (l,b)) = (90,10)∘ is difficult to explain. At (l,b)) = (118,16)∘, the detection is at least 5 kpc closer than the distance estimate from the model. For the field centred on (l,b)) = (150,15)∘, it resides in an almost empty region of the model but seemingly the detected stream here corresponds with the tidal arm at higher latitudes. The discrepancy for this model around the l = 240∘ region is known and has been commented on by other authors. The fields at longitudes l = (260 - 360)∘ are simply unable to observe the stream according to the model. The latitude for these fields is not so much a problem and detections reported in this paper do not match the model at all.
In the South, the match with the model is good around l = 60∘, 123∘ and close to the Plane around 250∘. The remaining fields occupy regions of low density in the model. A few fields, like those at l = 90∘ present real discrepancies with the model. The main difference between the Northern fields is that most of the predicted stream locations in the South should have been detectable by the technique used here. In favour of the model though, a significant proportion of the model is not sampled in the survey as it is above a latitude of 20∘. Finally, in comparison to the original data used to create the model (see Figure 2, Peñarrubia et al. (2005)), most of the data points there reside between l = (110 - 240)∘. This corresponds to a relatively sparse sampling in this survey. Another comparison of this model against the available data is presented in Peñarrubia et al. (2007).
4.3 Key locations to test the models
Each model predicts that in key areas of the Galaxy there are significant changes in the stream which could be used to both test the model and provide further support to the tidal stream scenario as a whole. In particular, these are the regions south of the purported Canis Major dwarf galaxy over the longitude range l = (200 - 250)∘ since in this location the two models predict different approaches for the stream into the core. The region l = (130 - 220)∘ is where the Martin et al. (2005) model predicts the leading tidal arm of the dwarf galaxy should decrease in latitude and enter into the Disc. Finally the region l = (025 - 050)∘: here the stream is predicted to be close to the Plane (b = 10∘) in the Martin et al. (2005) model and away from the Plane (b = 20∘) in the Peñarrubia et al. (2005) model. Knowledge of the stream around the Bulge is needed to constrain its position in all four quadrants of the Galaxy. The Bulge presents an additional challenge in that the distance of the targets and the high density of foreground stars will make the MRi difficult to detect. The current dataset is unable to detect the MRi at the distances predicted by the Peñarrubia et al. (2005) model (25 - 30 kpc) and the Martin et al. (2005) model predictions of 15 - 25 kpc are yet to be tested so close the Plane.
4.4 Insights into the nature of the Galactic Warp
One of the key properties of the Galactic Disc is the Warp. Around l = 90∘ the Disc curves up from the b = 0∘ position and around l = 270∘ it curves down. Studies into the putative Canis Major dwarf galaxy have had to contend with the close proximity of the Warp and much debate has centred on whether the CMDs in this region can be fully explained by the Warp or require an additional source of stars. This part of the survey provides an opportunity to understand the impact of the Galactic Warp on CMDs, through a closer inspection of fields (l,b) = (280,15)∘ (Figures 3,4). At l = 280∘ these fields are very near the maxima of the Southern Warp. Firstly, both these fields are well matched by the model and the Warp is seen clearly as an excess of stars in the Southern field. This manifest as both as a general increase in star counts and an obvious thickening of the Thin and Thick Disc components as seen in the Southern field. How to identify the different components of the Galaxy in the CMDs is shown in Figure 2 of Paper I. Secondly, we see that the influence of the Galactic Warp does not change the shape of the CMD. The Northern field at l = 280∘ is essentially a shifted version of its Southern counterpart. This is important because a comparison of the almost symmetric fields (l,b) = (240,+10)∘ and (l,b) = (240,-9)∘ (See Figure 1 or Figures 10 and 17 from Paper I.) is remarkably different. While the fields at l = 280∘ have more of a sharp edge to Thin-Thick Disc boundary the Canis Major field shows a true curving Main Sequence which is unmatched in the Northern field. Since the l = 280∘ fields show that the Warp does not seem to have an impact on the shape of the CMD, the fields in Canis Major must be considered anomalous to the usual Galactic Warp scenario. Whether this anomaly is caused by a dwarf galaxy is uncertain, however these qualitative differences in the CMDs should be investigated so that our understanding of this region is more complete.
5 Conclusion
This paper reports on 2 new detections and 7 non-detections of the Monoceros Ring tidal stream. The results presented here conclude a survey tracing this feature around the entire Galactic plane. The previously reported detections of the survey are presented in Figure 1. Comparing the relative strengths of the MRi and the main MW population it appears qualitatively that the stream is denser and broader above the Plane than below but as such there is no explanation why this would be the case. The part of the overall survey presented here shows no evidence of the strong Canis Major dwarf main sequence in the CMDs. The CMa sequence is historically identified as a shift in the position and shape of the strongest main sequence in the CMD. For the fields presented here, the dominant main sequence feature in the CMDs is easily attributed to the Thin and Thick Discs. In each instance where the distance has been determined to these structures it is in accordance with the Besançon synthetic galaxy model predictions. Therefore they can be confidentially associated with the MW. The only field which might be expected, from the Martin et al. (2005) model, to contain the CMa signature is (l,b) = (280,-15)∘. This field does not show this CMa-style sequence in the CMD (Figure 3).
Comparing these new MRi detections with the two current numerical simulations of the stream and putative dwarf galaxy progenitor, has led to inconclusive results. The Martin et al. (2005) model north of the Galactic Plane roughly traces the locations of the detections. In the South the correspondence between the model and the detections is adequate with some noted exceptions. Several detections presented in this survey indicate, with reasonable certainty, the locations in which the model is incorrect. For the Peñarrubia et al. (2005) model, there is less correlation between the data points and the predicted stream locations than is seen with the Martin et al. (2005) model. Although some points do seem to represent a better fit it is important to note though that a significant proportion of the Peñarrubia et al. (2005) model does reside outside of a Galactic latitude of b = 20∘. So much of the model has not been sampled by this survey. Indeed, it is easy to see that this survey is too narrow in Galactic latitude in comparison with the data used to construct the model and the predictions it makes. Drawing a conclusion based on these results in inadvisable but there is little here to strongly support this model. Both models obviously will require reworking to include the new information available along with more observations to test their predictions.
With regard to the Besançon synthetic galaxy model, there is no presence of the MRi as part of natural Galactic structure. In almost all fields in this survey, the bulk Milky Way components of Thin, Thick Disc have been accurately modelled. There is no systematic discrepancy between the model and data even in regions containing the Galactic Warp. Only the regions around Canis Major, as discussed in Paper I, show a definite shift from the observational data. Given the data supports the predictions of the Besançon model in all but the MRi detections, it is reasonable to assume this structure is indeed additional to the usual Galactic components.
Determining the density profile of this feature around the Galaxy and indeed connecting detections is an important next step in resolving its origins. To date, targeted deep surveys, such as this, have resolved many important questions surrounding this structure. This survey sheds some light on the impact of the Galactic Warp on the Colour-Magnitude Diagrams showing it does not effect its morphology significantly and that the Besançon model is adequate for most fields. This has implications with regard how the fields in the Canis Major region are to be interpreted as the fields there have obviously different characteristics. While the nature of the Monoceros Ring still remains quite elusive, this is primarily due to its large extent on the sky and its location close to the Plane. For the time being, both the Galactic origin scenario and the tidal stream hypothesis are still possibilities for this structure. The completed survey, presented here, has shown that a targeted campaign of observations can provide insights on not only this structure but also generic Galactic structures as well.
6 Acknowledgments
M.B. acknowledges the financial support of INAF to this research through the grants PRIN05 - CRA 1.06.08.02 and PRIN07 - CRA 1.06.10.04. RRL would like to thank LKN for her on-going support. BCC thanks the referee for their constructive comments and B. Carry for his work with the lighting.
References
- Belokurov et al. (2007) Belokurov, V., et al. 2007, ApJ, 658, 337
- Conn et al. (2005a) Conn B. C., Lewis G. F., Irwin M. J., Ibata R. A., Ferguson A. M. N., Tanvir N., Irwin J. M., 2005a, MNRAS, 362, 475
- Conn et al. (2007) Conn, B. C., et al. 2007, MNRAS, 376, 939
- Ibata et al. (2003) Ibata R. A., Irwin M. J., Lewis G. F., Ferguson A. M. N., Tanvir N., 2003, MNRAS, 340, L21
- Irwin & Lewis (2001) Irwin M., Lewis J., 2001, NewAR, 45, 105
- Ivezic et al. (2008) Ivezic, Z., et al. 2008, ArXiv e-prints, 804, arXiv:0804.3850
- Jurić et al. (2008) Jurić, M., et al. 2008, ApJ, 673, 864
- López-Corredoira et al. (2007) López-Corredoira, M., Momany, Y., Zaggia, S., & Cabrera-Lavers, A. 2007, ArXiv e-prints, 707, arXiv:0707.4440
- Martin et al. (2005) Martin N. F., Ibata R. A., Conn B. C., Lewis G. F., Bellazzini M., Irwin M. J., 2005a, MNRAS, 362, 906
- Peñarrubia et al. (2007) Peñarrubia, J., Martinez-Delgado, D., Rix, H.W. 2007, ArXiv Astrophysics e-prints, arXiv:astro-ph/0703601
- Mateu et al. (2007) Mateu, C., Vivas, K., Zinn, R., & Miller, L. 2007, IAU Symposium, 241, 359
- Newberg et al. (2002) Newberg H. J., et al., 2002, ApJ, 569, 245
- Peñarrubia et al. (2005) Peñarrubia, J., et al. 2005, ApJ, 626, 128
- Rocha-Pinto et al. (2003) Rocha-Pinto H. J., Majewski S. R., Skrutskie M. F., Crane J. D., 2003, ApJ, 594, L115
- Vivas & Zinn (2006) Vivas, A. K., & Zinn, R. 2006, AJ, 132, 714