11email: nhuelamo@laeff.inta.es 22institutetext: Observatoire de Genève, Université de Genève, 51, ch. des Maillettes, 1290 Sauverny, Switzerland 33institutetext: Centro de Astrofísica, Universidade do Porto, Rua das Estrelas, 4150-762 Porto, Portugal 44institutetext: Centro de Astronomia e Astrofísica da Universidade de Lisboa, OAL, Tapada da Ajuda, 1349-018 Lisboa, Portugal 55institutetext: Lowell Observatory, 1400 W. Mars Hill Rd., Flagstaff, AZ 86001 66institutetext: Instituto de Astrofísica de Andalucía, CSIC, Apdo. 3004, E-18080, Granada, Spain 77institutetext: Thüringer Landessternwarte Tautenburg, Karl-Schwarzschild-Observatorium, Sternwarte 5, D-07778 Tautenburg, Germany 88institutetext: European Southern Observatory, Karl-Schwarzschild-Strasse 2, D-85748 Garching bei München, Germany
TW Hydrae: evidence of stellar spots instead of a Hot Jupiter ††thanks: Based on observations taken at the VLT (Paranal), under programs 280.C-5064(A) and 075.C-0202(A) , and with the CORALIE spectrograph and EulerCAM both at the Euler Swiss telescope (La Silla)
Abstract
Context. TW Hya is a classical T Tauri star that shows significant radial-velocity variations in the optical regime. These variations have been attributed to a 10 MJup planet orbiting the star at 0.04 AU.
Aims. The aim of this letter is to confirm the presence of the giant planet around TW Hya by (i) testing whether the observed RV variations can be caused by stellar spots and (ii) analyzing new optical and infrared data to detect the signal of the planet companion.
Methods. We fitted the RV variations of TW Hya using a cool spot model. In addition, we obtained new high-resolution optical & infrared spectra, together with optical photometry of TW Hya and compared them with previous data.
Results. Our model shows that a cold spot covering 7% of the stellar surface and located at a latitude of 54∘ can reproduce the reported RV variations. The model also predicts a bisector semi-amplitude variation 10 m/s, which is less than the errors of the RV measurements discussed in Setiawan et al. (2008). The analysis of our new optical RV data, with typical errors of 10 m/s, shows a larger RV amplitude that varies depending on the correlation mask used. A slight correlation between the RV variation and the bisector is also observed although not at a very significant level. The infrared H-band RV curve is almost flat, showing a small variation (35 m/s) that is not consistent with the published optical orbit. All these results support the spot scenario rather than the presence of a hot Jupiter. Finally, the photometric data shows a 20% (peak to peak) variability, which is much larger than the 4% variation expected for the modeled cool spot. The fact that the optical data are correlated with the surface of the cross-correlation function points towards hot spots as being responsible for the photometric variability.
Conclusions. We conclude that the best explanation for the RV signal observed in TW Hya is the presence of a cool stellar spot and not an orbiting hot Jupiter.
Key Words.:
stars: pre-main sequence – stars: planetary systems – stars: individual (TW Hya)1 Introduction
TW Hya (spectral type K7, M∗ =0.7, age10 Myr) is an extensively studied classical T Tauri star (CTTS) (e.g. Rucinski & Krautter, 1983). With a distance of 567 pc (ESA, 1997), it is probably one of the closest laboratories for studying of our own solar system in its early stages of formation.
Recently, Setiawan et al. (2008, SHL08, hereafter) announced the discovery of a giant planet (10 MJup) orbiting TW Hya at a separation of 0.04 AU. Their discovery is based on high-resolution optical spectroscopic observations: the analysis of two independent datasets obtained with a difference of 3 months shows a significant radial velocity (RV, hereafter) variation with an amplitude of 19661 m/s and a periodicity of 3.560.02 days. This, together with the lack of correlation between the RV variation and the cross correlation-function bisector (BIS), has been interpreted as proof of the existence of a planetary-mass object orbiting the star.
In this letter, we study whether the RV variations in TW Hya can be caused by stellar spots and not by a planetary-mass companion. With this in mind, we have tried to reproduce SHL08 data with a cool spot model. In addition, we obtained almost simultaneous optical & near-infrared high resolution spectroscopy and optical photometry of the source in order to detect the planet signal with a different dataset.
2 A spot model for TW Hya
To test whether a spotted surface is a viable model for explaining the SHL08 dataset, we simulated the changes of TW Hya’s line profile due to such a spot. For that purpose, we used Soap (Bonfils & Santos 2008, in prep.), a program that calculates the photometric, radial-velocity, and line-shape modulations induced by one (or more) cool stellar spot.
Soap computes the rotational broadening of a spectral line by sampling the stellar disk on a grid. For each grid cell, a Gaussian function represents the typical line of the emergent spectra. It has the same width, , as the typical spectral line of a star with no rotational velocity (or one too low to be resolved) and of similar spectral type than the star of interest. The Gaussian is Doppler-shifted according to the projected rotational velocity () and weighted by a linear limb-darkening law (). For a given spot (defined by its latitude, longitude, and size), Soap computes which of the grid cells are obscured and removes their contribution to the (integrated) stellar spectrum. Finally, the stellar spectrum output by Soap is the sum of all contributions from all grid cells. In our case, the stellar spectrum is an averaged spectral line. It behaves like the cross-correlation profile of stellar spectra, and Soap uses it to compute the RV and the bisector, in addition to the photometric variation.
In the case of TW Hya, we chose (following SHL08) and an inclination of , which is the likely inclination of the TW Hya circumstellar disk (Qi et al., 2004). The strong veiling in the atmosphere of TW Hya prevents us from using its BV color index as a temperature proxy. Both and will probably yield wrong estimates if derived from a calibration based on this color index. Therefore, we only used the B-V color to derive a first estimation of (Melo et al., 2001). We then iterated on different values to show that our conclusions are unchanged. The rotational period of the star, the spot size and latitude, and the star velocity () were left as free parameters. Adjusting these parameters, we were able to reproduce SHL08’s RVs with a dark spot covering about 7% of the stellar surface, located at a latitude of 54∘ and with a rotation period of 3.56 days. With the assumed stellar radius and inclination, and with the fitted rotational period, we derived a of 1.56 .
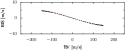
Remarkably, our solution has , very similar to the Keplerian solution derived by SHL08 (=3.32). Our model also indicates that such a spot would produce a 4% photometric variability in the V-band, and a peak-to-peak amplitude change 10 in the BIS measurements (see Fig. 1). An extreme choice of =1 increases the amplitude of the BIS variation up to 30 .
SHL08 measured the BIS and conclude that the observed RV change is not due to a spot. However, their BIS measurements have individual errors of 50-100 m/s and their overall dispersion is almost as large as the RV variation, therefore much higher than the variation expected from our model. Varying the constraint on the inclination, we find solutions with 3.6 from to . With =4.55 , the peak-to-peak variations of BIS were found to be lower than for all inclinations below 50∘.
According to our model, the low inclination of TW Hya’s system weakens significantly the power of a bisector analysis and other diagnostics should be used to validate or disprove the planet hypothesis.
3 New observations of TW Hya
3.1 High-resolution optical spectroscopy
With the goal of confirming the period, phase, and amplitude of the RV signal observed by SHL08, we used the CORALIE spectrograph (1.2-m Euler Swiss telescope, La Silla, Chile) to obtain a series of 12 consecutive radial-velocity measurements of TW Hya. The data were gathered between February and March 2008. Each measurement has an accuracy of about 10 m s-1. CORALIE has a spectral resolution R=, and is known to have a long term precision in radial-velocity of a few 3 m s-1 (e.g. Mayor et al., 2004; Wilson et al., 2008).
The CORALIE RVs are obtained by cross-correlating the stellar spectrum with an optimized weighted template (for details see Pepe et al., 2002). For TW Hya, we performed correlations using cross-correlation masks that are appropriate for stars with different spectral types: G2, K0, K5 (the one closer to the spectral type of TW Hya), and M4. This allows to verify that the amplitude of any putative RV signal shows the same value, independently of the mask used. This is expected if the radial-velocity variations observed stem from the presence of a planet. On the other hand, an amplitude dependence on the mask used could be expected if the RV signal is produced by the presence of a stellar blend (Santos et al., 2002) or a cool stellar spot. In the latter case, the correlation with a mask built for a later spectral type (e.g. M4) should provide a signal with a smaller amplitude than the one derived using a mask for an earlier spectral type (e.g. G2). This is due to the fact that later type masks are more sensitive to the lines in the spot than are the earlier type masks. In the former case, the spectroscopic contrast between the spot and the rest of the photosphere is thus weaker.

The CORALIE RVs have been complemented by older RVs measurements of TW Hya (three datapoints) obtained with the HARPS spectrograph (data described in Guenther & Esposito, 2007), and the FEROS RVs listed by SHL08. Using the HARPS, FEROS, and CORALIE (K5-mask) radial-velocities together, we find a clear signal with a period of 3.56 days, and a semiamplitude of K=2389 m s-1 (Fig. 2, upper-right panel). The parameters of a Keplerian fit are presented in Table 1. Using only the points listed by SHL08 and our own fitting routines, we do confirm their solution, with a semi-amplitude of K=19613 m s-1. If caused by the presence of a planet, our data could thus imply a planetary mass that is 20% higher than the one announced by SHL08.
Interestingly, however, a look at the CORALIE measurements alone shows that by using different cross-correlation masks we can derive significantly different amplitudes when fitting a Keplerian function to the data (Fig. 2 ; bottom-right panel). For instance, using a mask built for a G2-type dwarf we derive a value of K=29235 m s-1. This value decreases to K=27429 m s-1, K=25220 m s-1, and K=16921 m s-1, using the K0, K5, and M4 masks, respectively111To derive these values we fixed the eccentricity to zero. No major differences were found if the eccentricity is set as a free parameter.. This is in line with the presence of a spot instead of a planet to explain the observed RV variations.
If the signal is caused by a stellar spot, a color effect can also be expected. If we correlate the spectra with a given mask using only the blue or the red sides, we can expect to obtain slightly different values for the RV amplitude. This difference comes from the different contrasts (flux ratio) coming from the spot and the surrounding photosphere as a function of wavelength. In a simple blackbody approximation, the contrast between a spot and the surrounding disk is stronger at bluer wavelengths, thus implying a stronger RV signal.
To test this, we derived CORALIE RVs using the K5 mask but correlating only a red portion of the spectrum (4150–4850Å) and a blue portion of the spectrum (6000–6700Å). In the former case, we obtained a semi-amplitude of K=22825 m s-1, while in the latter we derived K=21020 m s-1. These values are marginally compatible with a small variation. Indeed, a simple comparison of the effect due to the different flux ratios in the different bands used (considering a spot with a temperature around 3000 K and the TW Hya temperature of 4000 K – SHL08) shows that a variation of about 10% can be expected. Following this rationale, the RV amplitude in the infrared (IR) regime is expected to be much smaller (5 times smaller) if the RV signal is indeed caused by a spot. We test this hypothesis in Sect. 3.2.
| 3.56830.0002 | [d] | |
| 2454530.10.3 | [d] | |
| 0.070.04 | ||
| (HARPS) | 12.4980.016 | [km s-1] |
| (FEROS) | 12.42040.011 | [km s-1] |
| (CORALIE) | 12.5180.008 | [km s-1] |
| 5529 | [degr] | |
| 2389 | [m s-1] | |
| 49 | [m s-1] |
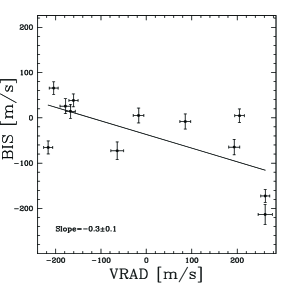
As explained in Sect. 2, the absence of any clear correlation between the RV variation and the bisector of the cross-correlation function was considered by the SHL08 as evidence of a planet orbiting TW Hya. However, the errors in their data (around 100 m s-1) may have hidden any low amplitude signal. To test this, we computed the BIS values for our CORALIE measurements (for the definition see Queloz et al., 2001). As can be seen in Fig. 3, the BIS and RV are slightly correlated (slope=0.30.1), though not at a very significant level (correlation coefficient, =0.82). This result is compatible with the output from the simple model described in Sect. 2.
Finally, we searched for phase variations in the RV signal between the FEROS (SHL08) and CORALIE data, obtained with a time span of about one year. The results show that no measurable phase shift was found over more than 300 days to a precision of 1%.
3.2 High resolution near-IR spectroscopy
A planet orbiting TW Hya should be detectable with a similar RV amplitude and orbital period at all wavelength ranges. As mentioned above, if the RV signal reported by SHL08 is caused by a cool spot, the RV amplitude is expected to be smaller in the IR regime. To test these two scenarios, we observed TW Hya with CRIRES, the CRyogenic high-resolution InfraRed Echelle Spectrograph mounted on the VLT (Käufl et al., 2006). To obtain the most accurate RV measurements, we selected a specific setting in the H band defined as 36/1/n (= 1.5884m; 26m) in the CRIRES manual. This setting is populated by deep and sharp CO2 lines that can be used as a simultaneous wavelength reference. The observations were done with a slit width of 0.2”, using a typical ABBA nodding sequence, and a seeing 0.8” in the optical – the objective was to reduce photocenter-induced RV errors while observing at the highest resolution available, estimated as 100 000.
To derive the RV from the spectra we used a cross-correlation method (Baranne et al., 1996). The spectra were correlated simultaneously with a telluric mask, built with the HITRAN database (Rothman et al., 1998), and a stellar mask, built from PHOENIX models (Barman et al., 2005). The atmospheric lines allow us to establish the zeropoint of the wavelength calibration. By subtracting the RV of the atmospheric lines from the target RV, we can correct from instrumental changes following the same principle of the simultaneous ThAr, (e.g. Pepe et al., 2007). The whole procedure will be described in detail in a forthcoming paper (Figueira et al., in prep.).
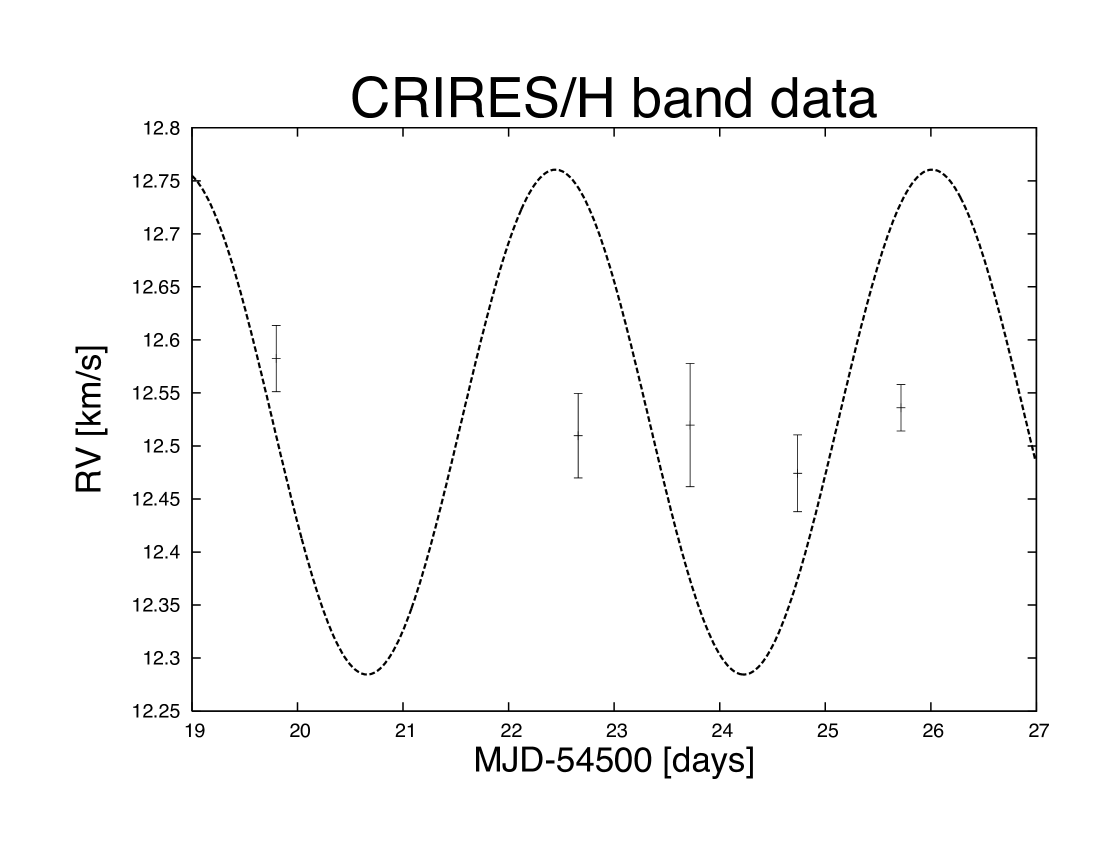
TW Hya was observed five times between Feb 22 and 28 2008. An RV standard (HD108309) was observed immediately after the target each night. We calculated the mean RV per night and assigned a 1 error bar corresponding to the standard deviation of the RV in the nodding cycle. We verified that the measured scatter per night, between 20 and 50 m/s, matched the expected uncertainties as estimated by Bouchy et al. (2001). However, the scatter of the 5 datapoints obtained on different nights is higher ( 90 m/s), testifying the presence of systematic errors. Among others, all the observations in the first night were done with the guiding camera saturated. To remove these effects, and assuming that they affect both TW Hya and the RV standard in the same way, we calculated the relative velocity between TW Hya and the standard for each night. The rms of the five relative RV is 35 m/s, and 22 m/s if we only consider the 4 last points. The results are plotted in Fig. 4 and compared with the fitted orbit (Table 1).
To estimate the match between the IR observations and the fitted orbit (Table 1), we performed a Monte Carlo simulation. For each JD, we built an RV point by adding to the corresponding orbit value an observational error represented by a zero-centered Gaussian distribution with a fixed dispersion. We calculated the probability of obtaining the observed RV dispersion, hence the probability that our five points indeed belong to the fitted orbit. For the observed scatter of 35 m/s (the measured one) and 70 m/s (twice the observed one), the probability that our RV dispersion is drawn from the fitted orbit is always below 10-6.
Finally, we note that, as an important by-product of this work, we have obtained the most accurate RV measurements in the near-IR to date, showing the capabilities of CRIRES in this domain.
3.3 Photometric observations
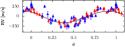
TW Hya was monitored photometrically with the Euler telescope (La Silla, Chile) during 15 nights from 2008 February 2 to March 13 under photometric conditions (except for March 8). Each night, a sequence of six exposures was observed at approximatively the same airmass to minimize any second-order extinction effect. Observations were performed in the R-band and were defocused to 5″to (1) minimize any systematics due to the intra/inter-pixels variations and (2) to allow exposure times of 50s in order to minimize the scintillation noise. The pointing was chosen to include TYC 7208-1066-1 and 3 other fainter isolated comparison stars in the EulerCAM field of view. Aperture photometry was used to extract the fluxes. Figure 5 shows the resulting lightcurve.
TW Hya exhibited 20% (peak to peak) flux variations during the run. The analysis of the lightcurve using both the Lomb-Scargle periodogram (Scargle, 1982) and the string-length method (Dworetsky, 1983) provides tentative periods of 6.1 and 6.5 days, respectively. The origin of this period is not clear and the small time coverage does not allow us to draw further conclusions about this result. The comparison of this value with previous estimates does not help in interpreting our data, since the rotation period of TW Hya is not well-established and very different values (from 1.6 to 4.4 days) have been reported in the literature (e.g. Mekkaden, 1998; Batalha et al., 2002; Lawson & Crause, 2005; Setiawan et al., 2008).

Interestingly, the photometric variations seem to be correlated with the surface of the CORALIE CCF (the CORALIE data and the photometric measurements were obtained on the same nights) – Fig 5, lower panel. Since the CORALIE CCF is a measurement of an average spectral line in the spectral region used, the measurement of its surface is related to the veiling due to the hot spots on the stellar surface (e.g. Andersen et al., 1989). The correlation displayed in Fig. 5 would imply that the photometric variations of TW Hya are dominated by hot spots, something that has already been reported in several studies (e.g. Mekkaden, 1998; Batalha et al., 2002). The V-band amplitudes measured in these works range between 0.2-0.5 mag, that is, they are much larger than the 4% V-band photometric variations predicted by our cold-spot model. The fact that the photometric lightcurve cannot be fitted with the 3.56 days period derived from the spectroscopic data (and assuming this as the true rotational period) can be related to the presence of short-lived hot spots (with typical lifetimes of hours or days) that appear and disappear hiding the true period of the source (see Mekkaden, 1998).
We note that, although the effects of a hot spot on the RV variations are not tested here, we expect them to be significantly weaker than the ones induced by a cold spot. Note that their filling factors are usually between 0.1% and 5% (e.g. Fernandez & Eiroa, 1996), that is, relatively small compared to the one of the dark spot from the model described in Sect. 2.
4 Conclusions
The analysis of new optical and infrared spectra of TW Hya allows us to conclude that the best explanation for the observed RV signal is the presence of a cold spot and not a hot Jupiter orbiting the star. First, we find a clear dependence of the optical RV amplitude on the CCF mask used and, second, the IR RV curve is almost flat, with a small RV scatter (35 m/s) that is inconsistent with the optical, orbital solution. In fact, we show that a simple cool spot model can reproduce the RV observations presented by SHL08. On the other hand, the photometric data are correlated with the surface of the CCF, which points towards a hot spot as the cause of the photometric variability, as reported in previous studies.
Our result shows that searching for planets around young stars is highly demanding and cumbersome. Only the concerted use of the different techniques and instruments presented here were able to clarify the nature of the signal observed in TW Hya. It is, for instance, remarkable that no phase shifts were found in the RV signal between different epochs (Sect. 3.1), which shows that very stable cool spots exist around CTTSs. This must be taken with care when searching for planets around this kind of objects.
Acknowledgements.
We are grateful to the Paranal Science Operation team, in particular to A. Smette. We thank the ESO Director Office for granting DDT observations. NH is funded by Spanish grants MEC/ESP 2007-65475-C02-02, and CAM/PRICIT-S-0505/ESP/0361. NCS, XB, and PF acknowledge the support from Fundação para a Ciência e a Tecnologia (FCT), Portugal, in the form of grant PPCDT/CTE-AST/56453/2004 and scholarship SFRH/BD/21502/2005. XB acknowledges the Gulbenkian Fundação for support through its Estímulo da Investigação program. M.F. was supported by the Spanish grants AYA2006-27002-E, and AYA2007-64052.References
- Andersen et al. (1989) Andersen, J., Lindgren, H., Hazen, M. L., & Mayor, M. 1989, A&A, 219, 142
- Baranne et al. (1996) Baranne, A., Queloz, D., Mayor, M., et al. 1996, A&AS, 119, 373
- Barman et al. (2005) Barman, T. S., Hauschildt, P. H., & Allard, F. 2005, ApJ, 632, 1132
- Batalha et al. (2002) Batalha, C., Batalha, N. M., Alencar, S. H. P., Lopes, D. F., & Duarte, E. S. 2002, ApJ, 580, 343
- Bouchy et al. (2001) Bouchy, F., Pepe, F., & Queloz, D. 2001, A&A, 374, 733
- Dworetsky (1983) Dworetsky, M. M. 1983, MNRAS, 203, 917
- ESA (1997) ESA. 1997, VizieR Online Data Catalog, 1239, 0
- Fernandez & Eiroa (1996) Fernandez, M. & Eiroa, C. 1996, A&A, 310, 143
- Guenther & Esposito (2007) Guenther, E. W. & Esposito, E. 2007, ArXiv Astrophysics e-prints
- Käufl et al. (2006) Käufl, H. U., Amico, P., Ballester, P., et al. 2006, The Messenger, 126, 32
- Lawson & Crause (2005) Lawson, W. A. & Crause, L. A. 2005, MNRAS, 357, 1399
- Mayor et al. (2004) Mayor, M., Udry, S., Naef, D., et al. 2004, A&A, 415, 391
- Mekkaden (1998) Mekkaden, M. V. 1998, A&A, 340, 135
- Melo et al. (2001) Melo, C. H. F., Pasquini, L., & De Medeiros, J. R. 2001, A&A, 375, 851
- Pepe et al. (2007) Pepe, F., Correia, A. C. M., Mayor, M., et al. 2007, A&A, 462, 769
- Pepe et al. (2002) Pepe, F., Mayor, M., Galland, F., et al. 2002, A&A, 388, 632
- Qi et al. (2004) Qi, C., Ho, P. T. P., Wilner, D. J., et al. 2004, ApJ, 616, L11
- Queloz et al. (2001) Queloz, D., Henry, G. W., Sivan, J. P., et al. 2001, A&A, 379, 279
- Rothman et al. (1998) Rothman, L. S., Rinsland, C. P., Goldman, A., et al. 1998, Journal of Quantitative Spectroscopy and Radiative Transfer, 60, 665
- Rucinski & Krautter (1983) Rucinski, S. M. & Krautter, J. 1983, A&A, 121, 217
- Santos et al. (2002) Santos, N. C., Mayor, M., Naef, D., et al. 2002, A&A, 392, 215
- Scargle (1982) Scargle, J. D. 1982, ApJ, 263, 835
- Setiawan et al. (2008) Setiawan, J., Henning, T., Launhardt, R., et al. 2008, Nature, 451, 38
- Wilson et al. (2008) Wilson, D. M., Gillon, M., Hellier, C., et al. 2008, ApJ, 675, L113