A Confirmation of the Strong Clustering of Distant Red Galaxies at
Abstract
Recent studies have shown that distant red galaxies (DRGs), which dominate the high-mass end of the galaxy population at , are more strongly clustered than the population of blue star-forming galaxies at similar redshifts. However these studies have been severely hampered by the small sizes of fields having deep near-infrared imaging. Here we use the large UKIDSS Ultra Deep Survey to study the clustering of DRGs. The size and depth of this survey allows for an unprecedented measurement of the angular clustering of DRGs at and . The correlation function shows the expected power law behavior, but with an apparent upturn at . We deproject the angular clustering to infer the spatial correlation length, finding . We use the halo occupation distribution framework to demonstrate that the observed strong clustering of DRGs is not consistent with standard models of galaxy clustering, confirming previous suggestions that were based on smaller samples. Inaccurate photometric redshifts could artificially enhance the observed clustering, however significant systematic redshift errors would be required to bring the measurements into agreement with the models. Another possibility is that the underlying assumption that galaxies interact with their large-scale environment only through halo mass is not valid, and that other factors drive the evolution of the oldest, most massive galaxies at .
Subject headings:
cosmology: large-scale structure of the universe — galaxies: evolution — galaxies: formation — galaxies: high-redshift — infrared: galaxies1. Introduction
Thus far, the precise measurements of galaxy clustering at that are necessary for meaningful physical interpretation have only been possible for the relatively blue, star-forming galaxies that dominate optical surveys (Adelberger et al., 2005; Lee et al., 2006; Ouchi et al., 2005). However the most massive galaxies at these redshifts tend to be faint in the optical, and are more appropriately selected in the near-infrared (e.g. van Dokkum et al., 2006). In particular, galaxies meeting the criterion for distant red galaxies (DRGs; Franx et al., 2003) have been shown to dominate the high-mass end of the galaxy mass function (van Dokkum et al., 2006; Marchesini et al., 2007a; Rudnick et al., 2006). Measurements of DRG clustering have been severely hampered by small fields and by the near-complete reliance on photometric redshifts. Using the largest DRG sample then available, Quadri et al. (2007a) confirmed the very strong clustering found by previous authors (Daddi et al., 2003; Grazian et al., 2006). They also showed that strong clustering implies that DRGs occupy dark matter halos with . However, the number density of these dark matter halos is at least an order of magnitude smaller than the number density of DRGs, suggesting that the DRG clustering measurements are incompatible with models of dark matter clustering.
Here we use a 0.65 field from the UKIRT Infrared Deep Sky Survey (UKIDSS), which is 8 times larger than the area used by Quadri et al. (2007a) but with similar NIR depth, to determine whether the strong observed clustering of DRGs found in previous studies was an artifact due to limited field sizes or whether some other explanation must be found.
We use . Small changes in these parameters do not affect our basic conclusions. Magnitudes are given in the Vega system, except where noted.
2. Data
The UKIDSS project covers different areas to different depths; here we make use of the deepest UKIDSS dataset, known as the Ultra Deep Survey (UDS). We use the UDS Data Release 1 images (Warren et al., 2007), which reach 5 point-source depths of and . We note that Foucaud et al. (2007) used the UDS Early Data Release to study the clustering of DRGs down to , however such bright DRGs lie primarily at and may not be directly relevant to the galaxies that are the subject of this work. Most of the UDS field has coverage in the optical bands from the Subaru-XMM deep Survey (SXDS)111http://www.naoj.org/Science/SubaruProject/SXDS/. We use the beta-release of the images, which reach depths of 25.3–27.5 (AB magnitudes). Finally, we combine these data with and imaging from the Spitzer Wide-Area Infrared Extragalactic Survey (SWIRE; Lonsdale et al., 2003). The procedures used to create a multicolor -selected catalog from these imaging data are detailed by Williams et al. (2008).
3. Photometric redshifts
Accurate redshift information is fundamentally important for clustering studies. Photometric redshifts were calculated using the EAZY software (Brammer, van Dokkum, & Coppi, 2008)222http://www.astro.yale.edu/eazy/. EAZY fits linear combinations of galaxy templates to the observed photometry using a Bayesian prior for the distribution of redshifts as a function of apparent magnitude. The template set was carefully chosen to provide high-quality photometric redshifts for -selected galaxies in several current deep surveys.
To assess the accuracy of our photometric redshifts we compare to a sample 119 spectroscopic redshifts available in this field (for further description, see Williams et al., 2008). The normalized median absolute deviation of is . As nearly all spectroscopic redshifts in this field are at , and none are for DRGs, we use public data on the well-studied Chandra Deep Field-South (CDF-S) to obtain an estimate of the expected photometric redshift accuracy for the galaxies currently under consideration. We use the photometric catalog of Wuyts et al. (2008), and exclude the filters in order to match the filter set available in the UDS. Restricting the sample to the DRGs in CDF-S with spectroscopic redshifts, we find , with no apparent dependence on DRG redshift and negligible systematic offsets. This suggests that the DRG photometric redshifts in our study also have an accuracy of , although this can only be taken as a rough indication.
The overall redshift distribution of the sample is used to deproject the observed angular correlation function in order to infer the spatial correlation function. This distribution is often estimated simply using a histogram of the photometric redshifts, without taking into account the redshift uncertainties. Because we select DRGs in a specific photometric redshift range, it is expected that random errors will cause galaxies to scatter into the sample from both lower and higher redshifts. It is also expected that galaxies within the redshift selection window will scatter out, however this will not affect the clustering so long as such galaxies are drawn randomly from the sample (systematic errors which cause galaxies to scatter into or out of the selection window are much more problematic). To estimate the intrinsic redshift distribution of the galaxies in our sample, we use Monte Carlo simulations in which the observed photometry is perturbed according the the photometric uncertainties (see also Quadri et al., 2007a). This procedure broadens the distribution relative to what would be inferred from a histogram of photometric redshifts, resulting in a higher correlation length; we return to this point in § 6.
4. Measurements of the DRG correlation function
For a detailed description of the techniques used to perform correlation function measurements, see Quadri et al. (2007a). Here we briefly describe the method, and point out differences between the method used here and in the previous paper. The angular two-point correlation function is calculated using the Landy & Szalay (1993) estimator. Uncertainties are estimated using bootstrap resampling, which yields uncertainties that are significantly larger than those expected from Poisson statistics. We follow the method of Adelberger et al. (2005) to correct for the integral constraint, although the correction is small given the large size of the field.
A potentially serious problem for measurements of the auto-correlation function arises from variable sensitivity or calibration errors across the images. We measured the correlation function of stars in order to test whether such variations induce artificial clustering, obtaining the expected result that stars are unclustered. We have also measured the clustering of DRGs selected from catalogs in which the and zeropoints are varied within their uncertainties independently for each of the pointings that make up the UDS mosaic. Although it is difficult to rule out significant errors in the correlation function arising from such variations, it appears that they are not a dominant source of error.
The redshift distribution of galaxies selected using the DRG color criterion is rather wide, extending from to at least (e.g. Grazian et al., 2006; Quadri et al., 2007b). We therefore impose the additional criterion . Over this redshift range, the DRG criterion effectively selects galaxies with red rest-frame optical colors (Quadri et al., 2007b). We also limit the sample to objects with , ensuring that the catalog is complete and that objects have a sufficient signal-to-noise ratio to calculate accurate photometric redshifts. We visually inspected each object in the sample, rejecting those that appeared to be artifacts in the images or were otherwise deemed to have unreliable photometry. Objects were also rejected if the templates used for photometric redshifts gave poor fits. The final sample consists of 1528 DRGs with .
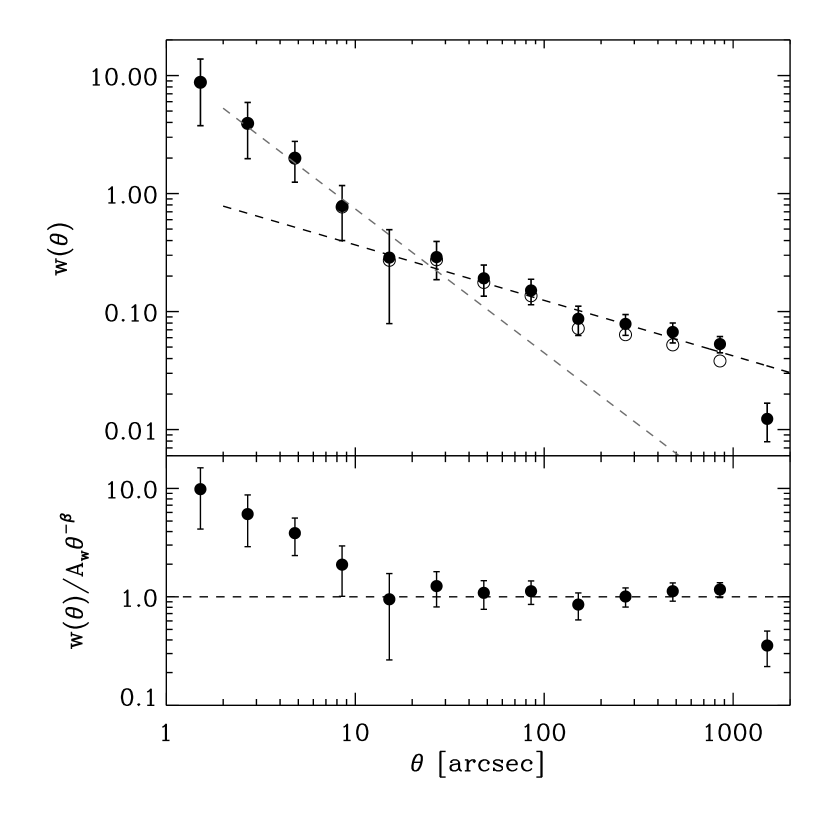
Figure 1 shows the angular correlation function of DRGs. Our measurements confirm the strong angular clustering previously reported by Grazian et al. (2006) and Quadri et al. (2007a), but with reduced uncertainties and extending to much larger angular scales. Immediately apparent is the departure of from a power law on small scales. To illustrate the significance of this excess clustering signal, and to show how the results differ from what would be measured using a smaller field, we fit a power law over the range and over . The former fit yields while the latter fit yields . Note that there is significant covariance between the two fitting parameters, so the uncertainties should be taken as representative only. As noted by previous authors (Adelberger et al., 2005; Lee et al., 2006; Quadri et al., 2007a), the large-scale fit is preferred when comparing galaxy samples, as it better probes the clustering of dark matter halos that host the galaxies.
The bottom panel of Figure 1 shows the residuals from the large-scale power law. A small-scale excess has also been observed in large samples of optically selected galaxies at high redshift (e.g. Ouchi et al., 2005; Lee et al., 2006), and for various galaxy samples at (e.g. Zehavi et al., 2005).
The spatial correlation length can be estimated from using the Limber projection; see e.g. Quadri et al. (2007a) for further details. The result is , where we have used the large-scale fitting parameters and the uncertainty is estimated using the bootstrap simulations described above. This uncertainty accounts for the uncertainty in , but not in the redshift distribution . We use the method of Hamana et al. (2004) to estimate the linear bias directly from , finding .
5. The Halo Model
Quadri et al. (2007a) found that DRGs significantly outnumber the dark matter halos that are clustered strongly enough to host them. Models of the halo occupation distribution (HOD) naturally account for this type of discrepancy by allowing halos to host multiple galaxies, but Quadri et al. (2007a) suggest that the large numbers of galaxies that would be required to share halos can be ruled out by the observed small-scale clustering. Given that the DRG clustering results presented in this work are largely consistent with those from previous works, it is expected that the observations are still in conflict with the models. In this section we use an HOD model to show this explicitly.
In the HOD framework, the galaxy correlation function is understood to be the sum of two components. On large scales the correlation function follows that of the host dark matter halos. On small scales there is an additional contribution from galaxy pairs within individual halos. We follow the modeling procedures described by Lee et al. (2006), to which we refer the reader for details. Briefly, we calculate the number density and bias of halos using the prescriptions of Sheth & Tormen (1999); Sheth, Mo, & Tormen (2001). The halo occupation number, which describes the number of galaxies per halo, is parameterized as for halo mass and otherwise. Thus there are three free parameters, , , and . If the number density of galaxies is known, then one of these parameters can be fixed for assumed values of the other two parameters. We obtain a rough estimate of using the effective volume probed by our sample, which is determined using the redshift selection function described in § 3. This density is in reasonable agreement with an independent estimate of , which is based on the luminosity functions of Marchesini et al. (2007a).

Figure 2 shows two models chosen according to fits. The lower solid line shows a model that is fit over . While this model provides an adequate fit on smaller angular scales, it systematically under-predicts the clustering on larger scales. To better illustrate the nature of the disagreement, it is useful to inspect the upper solid line, which shows a model that is fit only over . While this model provides an adequate fit at larger scales, the small-scale fit is unacceptable. As already noted, the fundamental reason that no model can fit the data is that the strong clustering on large scales implies that DRGs must occupy very massive halos. But DRGs outnumber these halos by a factor of 20, which is only possible if individual halos host a large number of DRGs. This would mean that each DRG has a high probability of having several neighbors in the immediate vicinity, leading to a very prominent small-scale excess in .333Specifically, the amplitude of the one-halo term depends on the second factorial moment of , which we parameterize following Bullock et al. (2002). Note that this particular choice does not affect the main result of this section because, for the high value found here, it is generically expected that follows a Poisson distribution for a fixed (e.g. Zheng et al., 2005); this fully specifies the moments. As can be seen, the observed excess is much smaller than expected.
6. Discussion
We have used the UKIDSS-UDS to perform the first precise measurement of the clustering of red, -selected galaxies at . These DRGs show strong angular clustering that is well-described by a power law, but with an excess at small scales. We use photometric redshifts to deproject the angular clustering, finding the spatial correlation length . This value is comparable to that measured for luminous red galaxies in the local universe (Zehavi et al., 2005), however DRGs are significantly more numerous. We show that standard models of halo occupation statistics are unable to simultaneously reproduce the observed clustering and number density, because DRGs outnumber their inferred host dark matter halos by too large a margin.
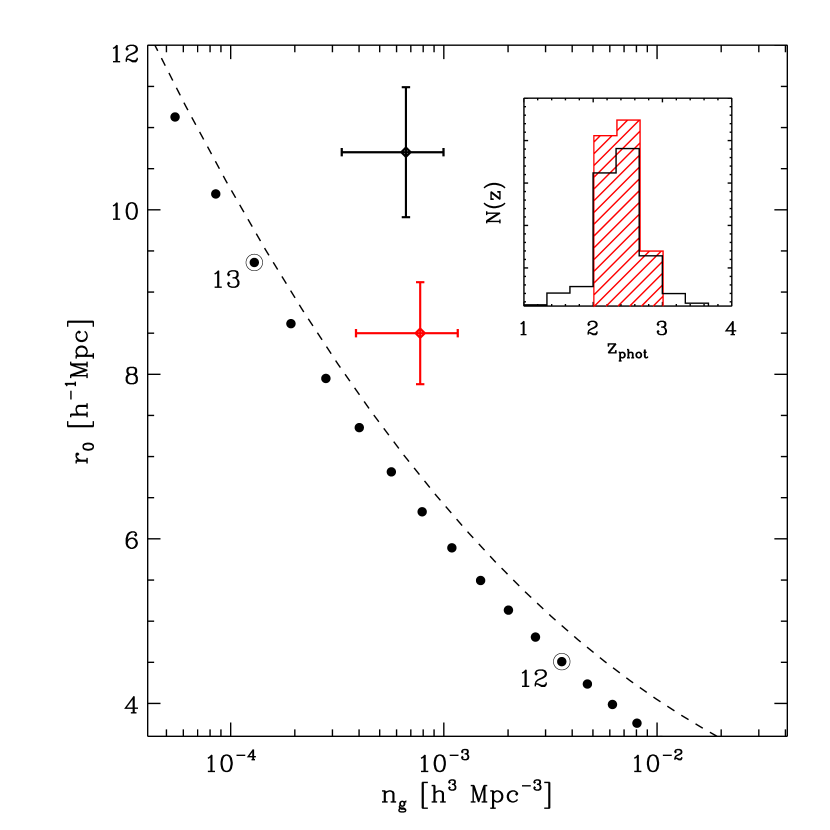
The most obvious explanation is that we have used the incorrect redshift distribution in deprojecting the angular correlation function. A narrower distribution would reduce the correlation length (while a moderate shift in the overall distribution makes a relatively smaller difference). However, a narrower redshift distribution would also decrease the effective volume probed by our sample, thereby increasing . We illustrate these effects in Figure 3, which shows the observed and compared to the range of values for a typical HOD model. It also shows how estimating directly from the unperturbed photometric redshifts — which, as mentioned in § 3, represents the extreme assumption of no random photometric redshift errors — affects the results. It may still be the case that we are subject to systematic redshift errors, but we also note that a significantly narrower would adversely affect the reasonably good agreement between our estimate of and the luminosity functions derived by Marchesini et al. (2007a). Finally, we have verified that our basic results hold when using a different photometric redshift code (HYPERZ Bolzonella, Miralles, & Pelló, 2000) and with a different template set (Bruzual & Charlot, 2003).
Given the apparently high quality of our photometric redshifts, as well as the consistency with previous results for the clustering of DRGs, it is worth considering alternative explanations. One possibility is that current HOD models are too simplistic, and that massive red galaxies occupy halos in unexpected ways. The fundamental assumption underlying these models is that galaxy observables depend on halo mass, and not on the larger-scale environment or on halo properties such as structure or age. But environment may play a role, for instance via its effect on mass accretion rates (Scannapieco & Thacker, 2003; Furlanetto & Kamionkowski, 2006). Additionally, halo clustering varies with several halo properties, even at fixed mass; this phenomenon is generically referred to as “assembly bias” (e.g. Gao & White, 2007). To the extent that these properties affect galaxy observables, they will also affect galaxy clustering measurements. However, we note that current estimates for the strength of the assembly bias are too small to account for the observed discrepancies. As an example, Gao & White (2007) have found that, at and in the relevant halo mass range, halos in the upper 20 tail of the distribution of halo spins have a 20 larger bias than the mean value. It might then be supposed that DRGs occupy less massive and more numerous halos with higher spin. But the increased number density of these low mass halos is approximately cancelled by the requirement that DRGs can only occupy 20 of them, so the discrepancy in number densities is unchanged.
The existence of massive red galaxies at was not predicted by models of galaxy formation, although progress has been made on this front (e.g. Croton et al., 2006; De Lucia & Blaizot, 2007, but see Marchesini & van Dokkum 2007b). The results shown here suggest that the conflict between models and observations extends to the relationship between galaxies and dark matter halos. However, clustering measurements are sensitive to a number of systematic effects, so our conclusions remain tentative. The most obvious source of error comes from our use of photometric redshifts. Ongoing medium-band NIR observations will significantly reduce the photometric redshift uncertainties (van Dokkum et al., 2008), and in the longer term multi-object NIR spectrographs will also improve the situation. If future work confirms our results, clustering measurements such as those presented here may provide a new way to understand the detailed relationship between galaxy and halo properties.
References
- Adelberger et al. (2005) Adelberger, K. L., Steidel, C. C., Pettini, M., Shapley, A. E., Reddy, N. A., & Erb, D. K. 2005, ApJ, 619, 697
- Bolzonella, Miralles, & Pelló (2000) Bolzonella, M., Miralles, J.-M., & Pelló, R. 2000, A&A, 363, 476
- Brammer, van Dokkum, & Coppi (2008) Brammer, G., van Dokkum, P., & Coppi, P. 2008, ApJ, submitted
- Bruzual & Charlot (2003) Bruzual, G., & Charlot, S. 2003, MNRAS, 344, 1000
- Bullock et al. (2002) Bullock, J. S., Wechsler, R. H., & Somerville, R. S. 2002, MNRAS, 329, 246
- Croton et al. (2006) Croton, D. J., et al. 2006, MNRAS, 365, 11
- De Lucia & Blaizot (2007) De Lucia, G., & Blaizot, J. 2007, MNRAS, 375, 2
- Daddi et al. (2003) Daddi, E., et al. 2003, ApJ, 588, 50
- Foucaud et al. (2007) Foucaud, S., et al. 2007, MNRAS, 376, L20
- Franx et al. (2003) Franx, M., et al. 2003, ApJ, 587,L79
- Furlanetto & Kamionkowski (2006) Furlanetto, S. R., & Kamionkowski, M. 2006, MNRAS, 366, 529
- Gao & White (2007) Gao, L., & White, S. D. M. 2007, MNRAS, 377, L5
- Grazian et al. (2006) Grazian, A., et al. 2006b, A&A, 453, 5, 07
- Hamana et al. (2004) Hamana, T., Ouchi, M., Shimasaku, K., Kayo, I., & Suto, Y. 2004, MNRAS, 347, 813
- Kravtsov et al. (2004) Kravtsov, A. V., et al. 2004, ApJ, 609, 35
- Landy & Szalay (1993) Landy, S. D., & Szalay, A. S. 1993, ApJ, 412, 64
- Lee et al. (2006) Lee, K., Giavalisco, M., Gnedin, O. Y., Somerv ille, R. S., Ferguson, H. C., Dickinson, M., & Ouchi, M. 2006, ApJ, 642, 63
- Lonsdale et al. (2003) Lonsdale, C. J., et al. 2003, PASP, 115, 897
- Marchesini et al. (2007a) Marchesini, D., et al. 2007a, ApJ, 656, 42
- Marchesini & van Dokkum (2007b) Marchesini, D., & van Dokkum, P. G. 2007b, ApJ, 663, L89
- Ouchi et al. (2005) Ouchi, M., et al. 2005, ApJ, 635, L117
- Quadri et al. (2007a) Quadri, R., et al. 2007, ApJ, 654, 138
- Quadri et al. (2007b) Quadri, R., et al. 2007, AJ, 134, 1103
- Roche et al. (1999) Roche, N., Eales, S. A., Hippelein, H., Willot, C. J. 1999, MNRAS, 306, 538
- Rudnick et al. (2006) Rudnick, G., et al. 2006, 650, 624
- Scannapieco & Thacker (2003) Scannapieco, E., & Thacker, R. J. 2003, ApJ, 590, L69
- Sheth & Tormen (1999) Sheth, R. K., & Tormen, G. 1999, MNRAS, 308, 119
- Sheth, Mo, & Tormen (2001) Sheth, R. K., Mo, H. J., & Tormen, G. 2001, MNRAS, 323, 1
- van Dokkum et al. (2006) van Dokkum, P. G., et al. 2006, ApJ, 638, L59
- van Dokkum et al. (2008) van Dokkum, P., et al. 2008, NOAO/NSO Newsl. 94, http://www.noao.edu/noao/noaonews/jun08/pdf/94news.pdf
- Warren et al. (2007) Warren, S. J., et al. 2007, MNRAS375, 213
- Williams et al. (2008) Williams, R. J., Quadri, R. F., Franx, M., van Dokkum, P., Labbé, I. 2008, ApJ, submitted
- Wuyts et al. (2008) Wuyts, S., Labbé, I., Förster Schreiber, N. M., Franx, M., Rudnick, G., Brammer, G. B. 2008, ApJ, in press (arXiv:0804.0615)
- Zehavi et al. (2005) Zehavi, I., et al. 2005, ApJ, 621, 22
- Zheng et al. (2005) Zheng, Z., et al. 2005, ApJ, 633, 791