Divergent resistance at the Dirac point in graphene: Evidence for a transition in a high magnetic field
Abstract
We have investigated the behavior of the resistance of graphene at the Landau Level in an intense magnetic field . Employing a low-dissipation technique (with power 3 fW), we find that, at low temperature , the resistance at the Dirac point undergoes a 1000-fold increase from 10 k to 40 M within a narrow interval of field. The abruptness of the increase suggests that a transition to an insulating, ordered state occurs at the critical field . Results from 5 samples show that depends systematically on the disorder, as measured by the offset gate voltage . Samples with small display a smaller critical field . Empirically, the steep increase in fits acccurately a Kosterlitz-Thouless-type correlation length over 3 decades. The curves of vs. at fixed approach the thermal-activation form with a gap 15 K as , consistent with a field-induced insulating state.
pacs:
73.63.-b,73.21.-b,73.43.-fI Introduction
In graphene, the low energy states display a linear energy-momentum dispersion described by the Dirac Hamiltonian. The observation of the integer quantum Hall (QH) effect by Novoselov et al. Novoselov1 ; Novoselov2 ; Novoselov3 and Zhang et al. Zhang1 ; Zhang2 ; Jiang has sparked intense interest in this novel 2D (two-dimensional) system. In a strong magnetic field , the states are quantized into Landau Levels. As a result of the Dirac dispersion, the energy of the Landau Level (LL) (of index ) increases with the flux density as , viz. , where is the Fermi velocity, the electron charge, and is Planck’s constant. The Hall conductivity is observed to be accurately quantized as , where is the electron charge, is Planck’s constant, and the sublevel index. A key question is the nature of the ground state at the Dirac point. In intense , theory predicts interesting broken-symmetry states driven by exchange and interaction. These are characterized as quantum Hall Ferromagnetism (QHF) MacDonald ; Alicea ; Yang ; Abanin06 ; Goerbig ; Ezawa , or excitonic condensation Khvesh ; Miransky06 ; Gorbar ; MiranskyEPL . These collective states imply the existence of field-induced phase transitions, but the experimental situation is rather unsettled. Moreover, the proposed Abanin06 ; Fertig ; AbaninGeim existence of counter-propagating edge modes at the Dirac point has further enriched the theoretical debate. Is the high-field Dirac point a QH insulator or a QH metal?
Recently, we reported Check that the resistance at the Dirac point begins to increase steeply at = 10-12 T, suggesting a transition to an insulating state. However, the results left open several key questions. Because increased by only 1-decade (to 0.2 M) Check , we could not establish that the high-field state is truly insulating. In graphene, the extreme sensitivity to thermal runaway has been highly problematical for researching its high- ground state Zhang2 ; Jiang ; Check . Adopting a low-dissipation technique to avoid self-heating, we have measured the divergence in to 40 M () in 3 samples. Remarkably, the divergence is accurately described over 3 decades by the Kosterlitz-Thouless (KT) correlation length. The singular nature of the divergence provides strong evidence that a 2D transition to an insulating state occurs when exceeds a critical field . The systematic variation of with (the gate voltage needed to bring the chemical potential to the Dirac point) implies that disorder is very effective in delaying to higher field values. In all samples investigated to date, the transition to the insulating state is reached in fields below 35 T.
II Experimental Details
Empirically, problems associated with self-heating in graphene become serious when the power dissipated exceeds 10 pW for bath temperature 1 K. As discussed in the Appendix, self-heating below 1 K leads to a number of spurious features caused by thermal instability in the sample. We adopted a simple voltage-controlled technique with ultra-low dissipation that avoids this difficulty, and allows the divergence in to be measured reliably to 40 M. An ac source maintains a fixed voltage amplitude (40 V) across the sample in series with a 100-k resistor (details are given in the Appendix). By phase-sensitive detection of both the current and the voltage , we have made 4-probe measurements of with ultra-low dissipation ( decreases from 3 fW at 10 T to 40 aW above 25 T). Moreover, for 1.5 K, the sample is immersed in liquid 3He so that the electrons in graphene are in direct contact with the bath. The largest reliably-measured is now 40 M (limited by the input impedance 100 M of the preamplifier). The new results provide an enlarged view of the interesting region in which diverges. The samples K52 and J24 have offset voltages much larger than that in K7, the sample investigated in detail in Ref. Check . All samples except J18 were measured as-fabricated. Sample J18 was subject to a hr. anneal in He gas at 80 C which decreased to 8 V. However its large suggests that its initial value of (before annealing) is very large.
In Samples K52, J18 and J24, the spacings between voltage leads are 3.5, 2.75 and 3 m, while the widths are 3, 3 and 2 m, respectively.
III Field dependence of
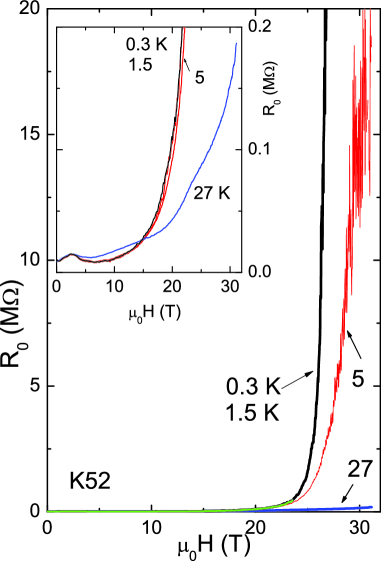
Figure 1 (main panel) shows curves of vs. in K52 at temperatures = 0.3 to 27 K. As evident in the curves at 0.3 and 1.5 K, undergoes a very steep, divergent increase when exceeds 25 T. The region just before the divergence occurs is shown in greatly expanded scale in the inset. At 27 K, the increase in is relatively modest (20) between = 0 and 31 T (inset). However, as decreases to 5 K, the increase steepens sharply, as reported Check for K7. Further cooling from 5 to 0.3 K changes the profile only very slightly. In the main panel, the curves at 0.3 and 1.5 K (which cannot be distinguished) show that diverges to 40 M, with a slope that steepens rapidly with . The 3-decade increase (40 k 40 M) occurs within the narrow interval 17–27 T. We find that the observed divergence is too steep to fit a power-law of the kind , with and a critical field.
As in Ref. Check , we compare the divergence with that predicted for the Kosterlitz-Thouless (KT) transition. In 2D systems described by the XY model, the ordered phase is destroyed at the KT transition by unbinding of pairs of topological excitations (e.g. vortices). As the transition here is induced by varying the applied field , we replace the reduced temperature by the reduced field , with the critical field. In the limit , the KT correlation length diverges as
| (1) |
where is the lattice parameter and a number .
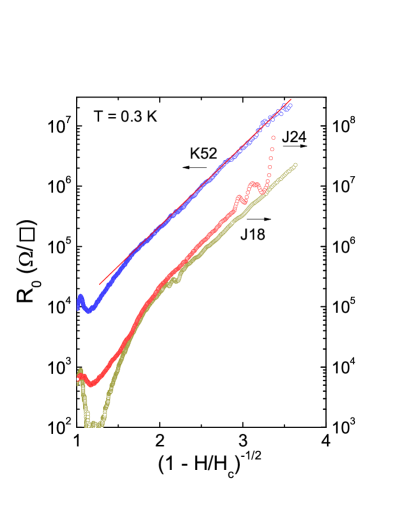
The quality of the fit to Eq. 1 is best revealed in a plot of vs. the quantity . In Fig. 2, we have plotted in 3 samples K52, J19 and J24 against . In each sample, the value of is adjusted to maximize the high-field portion of the plot that falls on a straight line (this is the only adjustment made). In Samples K52, J18 and J24, the inferred values of are 29.1, 32.1 and 35.5 T, respectively. The values of in K52 fit the straight line representing the expression , with = 29.1 T and = 1.54. The value of is consistent with the KT transition. The 3-decade span is strong evidence that Eq. 1 accurately describes the divergence in , and supports the inference that, at low , we are observing a 2D KT-type phase transition to a high-field ordered state that is insulating.
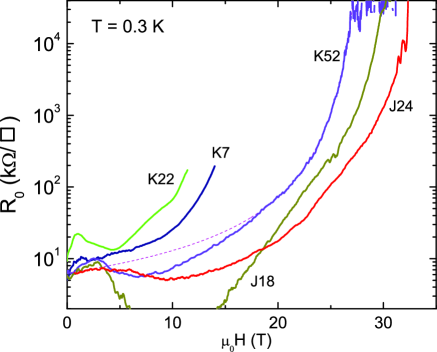
The significant spread of inferred from the fits in Fig. 2 is in accord with Ref. Check which reported that correlates with the offset voltage . In Fig. 2, the samples K52, J18 and J24 display a much larger critical field than the sample K7 (with = 1 V and = 18 T) studied in detail in Ref. Check . Figure 3 plots together, in log-log scale, the curves of vs. in the 5 samples for which we have detailed high-field transport results. The systematic shift to higher fields of the divergence (in the order K22, K7, K52 and J24) is matched by the increase in their (-0.5, 1, 3, 20 and 24 V, respectively). The value of before annealing in J18 is not known. The dependence of on is non-linear. Initially (for V), increases rapidly, but appears to increase rather slowly when exceeds 20 V.
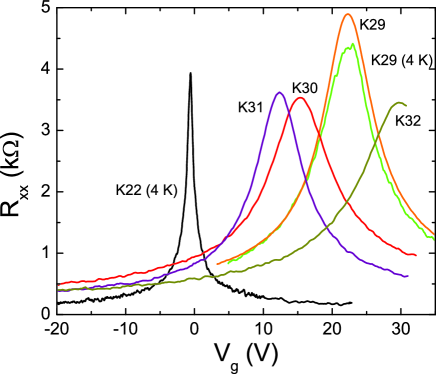
From a study of how affects the zero-field transport, we have obtained evidence that the zero-field mobility is strongly suppressed if is large. In Fig. 4, we display curves of vs. the unshifted gate voltage in a batch of samples that includes K22. The curves are taken at 295 K or 4 K (as indicated). In each sample, the width of the peak at the Dirac point directly measures . Clearly, the width increases dramatically with . These results support the inference that a large offset gives rise to large electronic disorder which enhances disorder scattering and suppresses . In turn, in an intense field, the transition field is pushed to higher values. While these correlations do not exclude other factors that may influence , we have found that is the single most reliable predictor of the field scale at which the divergence onsets at low .
IV Doping dependence
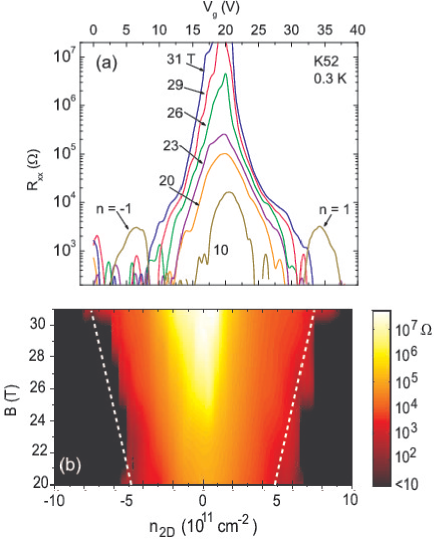
Further insight into the nature of the divergence is obtained by viewing the behavior of the longitudinal resistance vs. in a narrow gate window around the Dirac point at fixed (with kept at 0.3 K). Figure 5a displays a series of curves of (in log scale) vs. in K52 for fields T. At 10 T, displays 3 well-separated peaks corresponding to LL at 20 V and the 1 LL’s at 6 and 38 V, respectively. For 20 T, the 1 levels move out of the gate-voltage window. We focus on the divergent enhancement of the central peak as increases to 31 T. The key feature is that at the Dirac point ( = 20 V) rises most rapidly especially for 25 T.
It is instructive to view (at 0.3 K) as a contour plot in the – plane where is the 2D density of carriers doped by gating (Fig. 5b). The color bar (right) gives the magnitude of . Interestingly, the steep increase in with is confined to the region between the dashed lines, which trace the sublevel degeneracy . This suggests that only the states within the lowest sublevels (on either side of ) are affected by the opening of the gap . The contours appear to converge to a rounded cusp at , but with a curvature that increases rapidly with . At the largest (white region), the contour resembles a a narrow, sharp wedge. The contour pattern suggests that increases very rapidly from the value 29.1 T, as deviates from 0.
The physical picture implied by the results is that, at the Dirac point, a field-induced transition to a gapped, insulating state occurs at . The value of is highly sensitive to slight deviations away from exact charge neutrality (Fig. 5). As we decrease below , the ordered state is unstable to the spontaneous unbinding of (vortex-like) topological excitations which have a mean spacing of (Eq. 1). Because fits accurately to over 3 decades, we infer that the conductance scales as the density of excitations. Hence the excitations are charged, and they carry the entire current in the limit . As this conduction channel is qualitatively distinct from thermally activated carriers, it may account for the unusual “saturation” behavior of vs. Check . As , with fixed near , the conduction crosses over at 1 K from a steep, thermally activated channel to a -independent channel carried by the excitations (Fig. 1b).
V Temperature dependence
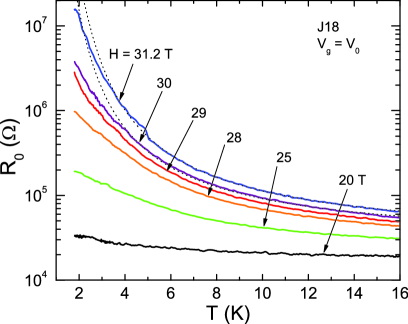
The dependence of in J18 with fixed at selected values is displayed in semilog scale in Fig. 6. At the relatively high field = 20 T, the 2-fold increase in between 16 and 2 K is quite modest. However, above 20 T, the dependence steepens rapidly. As is increased towards the critical (=32.1 T), the profile of moves ever closer to the activated form . We have plotted fits to the activated form (dashed curves) at the 2 highest fields = 30 and 31.2 T. At the highest , the measured tracks closely the dashed curve until falls below 3 K where it deviates downwards. As decreases further from , the deviations start at a higher . The gap value equals 12.9 and 14.7 K at 30 and 31.2 T, respectively. The latter provides an estimate of the energy gap in the ordered state for J18. Establishing that is thermally activated when is an essential goal, as it shows that the ground state above is a true insulator with a well-defined gap order parameter (as opposed to a state in which the carriers are strongly localized). Although the curves in Fig. 6 come close to establishing this result, measurements of vs. in samples with more accessible are desirable.
Interestingly, throughout the pre-transition region (), also displays large increases with decreasing . The carriers are strongly affected by the impending insulating state. We interpret these changes as reflecting very strong fluctuations in the order parameter that characterizes the ordered insulating phase. The strong dependence is also apparent in the fixed- curves shown in Fig. 1.
Quite apart from the thermal activation argument, there are other evidence to suggest that the divergence is not consistent with electron localization. As evident from measuring the widths of the peaks of vs. taken in zero , samples with smallest are the least disordered. The electron mobility decreases from 2.5 to 0.5 T-1 as increases from 0.5 to 20 V. With this trend in mind, we compare in Fig. 3 the profiles of vs. in K52 with K7 and K22 Check . In Samples K22 and K7 (with = -0.6 and 1 V, respectively), the divergence in is apparent in relatively low (below 12 T). By contrast, we must go to much higher fields (20 T) in K52. The dashed line is the fit to in K52 ( 18 T) described above.
In the localization scenario, the observed divergence of in strong field is explained by postulating that induces localization of the electrons. However, applying this reasoning to the 3 samples in Fig. 3, we would conclude that a modest is sufficient to trigger the localization in clean samples, but very intense fields are needed in dirtier samples. This implies that disorder and field act in opposition to bring about localization, which is in conflict with physical intuition. In addition, localization induced by cannot lead to the singular divergence observed in (Fig. 2). For these reasons, we believe that localization is not a viable explanation for the divergence in .
VI Discussion
In the absence of Zeeman splitting and electron-electron interaction, the LL is 4-fold degenerate corresponding to the (physical) spin degeneracy indexed by and the and valley degeneracy indexed by . At , the energy of the LL, , is zero. The effect of interaction in producing a broken-symmetry ground state has been investigated by several groups. To discuss our experiment, it is convenient to distinguish 2 different theoretical scenarios for the LL.
In one scenario, the Quantum Hall Ferromagnet (QHF) models, the exchange energy leads to ferromagnetic polarization of the physical spins MacDonald ; Goerbig ; Alicea ; Abanin06 ; Fertig . This produces a spin gap in the bulk without affecting the valley degeneracy, i.e. with the Bohr magneton. Near the edge of the sample, the residual valley degeneracy is lifted by the edge potential. An important consequence of the QHF scenario at is the existence of spin-filtered counter-propagating edge (CPE) modes which result in a residual conductance of regardless of the magnitude of the spin gap in the bulk Abanin06 ; AbaninGeim ; Fertig . [In principle, the CPE modes are not present if the exchange polarizes instead the valleys to produce the bulk gap (this involves the same exchange energy ). However, most investigators favor the spin-polarization scenario in graphene because it is augmented by the Zeeman energy (the valley-polarization scenario is also called the QHF following the original usage Moon in quadratic, bilayer GaAs-based devices).]
In the second scenario, called magnetic catalysis Khvesh ; Miransky06 ; Gorbar ; MiranskyEPL ; Ezawa , the field component normal to the graphene sheet triggers electron-hole condensation. The instability introduces a mass term to the Dirac equation which leads to the order parameter Khvesh ; Miransky06 ; Gorbar , where and are the wave functions of electrons of spin and valley at sites A and B, respectively. The instability – a solid-state realization of chiral-symmetry breaking in (2+1)D Miransky94 – results in preferential occupation of, say, the A sublattice sites over the B sites, and drives the system into an insulating state. Significantly, the instability is strongest for .
The steep increase in vs. first reported in Ref. Check implies that at large , the ground state at the Dirac point has a resistance at least 20 times larger than the quantum . Although the measurements were limited to 0.3 M, the upturn appeared to diverge at a critical field , suggestive of a singular field dependence. The findings are clearly at odds with the existence of CPE modes (see, however, the results in Ref. AbaninGeim ).
In the present report, we have extended by a factor of 200 the range of resistance measurements and shown that, at 0.3 K, the increase in is truly divergent as well as singular. Moreover, this behavior has been observed in all samples investigated to date by us in high fields. The evidence amassed clearly establish that the high-field ground state at the Dirac point is a true insulator (at least for samples prepared on a SiO2 substrate). Ipso facto, the CPE modes do not exist in the insulating state. However, our results do not preclude them at low fields.
Lately, several groups have considered how the CPE modes are affected by intense field. A very interesting possibility is that an intense field destroys the CPE modes in a field-induced transition. It has been pointed out to us that the CPE modes are not protected against 2-particle exchange scattering with spin flip Haldane . As the exchange energy increases with , the increased scattering rate could lead to a gap in the edge modes.
In the magnetic catalysis scenario, Gorbar et al. Gorbar recently considered the competition between the mass gap and the spin gap (augmented by Zeeman energy) and inferred that CPE states exist only above a critical field .
Shimshoni et al. Shimshoni have proposed that scattering off magnetic impurities can lead to strong localization of electrons in CPE modes which can mimic a KT transition. However, this scenario needs to be reconciled with the observed nearly activated behavior of as well as the variation of with in different samples.
VII Appendix
Near the Dirac point, resistance traces are strongly distorted when the Ohmic heating exceeds 10 pW at bath temperatures below 1 K. As examples, we plot in Fig. 7 resistance traces (with fixed). In Panel a, the inferred curve of vs. , measured with = 31 T, = 10 nA and = 0.3 K, shows a pronounced dip near the Dirac point caused by self-heating instability (the true exceeds 10 M). Panel b shows “” vs measured at fixed . In the curve for K23 (at 5 K), self-heating reverses the trend of . The downturn is avoided when is decreased to 1 nA, but the measured curve (in K22 at 0.3 K) is still greatly suppressed from the true divergent profile.
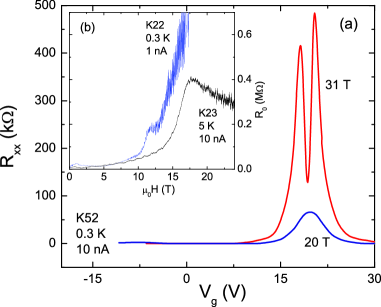
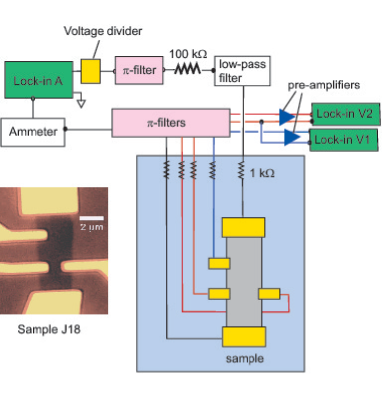
Figure 8 is a schematic of the measuring circuit employed in the ultralow-dissipation technique. A nominally constant ac voltage (40 V) of frequency 3 Hz is applied across the sample in series with a 100-k buffer resistor. The current passing through the sample is measured by a Keithley picoammeter whose output is phase-detected by the lock-in amplifier A. Simultaneously, the longitudinal voltage and Hall voltage are phase-detected by 2 other lock-ins. As shown, all wires entering the dewar are filtered and buffered to exclude extraneous RF signals which may be a potential source of sample heating.
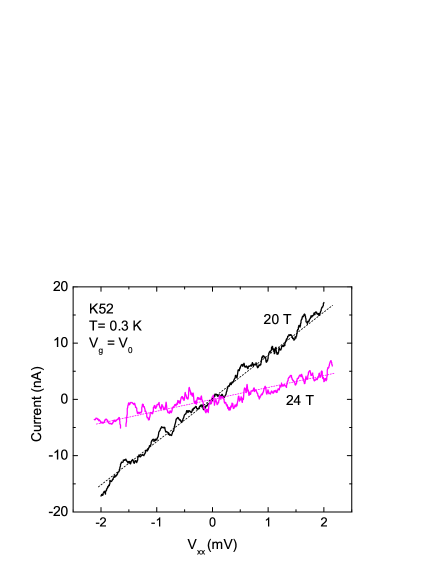
Using the ultralow-dissipation technique, we completely avoid the thermal runaway problems illustrated in Fig. 7. At selected fields, we have performed - measurements to check that self-heating is not skewing the results even at our lowest (0.3 K). Figure 9 shows curves of vs. at the Dirac point in K52 at = 0.3 K with fixed at 20 and 24 T. The linearity implies that self-heating is not observable up to a bias voltage of 2 mV. Since all the curves displayed in the main text were taken with a bias of 40 V, we are comfortably within the Ohmic regime.
We thank H. A. Fertig, P. A. Lee, D. Abanin, V. A. Miransky,
E. Shimshoni, F. D. M. Haldane and D. N. Sheng for
valuable comments, and acknowledge support from NSF-MRSEC under Grant DMR-0819860,
and from the Princeton Center for Complex Materials. The experiments were performed at the National High Magnetic Field Laboratory, which is supported by NSF Cooperative Agreement No. DMR-084173, by the State of Florida, and by the Department of Energy.
∗Current address of LL: Dept. of Physics, MIT
References
- (1) K. S. Novoselov, A. K. Geim, S. V. Morozov, D. Jiang, Y. Zhang,. V. Dubonos, I. V. Grigorieva, A. A. Firsov, Science 306, 666-669 (2004).
- (2) K. S. Novoselov, D. Jiang, F. Schedin, T. J. Booth, V. V. Khotkevich, S. V. Morozov, A. K. Geim, Proc. Natl. Acad. Sci. USA 102, 10451-10453 (2005).
- (3) K. S. Novoselov, A. K. Geim, S. V. Morozov, D. Jiang, M. I. Katsnelson, I. V. Grigorieva, S. V. Dubonos A. A. Firsov, Nature 438, 197-200 (2005).
- (4) Y. Zhang, J. Tan, H. L. Stormer and P. Kim, Nature 438, 201-204 (2005).
- (5) Y. Zhang, Z. Jiang, J. P. Small, M. S. Purewal, Y.-W. Tan, M. Fazlollahi, J. D. Chudow, J. A. Jaszczak, H. L. Stormer, P. Kim, Phys. Rev. Lett. 96, 136806 (2006).
- (6) Z. Jiang, Y. Zhang, H. L. Stormer and P. Kim, Phys. Rev. Lett. 99, 106802 (2007).
- (7) K. Nomura and A. H. MacDonald, Phys. Rev. Lett. 96, 256602 (2006).
- (8) J. Alicea and M. P. A. Fisher, Phys. Rev. B74, 075422 (2006).
- (9) Kun Yang, S. Das Sarma and A. H. MacDonald, Phys. Rev. B74, 075423 (2006).
- (10) M. O. Goerbig, R. Moessner and B. Douçot, Phys. Rev. B74, 161407(R) (2006).
- (11) Motohiko Ezawa, J. Phys. Soc. Japan 76, 094701 (2007).
- (12) D. A. Abanin, P. A. Lee and L. S. Levitov, Phys. Rev. Lett. 96, 176803 (2006).
- (13) D. V. Khveshchenko, Phys. Rev. Lett. 87, 206401 (2001).
- (14) V. P. Gusynin, V. A. Miransky, S. G. Sharapov and I. A. Shovkovy, Phys. Rev. B74, 195429 (2006).
- (15) E. V. Gorbar, V. P. Gusynin and V. A. Miransky, Low Temp. Phys. 34, 790-793 (2008).
- (16) V. P. Gusynin, V. A. Miransky, S. G. Sharapov, and I. A. Shovkovy, Phys. Rev. B 77, 205409 (2008).
- (17) H. A. Fertig and L. Brey, Phys. Rev. Lett. 97, 116805 (2006).
- (18) Dmitry A. Abanin, Kostya S. Novoselov, Uli Zeitler, Patrick A. Lee, A. K. Geim, and L. S. Levitov Phys. Rev. Lett. 98, 196806 (2007).
- (19) Joseph G. Checkelsky, Lu Li, and N. P. Ong, Phys. Rev. Lett. 100, 206801 (2008).
- (20) K. Moon, H. Mori, Kun Yang, S. M. Girvin, A. H. MacDonald, L. Zheng, D. Yoshioka, and Shou-Cheng Zhang, Phys. Rev. B 51, 5138 (1995).
- (21) V. P. Gusynin, V. A. Miransky, and I. A. Shovkovy, Phys. Rev. Lett. 73, 3499 (1994); Phys. Rev. D52, 4718 (1995).
- (22) F. D. M. Haldane and D. N. Sheng, private communication.
- (23) E. Shimshoni, H. A. Fertig, and G. Venketeswara Pai, cond-mat. arXiv:0807.2867v1.