Local structures of polar wurtzites Zn1-xMgxO studied by Raman and 67Zn/25Mg NMR spectroscopies and by total neutron scattering
Abstract
Local compositions and structures of Zn1-xMgxO alloys have been investigated by Raman and solid-state 67Zn/25Mg nuclear magnetic resonance (NMR) spectroscopies, and by neutron pair-distribution-function (PDF) analyses. The and Raman modes of Zn1-xMgxO display Gaussian- and Lorentzian-type profiles, respectively. At higher Mg substitutions, both modes become broader, while their peak positions shift in opposite directions. The evolution of Raman spectra from Zn1-xMgxO solid solutions are discussed in terms of lattice deformation associated with the distinct coordination preferences of Zn and Mg. Solid-state magic-angle-spinning (MAS) NMR studies suggest that the local electronic environments of 67Zn in ZnO are only weakly modified by the 15 % substitution of Mg for Zn. 25Mg MAS spectra of Zn0.85Mg0.15O show an unusual upfield shift, demonstrating the prominent shielding ability of Zn in the nearby oxidic coordination sphere. Neutron PDF analyses of Zn0.875Mg0.125O using a 2 2 1 supercell corresponding to Zn7MgO8 suggest that the mean local geometry of MgO4 fragments concurs with previous density functional theory (DFT)-based structural relaxations of hexagonal wurtzite MgO. MgO4 tetrahedra are markedly compressed along their -axes and are smaller in volume than ZnO4 units by 6 %. Mg atoms in Zn1-xMgxO have a shorter bond to the -axial oxygen atom than to the three lateral oxygen atoms, which is distinct from the coordination of Zn. The precise structure, both local and average, of Zn0.875Mg0.125O obtained from time-of-flight total neutron scattering supports the view that Mg-substitution in ZnO results in increased total spontaneous polarization.
pacs:
71.55.Gs, 77.22.Ej, 78.30.-j, 61.05.fm, 61.05.QrI Introduction
Research in the area of polar semiconductor heterostructures has been growing rapidly, driven in large part by interest in two-dimensional electron gas (2DEG) systems.Tsuka ; Koike ; Rajan ; Sasa ; Tampo 2DEGs are known to form at heterojunction interfaces that bear polarization gradients. They can display extremely high electron mobilities, especially at low temperatures, owing to spatial confinement of carrier motions.Davies Recent reports of 2DEG behaviors in Ga1-xAlxN/GaN and Zn1-xMgxO/ZnO heterostructures have great significance for the development of novel high-electron-mobility transistors (HEMTs)Rajan ; Sasa ; Tampo and quantum Hall devices.Tsuka
2DEG structures are usually designed by interfacing a polar semiconductor with its less or more polar alloys in an epitaxial manner. Since the quality of the 2DEG depends critically on interface perfection, as well as the polarization gradient at the heterojunction, understanding compositional and structural details of the parent and alloy semiconductors is an important component in 2DEG design and fabrication. The evolution of atomic positions and cell parameters upon alloying can directly affect the magnitude of the polarization gradient and the carrier density at the heterojunction.
Zn1-xMgxO/ZnO is one of the more promising heterostructure types for studies of 2DEGs, due to the large polarization of ZnO, the relatively small lattice mismatch, and the large conduction band offsets in the Zn1-xMgxO/ZnO heterointerface. Although 2DEG formation in Zn1-xMgxO/ZnO heterostructures have been researched for some time, a clear understanding of the alloy structure of Zn1-xMgxO is currently lacking. Recently, we have studied composition-dependent changes in the crystal structures of polycrystalline Zn1-xMgxO by synchrotron x-ray diffraction and Raman spectroscopy.Kim1 ; Kim2 For the composition range , we have shown that Mg-substitution modifies the aspect ratio of the hexagonal lattice through enhanced bond ionicity, and in parallel, decreases static polarization in the crystal, due to decreased internal distortion in the tetrahedral coordinations.
Here, we conduct a detailed and more precise study of the local structure of Zn1-xMgxO alloys using Raman and solid-state nuclear magnetic resonance (NMR), in conjunction with neutron diffraction techniques. Raman and NMR spectroscopy are useful probes for addressing the molecular compositions and structures of solid-solution systems. Peak shapes and widths of the Raman spectra reflect compositional fluctuations and both short- and long-range order, whereas NMR is sensitive to the local environments around specific nuclei. Thus, both techniques can provide structural information on Zn1-xMgxO that is complementary to diffraction analyses. Here, we examine the details of and Raman modes for Zn1-xMgxO (, 0.05, 0.10, and 0.15). We have also used spin-echo magic-angle-spinning (MAS) 67Zn and 25Mg NMR to study separately zinc and/or magnesium species in ZnO and Zn0.85Mg0.15O. These measurements have been correlated with average and local crystal structures of Zn1-xMgxO and ZnO, as established by Rietveld (diffraction space) and pair-distribution-function (PDF, real-space) analyses of time-of-flight neutron diffraction data. Compared with x-rays, neutron scattering provides much greater sensitivity to oxygen and Mg positions, as well as larger momentum transfer as measured by the larger maximum wavevector.Proffen By taking advantage of the increased data quality, we are able to isolate the geometry of MgO4 moieties stabilized in the wurtzite ZnO lattice.
II Experimental
Polycrystalline powder samples of ZnO and Zn1-xMgxO ( = 0.05, 0.10, 0.125, and 0.15) were prepared from oxalate precursors obtained by co-precipitation using Zn(CH3CO2)2H2O, Mg(NO3)6H2O, and H2C2O4, all of which had purities of 99.999 % from Aldrich. The two metal salts were dissolved together in deionized water and added to an oxalic acid solution in the ratio of [Zn2+]:[Mg2+]:[C2O] = (1)::1.05. Upon mixing with oxalate, Zn2+ and Mg2+ immediately coprecipitated as white crystalline oxalate powders, which were washed with deionized water and dried at 60∘C for 4 h and subsequently heated at 550∘C for 20 h in air to decompose the oxalates to the oxides. Powder x-ray diffraction measurements confirmed the formation of Zn1-xMgxC2O2H2O after heating at 60∘C, and Zn1-xMgxO after decomposing at 550∘C. For the NMR experiments, samples were also prepared at different conditions of temperature (900∘C) and atmosphere (O2, N2).
Raman spectra for ZnO and Zn1-xMgxO ( 0.05, 0.10, and 0.15) were acquired at room temperature using a Jobin Yvon-Horiba T64000 triple grating (1800 gr/mm) spectrometer. The spectra of lightly compressed powders were recorded using micro-Raman sampling in air with 514.5 nm and 675.5 nm excitations. The spectra reported here were averages of 10 acquisitions of 20 s integrations of the CCD detector with 10 mW of laser power focused onto the samples through a 10 objective. There was no evidence of degradation of the samples or associated changes in their spectra under these conditions. The spectrometer was calibrated using a 520.7 cm-1 lattice mode of silicon. The Raman features of wurtzite and phonon modes were analyzed in detail to determine the peak shape, position, and width. Spectral background was removed following ShirleyShirley , and the profile fitting was performed using pseudo-VoigtCox or Breit-Wigner-Fano functions.Yoshik
NMR measurements of the low-gyromagnetic-ratio nuclei 67Zn and 25Mg were conducted at high (19.6 Tesla) magnetic field strength at the National High Magnetic Field Laboratory in Tallahassee, Florida. These investigations benefited from the enhanced sensitivity and improved resolution for the 67Zn and 25Mg nuclei that results from reduced second-order quadrupolar interactions, which scale inversely with the strength of the high applied magnetic field. The experiments were conducted at room temperature at 19.6 T (1H resonance frequency of 830 MHz), which for 67Zn (, 4.1 % natural abundance, ca. 1.5 receptivity relative to 13C) and 25Mg (, 10.1 % natural abundance, ca. 0.7 receptivity relative to 13C) corresponded to Larmor frequencies of 51.88 MHz and 50.76 MHz, respectively. All of the NMR spectra presented here were recorded on a single-resonance 4-mm probehead under MAS conditions at 10 kHz, using a Hahn-echo (i.e. ----acquisition) with the delays set to one rotor period . The 67Zn and 25Mg shifts were referenced to the bulk external secondary standards ZnSe (274 ppm relative to 1.0 M aq. Zn(NO3)2) and MgO (26 ppm relative to 3.0 M aq. MgSO4)Dupree , respectively. Pulse lengths of 2 s and 4 s were used for the and pulses, respectively. A recycle delay of 1 s was used in each case, using 16,000 transients for the 67Zn MAS spectra (ca. 5 h each), and 160,000 transients for the 25Mg MAS experiments (ca. 46 h each). Second-order quadrupolar MAS lineshapes were fitted using the program DMfit.Massiot
Time-of-flight neutron diffraction data for ZnO and Zn0.875Mg0.125O were obtained on the neutron powder diffractometer NPDF at the Lujan Neutron Scattering Center at Los Alamos National Laboratory. For ease of structural modeling in the PDF analysis of Zn1-xMgxO, we chose a composition of and have used an appropriate 16-atom supercell model of Zn7MgO8. For each sample, 2 g of powder were packed in a vanadium can, and the data were collected for 3 h at 25∘C using four detector banks located at 46∘, 90∘, 119∘, and 148∘. Control runs, for the intensity corrections, employed an empty vanadium can, a vanadium piece, and air. The program PDFgetN was used to extract the PDF from the raw scattering data.Peterson First, the coherent scattering intensity was obtained from raw data by the intensity corrections for container, background, and incident beam. Then, the was converted to the structure factor by the corrections for sample absorption, multiple scattering, and inelasticity. Finally, the PDF was constructed by the Fourier transform of the reduced structure factor . In the Fourier transform of to , data were terminated at 35 Å-1. PDF refinements were performed using the software program PDFgui.Farrow The average crystal structures of ZnO and Zn0.875Mg0.125O were determined by the Rietveld method using the GSAS-EXPGUI software suite.Larson ; Toby
III Results and discussion
III.1 Raman spectroscopy
Room temperature Raman spectra for Zn1-xMgxO (, 0.05, 0.10, and 0.15) are shown in Fig. 1, along with mode assignments for the observed peaks.Calleja ; Damen The wurtzite lattice, with space group (Hermann-Mauguin symbol ), has four Raman-active phonon modes, . The two modes are nonpolar, while the and modes are polarized along the -axis and in the -plane, respectively.Calleja ; Damen ; Zhang The polar modes are further split into longitudinal (LO) and transverse (TO) components due to the macroscopic electric field associated with the LO modes. Raman spectra of the ZnO and Zn1-xMgxO compounds are dominated by two intense peaks of ( 98 cm-1) and ( 436 cm-1) modes. Raman scattering efficiencies of individual modes in ZnO are known to vary with the excitation energy.Calleja With 514.5 nm (2.41 eV) excitation, the highest Raman efficiencies are observed from and modes. However, the polar LO modes exhibit a strong resonance effect as the excitation energy approaches the electronic transition energies. In cases when ultraviolet lasers are used for excitation, the Raman spectra of ZnO or Zn1-xMgxO are dominated by the signals from LO modes.Cheng

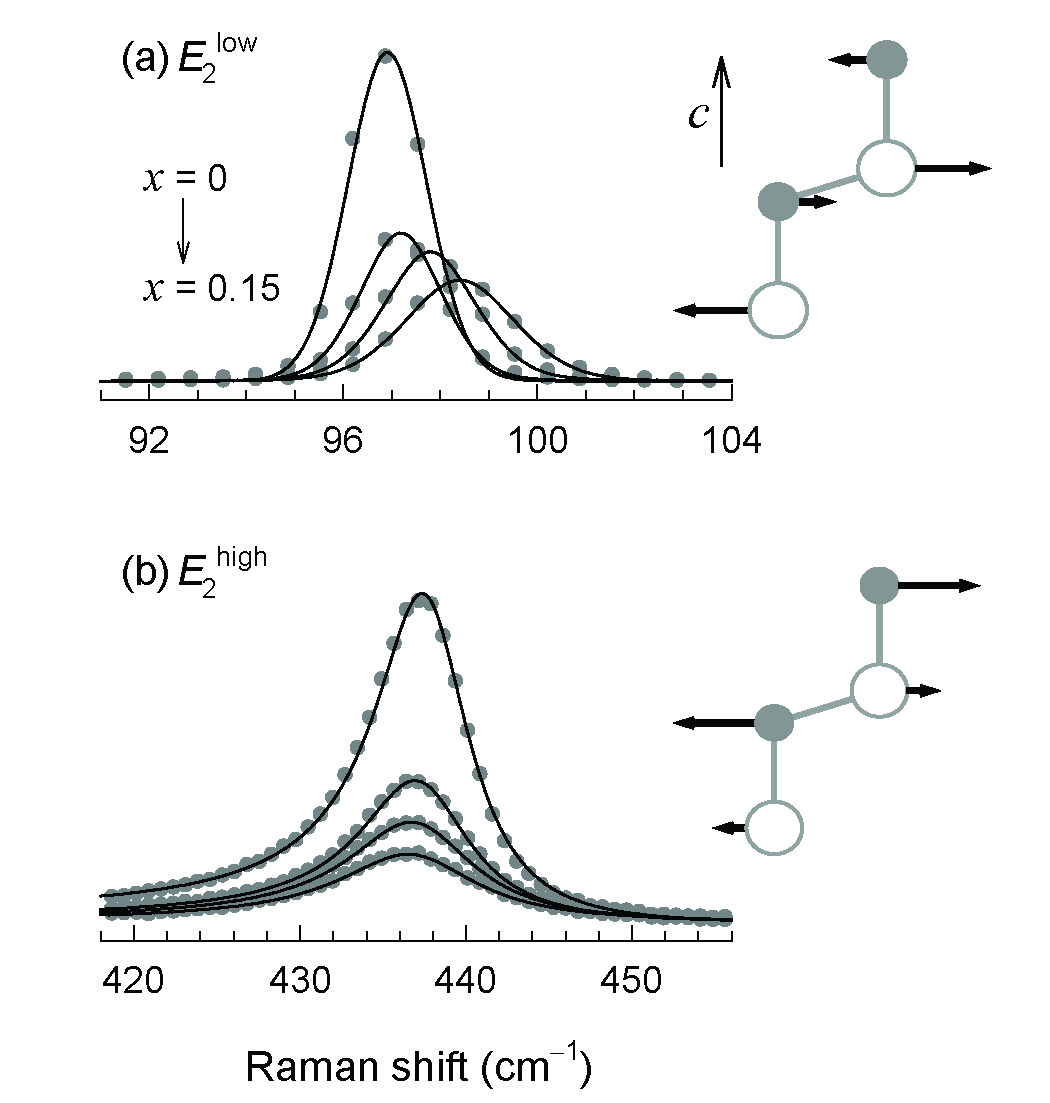
In order to quantify composition-dependent changes in the Raman spectra of Zn1-xMgxO, the and line profiles were analyzed by least-squares fitting with standard peak functions. From the fits, peak position () and the full-width-at-half-maximum (FWHM, ) linewidths were determined. The profile fittings of both modes are shown in Fig. 2, and the evolution of peak parameters and with Mg-substitution are plotted in Fig. 3. Consistent with the previous study,Kim2 the peaks of Zn1-xMgxO are best represented by Lorentzian Breit-Wigner-Fano (BWF) lineshapes with some asymmetry. However, the line profiles do not fit as well to the Lorentzian-type functions. Instead, the lines of Zn1-xMgxO are found to be pseudo-Voigt-type with predominantly Gaussian components of 97%, 83%, 77%, and 81 % for = 0, 0.05, 0.10, and 0.15, respectively.
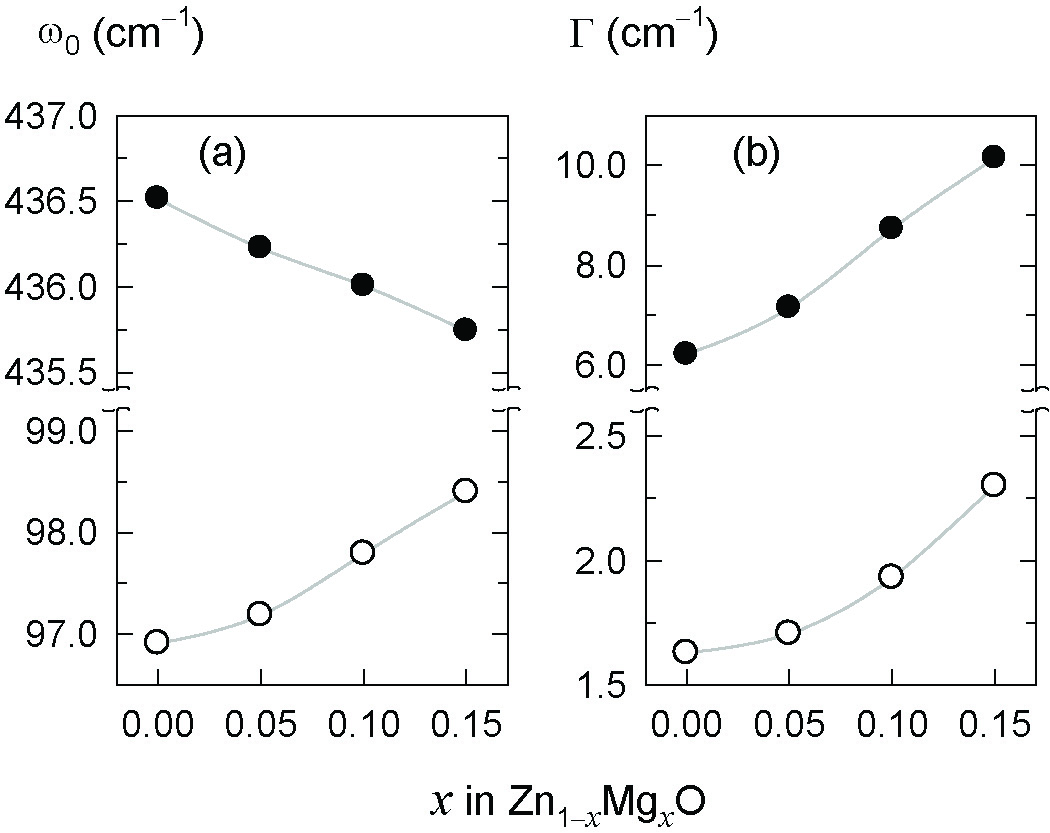
As shown in Fig. 3a, the two modes of Zn1-xMgxO exhibit distinct dependences of phonon energy on the composition. With increased concentration of magnesium, the mode shows a blueshift, while the mode exhibits a redshift. For explaining these opposing trends, the vibrational eigenvectors of the wurtzite modes need to be considered. As shown in Fig. 2, both and modes are associated with atomic motions in the -plane. The lower energy branch corresponds mainly (85 %) to the vibrations of heavier components (cations, in case of Zn1-xMgxO), and conversely the higher energy one corresponds mainly to those of lighter components (oxygen). Consequently, the mode energy of Zn1-xMgxO is explicitly affected by the cationic substitution, according to the reduced mass effect. Replacement of Zn with Mg will decrease the reduced mass of the oscillator and in turn increase the phonon energy. By comparison, the change of cation mass should have less influence on the mode energy, and its redshift is adequately attributed to the phonon softening caused by the in-plane lattice expansion. As previously reported, the lattice constant of Zn1-xMgxO increases monotonically with ,Kim1 which appears to account for the observed mode behavior.
Peak shapes and linewidths of Raman spectra are dictated by the underlying line-broadening mechanisms. Gaussian line broadening is intrinsic to Raman spectra and originates from instrumental resolution. Also, if the sample being examined contains inhomogeneous components with different phonon frequencies, the resulting Raman lineshape would have a Gaussian character, reflecting the statistical nature of the spectrum. On the other hand, Lorentzian line broadening is mostly attributed to finite phonon lifetimes (), according to the energy-time uncertainty relationship . The phonon lifetime shortening, which will cause linewidth broadening, can occur via two independent phonon decay mechanisms; by anharmonic decay into other Brillouin zone phonons or by phonon disruption at crystal defects. The latter, involving lattice imperfections, are quite common for alloy and solid-solution systems. Specifically for Zn1-xMgxO, it is expected that Mg-substitution will substantially reduce the size of ordered domains, and thereby block the long-range propagation of zone center phonons.
As noted above, the and lines of ZnO are respectively fitted with Gaussian and Lorentzian functions. It indicates that the mode of ZnO has anharmonic phonon decay channels, whereas the phonon does not. The Lorentzian line broadening behavior of mode, in Fig. 3b, further manifests that the Mg-substitution increasingly populates the phonon field of Zn1-xMgxO with defect centers. The mode also undergoes a gradual line broadening with , and its peak shape changes upon Mg-substitution. While unsubstituted ZnO displays a nearly pure Gaussian peak for the mode, the peaks from Zn1-xMgxO () samples are found to contain 20 % of Lorentzian components. Therefore we conclude that, for the Zn1-xMgxO system, the same line broadening mechanism applies to both and modes: phonon lifetime shortening by increased crystal defects upon Mg substitution.
III.2 Solid-state 67Zn and 25Mg NMR spectroscopy
A different view of the disorder induced by Mg-substitution in ZnO materials can be obtained from solid-state NMR, using the NMR-active isotopes 25Mg (spin ) and 67Zn (). These nuclei are challenging to observe, because their low natural abundances and low gyromagnetic ratios (see Experimental) yield low signal sensitivities, and because second-order quadrupolar interactions associated with nuclear spins || can lead to a dramatic broadening of their NMR spectra. Second-order quadrupolar effects, however, scale with the inverse of the static magnetic field , and are therefore mitigated at high magnetic fields, which also increase signal sensitivity.
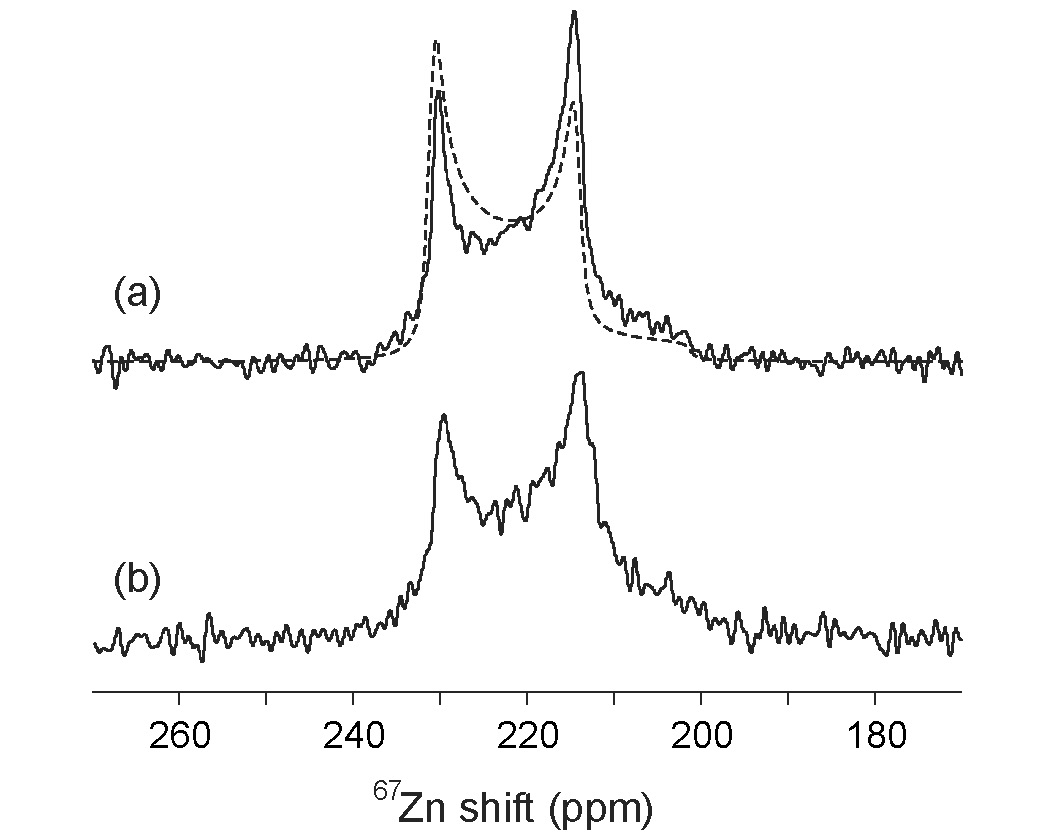
Solid-state 67Zn MAS NMR spectra acquired at 19.6 T of ZnO and Zn0.85Mg0.15O are shown in Fig. 4. The materials were prepared by heating at 900∘C in N2 and yield similar spectra that clearly exhibit scaled second-order quadrupolar powder MAS lineshape features.Kundla Associated values for the isotropic 67Zn chemical shift, , the quadrupolar coupling constant, , and the asymmetry parameter, , can be determined by fitting each resolved second-order quadrupolar MAS lineshape. A simulated powder pattern is shown as the dashed line in Fig. 4a accompanying the 67Zn MAS spectrum of ZnO and corresponding to the calculated values = 236 ppm, = 378 kHz, and = 0.1. Several discrepancies between the calculated and experimental powder patterns may be due to modest anisotropy of the powder particles and/or to uneven excitation of the different crystallite orientations by the radiofrequency pulses. The powder pattern and fit parameters are nevertheless consistent with a single crystallographically distinct and relatively symmetric 67Zn site in the wurtzite ZnO structure. The 67Zn MAS spectrum of Zn0.85Mg0.15O in Fig. 4b exhibits a similar lineshape and features, which are broadened by the presumably random incorporation of Mg atoms within the Zn-rich wurtzite lattice.
The close similarity between the 67Zn MAS NMR spectra of ZnO (Fig. 4a) and Zn0.85Mg0.15O (Fig. 4b) indicates that the substitution of 15 % of Zn atoms by Mg has little influence on the local electronic environments of a majority of the 67Zn nuclei. Assuming that Mg atoms are distributed randomly, the probability of having no Mg atom in the second coordination sphere of a given 67Zn nucleus is only 14 % (the first coordination sphere consisting of four O atoms). Significant effects on the 67Zn spectrum would be expected if the quadrupolar interactions were substantially perturbed by the substitution of Mg atoms for 1, 2, 3, 4 (probabilities of 30 %, 29 %, 17 %, and 7 %, respectively) or more of the 12 Zn atoms in the second coordination sphere. However, despite the high probability of modifications of the local chemical environment of the 67Zn nuclei upon 15 % Mg-substitution, dramatic changes of the 67Zn spectrum are not observed, rather only modest broadening that reflects increased disorder. Under these conditions, the differences induced in ZnO or Zn0.85Mg0.15O by changing the synthesis atmosphere (e.g., air, O2, or N2) and temperature (over the range 550∘C to 900∘C) were too subtle to be clearly reflected in the corresponding 67Zn MAS NMR spectra (data not shown), which are similar to those in Fig. 4a, b. Thus, it appears that 67Zn NMR measurements of these ZnO-related materials are sensitive principally to substitutions that result in modifications of the first coordination sphere of the zinc nuclei (substitution of the anionic species), or to substitutions resulting in larger lattice distortions or increased electronic disorder than observed here.Toberer
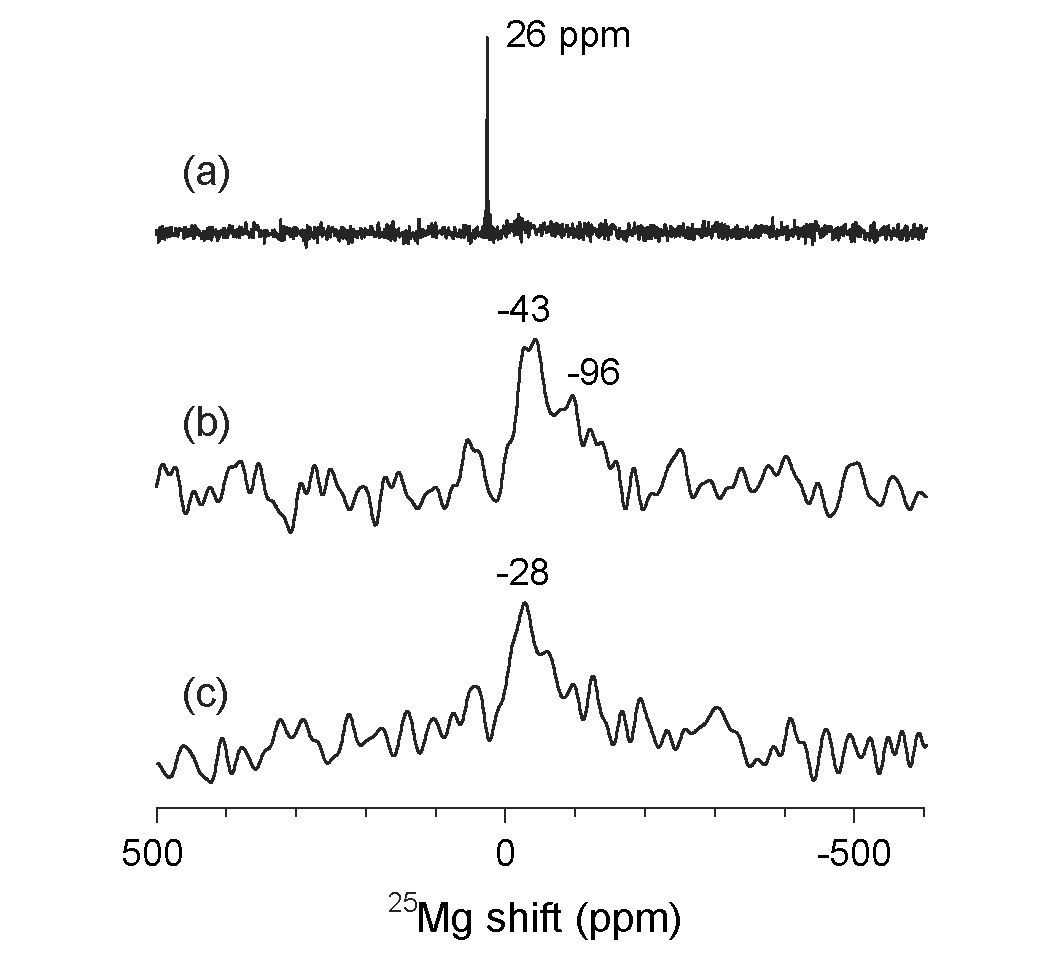
Solid-state 25Mg MAS NMR measurements complement the 67Zn NMR results by being sensitive to the structural and electronic perturbations experienced directly by Mg atom incorporated into ZnO lattices. The 25Mg MAS NMR measurements were similarly conducted at 19.6 T and the resulting spectra are shown in Fig. 5 for polycrystalline MgO and different Zn0.85Mg0.15O powders prepared at 550∘C in air and at 900∘C in N2. The 25Mg MAS spectrum in Fig. 5a of MgO shows a narrow well-defined 25Mg peak that reflects the highly symmetric coordination environment of the single type of Mg site in its rock-salt structure.MacKenzie1 By comparison, the 25Mg MAS spectra of the different Zn0.85Mg0.15O powders contain broad and relatively unstructured lineshapes centered at ca. 30 ppm to 40 ppm that reflect broad distributions of signal intensity and thus broad distributions of local 25Mg environments. The first Mg coordination sphere (MgO4) in Zn0.85Mg0.15O is expected to be significantly distorted from its regular tetrahedral geometry, and the second coordination sphere, composed of Mg(Zn,Mg)12, is expected to have an even larger number of different local configurations, bond distances, and/or bond angles. The 25Mg MAS NMR spectra appear to be more sensitive than the 67Zn NMR results to local material environments in Zn0.85Mg0.15O. However, the low signal-to-noise and broad lines observed for natural abundance 25Mg in Zn0.85Mg0.15O, even at 19.6 T, preclude a detailed and reliable analysis of the isotropic shift distributions and second-order quadrupolar broadening that would be necessary to extract directly quantitative information on nature of the Mg site distributions and/or their disorder. It is noteworthy that the Zn0.85Mg0.15O powders do not display any spectral feature corresponding to bulk MgO, thereby ensuring the phase purity of Zn1-xMgxO () solid solutions, within the sensitivity limit of the 25Mg NMR measurements.MacKenzie2
In common for 29Si, 27Al, and 25Mg, an increase of the coordination number for a given cationic center counts for enhanced local shielding, resulting in an upfield displacement of the signal(s) to lower shift values.Dupree ; Magi The spinel MgAl2O4 containing MgO4 fragments exhibits a 25Mg shift of 52 ppm, compared to 26 ppm for MgO which is comprised of MgO6 local units.Dupree By comparison, clay minerals in which Mg atoms are coordinated by six (O,OH) ligands yield 25Mg shifts in the range of 0 to 100 ppm.MacKenzie1 The wurtzite oxide Zn0.85Mg0.15O has a 4-coordinated geometry of Mg, similar to MgAl2O4, but the former clearly shows a more upfield-shifted 25Mg resonance at 40 ppm. We infer that 25Mg MAS NMR signals are considerably influenced by the ligand identity beyond the first coordination shell, and that Zn has a far stronger shielding contribution than Al, Si, or alkaline-earths, thus accounting for the observed resonance values.
III.3 Neutron diffraction
In previous studies, the crystal structure of ZnO has been reported [space group , Zn at and O at ] with lattice constants of 3.24273.2501 Å and 5.19485.2071 Å, and atomic position parameter 0.3810.3826.Sawada ; Sabine ; Abrahams ; Harrison ; Albertsson ; Kisi In our previous synchrotron x-ray study on polycrystalline ZnO, we obtained 3.2503 Å, 5.2072 Å, and 0.3829.Kim1 Here, we reexamine the crystal structures of polycrystalline ZnO and Zn0.875Mg0.125O utilizing neutron scattering, which has several advantages over x-rays. The coherent neutron scattering length of O (5.804 fm) is comparable to those of Zn (5.680 fm) and Mg (5.375 fm),Sears as distinct from x-ray diffraction, where scattering is strongly weighted by Zn. Moreover, neutron scattering can provide high diffraction data with much less attenuation than x-rays, due to there being no fall-off with in the form factor.
| ZnO | Zn0.875Mg0.125O | |
|---|---|---|
| (Å3) | 47.603(1) | 47.578(1) |
| (Å) | 3.24945(1) | 3.25058(2) |
| (Å) | 5.20574(3) | 5.19771(3) |
| 1.60204 | 1.59940 | |
| 0.38275(5) | 0.38214(6) | |
| (Zn/Mg) (Å2) | 0.00648(8) | 0.0065(2) |
| (O) (Å2) | 0.0101(1) | 0.0087(2) |
| (Å) | (1) 1.9925(3) | (1) 1.9868(3) |
| (3) 1.9729(1) | (3) 1.9743(1) | |
| (∘) | 108.022(7) | 108.081(9) |
| 110.881(7) | 110.825(9) |
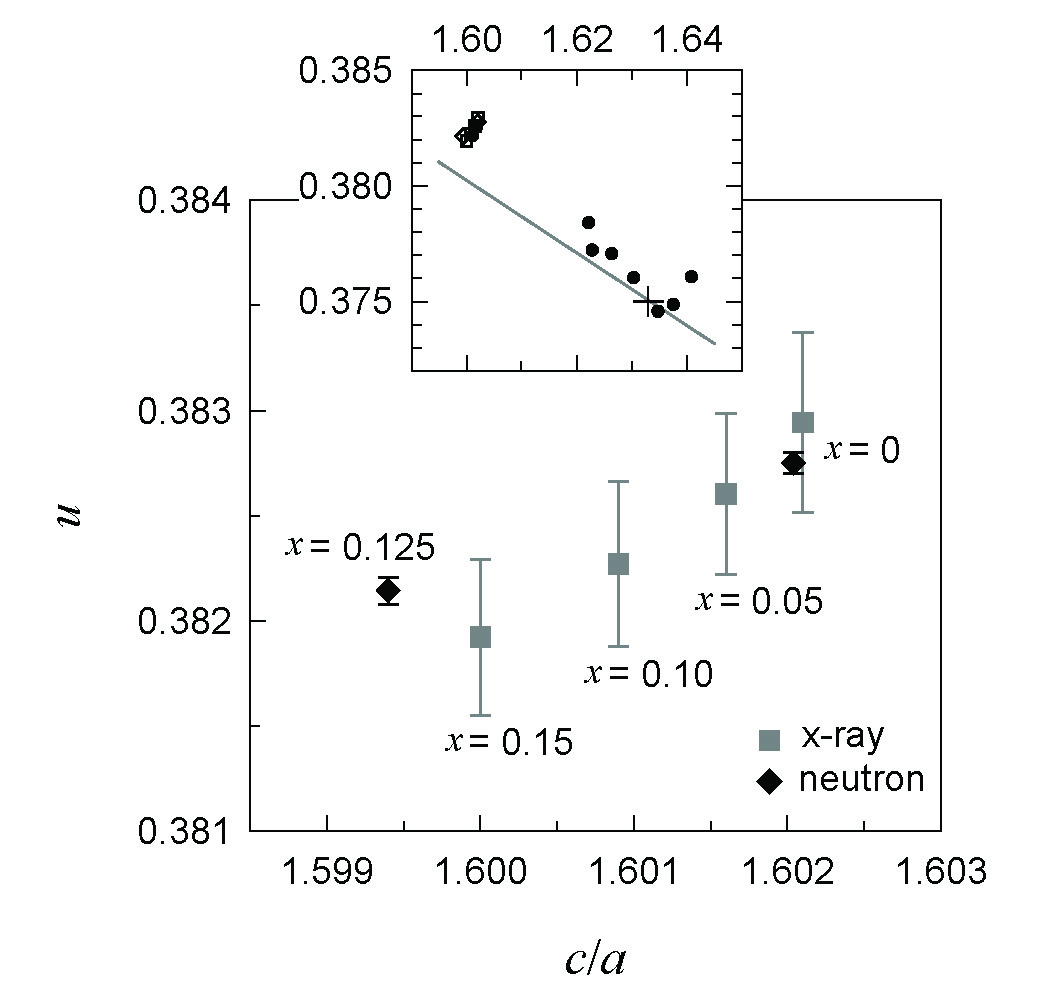
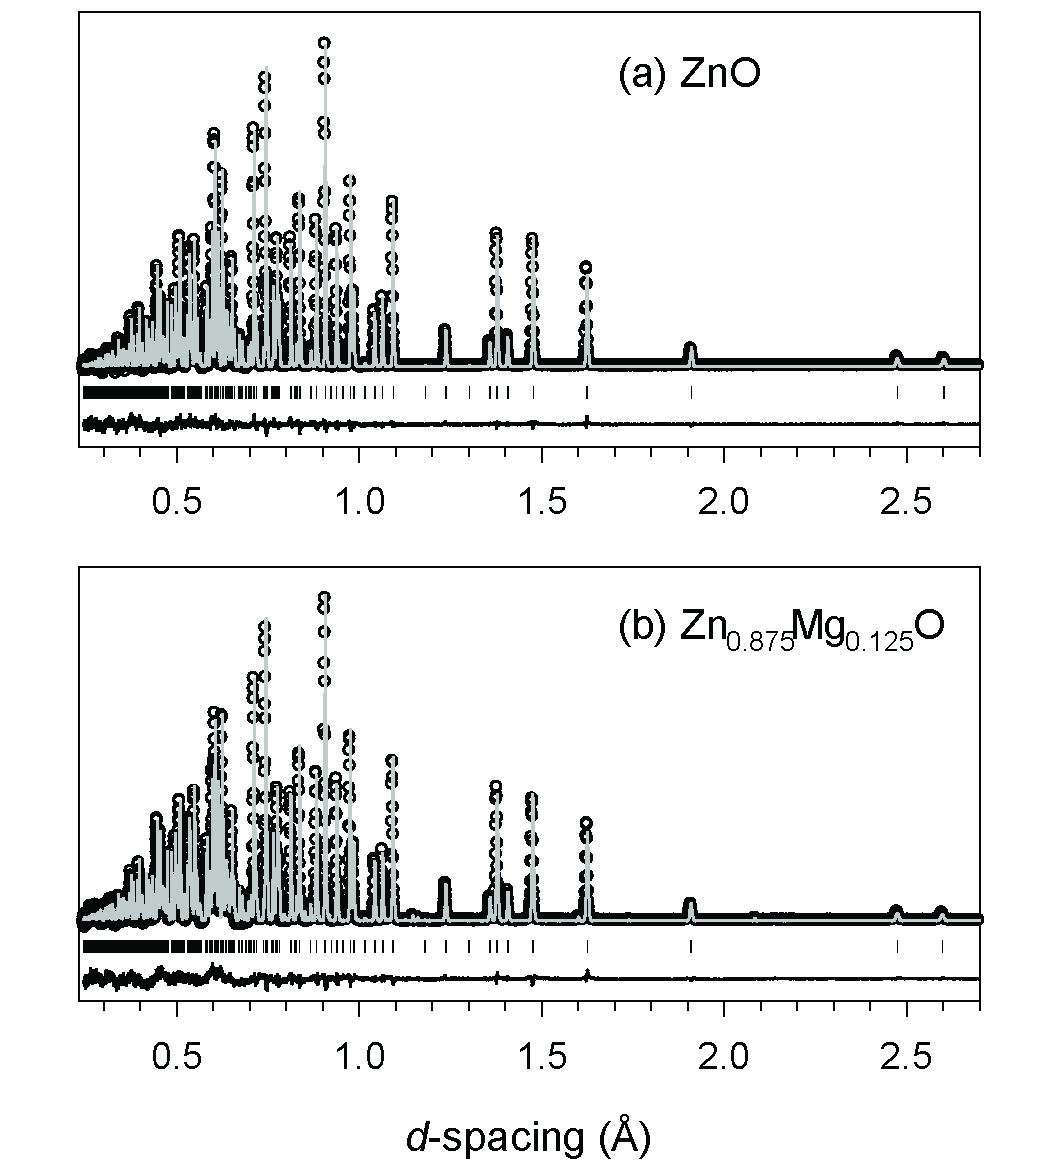
Rietveld refinements of ZnO and Zn0.875Mg0.125O were carried out on four histograms of data collected at detector locations of 46∘, 90∘, 119∘, and 148∘. The highest- data from the 148∘ detector covers the range of (). The model used for the refinement in space group has Zn/Mg at the Wyckoff position () and O also at 2 position (). For Zn0.875Mg0.125O, Zn and Mg were statistically distributed over the common site with fractional occupancies fixed to the respective compositions. The refinement converged with reliability factors of , and for ZnO, and , and for Zn0.875Mg0.125O. The Rietveld refinement profiles and the structural parameters are given in Fig. 6 and Table 1, respectively. The present refinement results agree well with the findings from our previous synchrotron x-ray study.Kim1 Both studies indicate that Mg-substitution expands the -parameter, compresses the -parameter, and decreases the oxygen position parameter , as summed up in Fig. 7. The two data sets from x-ray and neutron reveal an identical trend in the structural evolution in terms of , , and .
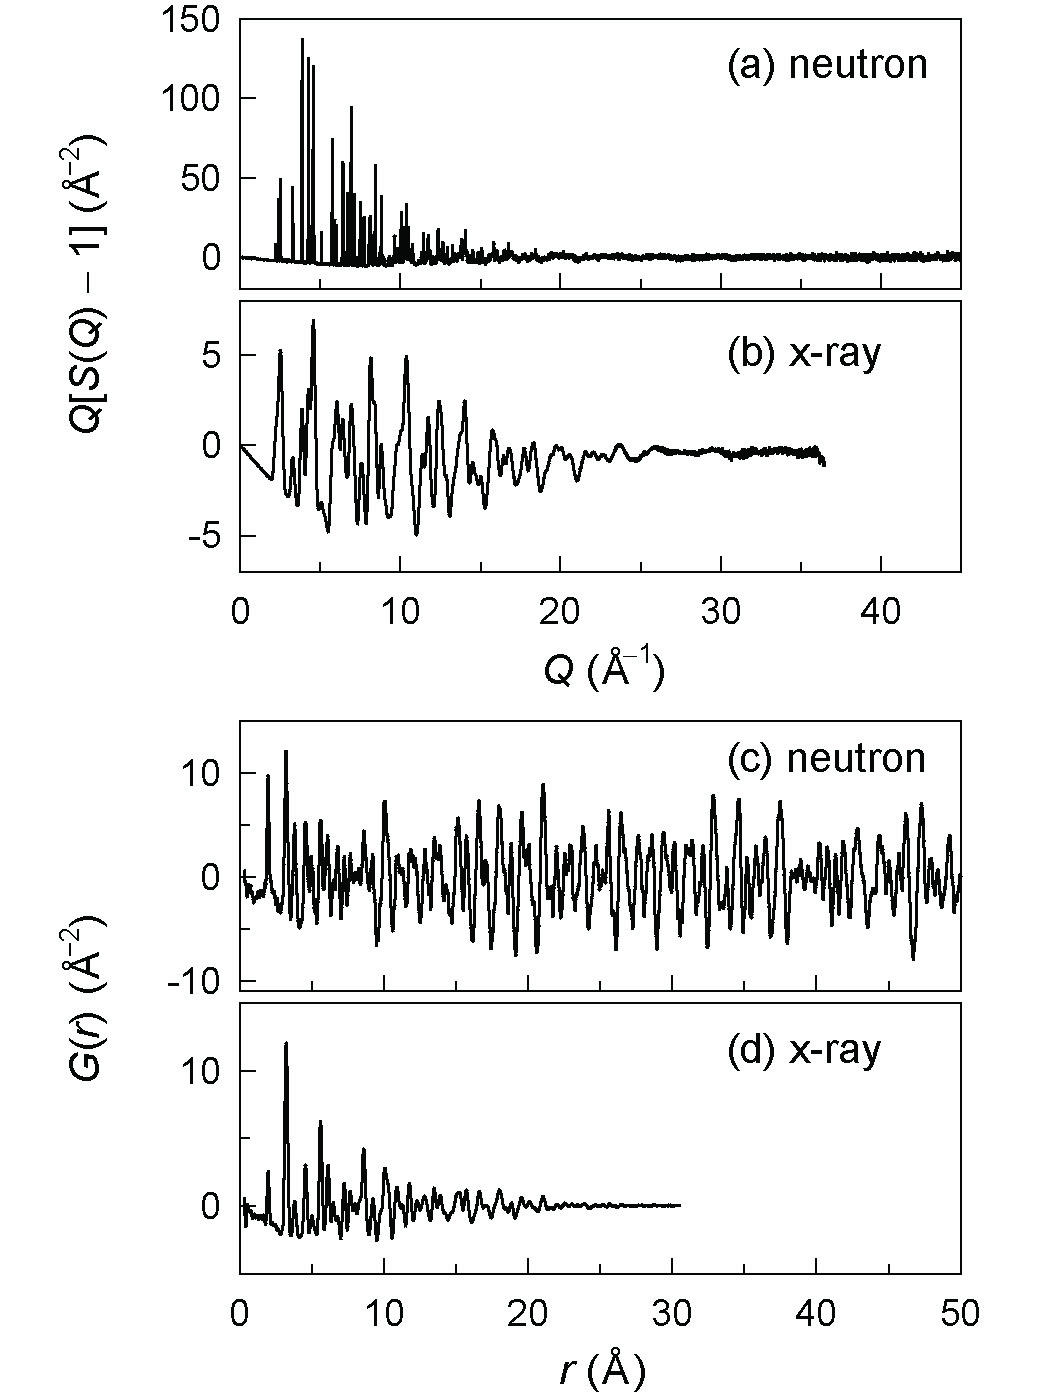
For the composition range up to , the Zn1-xMgxO solid solutions remain isostructural with wurtzite ZnO, with both Zn and Mg tetrahedrally coordinated by O atoms. However, since the two cations Zn and Mg have clearly distinct crystal chemistries in oxidic environments, it is conjectured that they may have distinct local geometries within Zn1-xMgxO lattices. In order to directly address this question, we have carried out neutron PDF analyses of Zn0.875Mg0.125O and ZnO. Figure 8 shows the PDF data for ZnO, comparing the present neutron data with the x-ray data previously measured at Beamline 11-ID-B of the Advanced Photon Source at Argonne National Laboratory. As can be seen from Figs. 8a and 8b, the neutron study provides scattering information over a significantly higher range and also with higher resolution. Correspondingly, the neutron PDF can be obtained for far wider -ranges than when using x-rays (Fig. 8c). Given this, neutrons are expected to enable better description of the Zn1-xMgxO alloy structure(s).
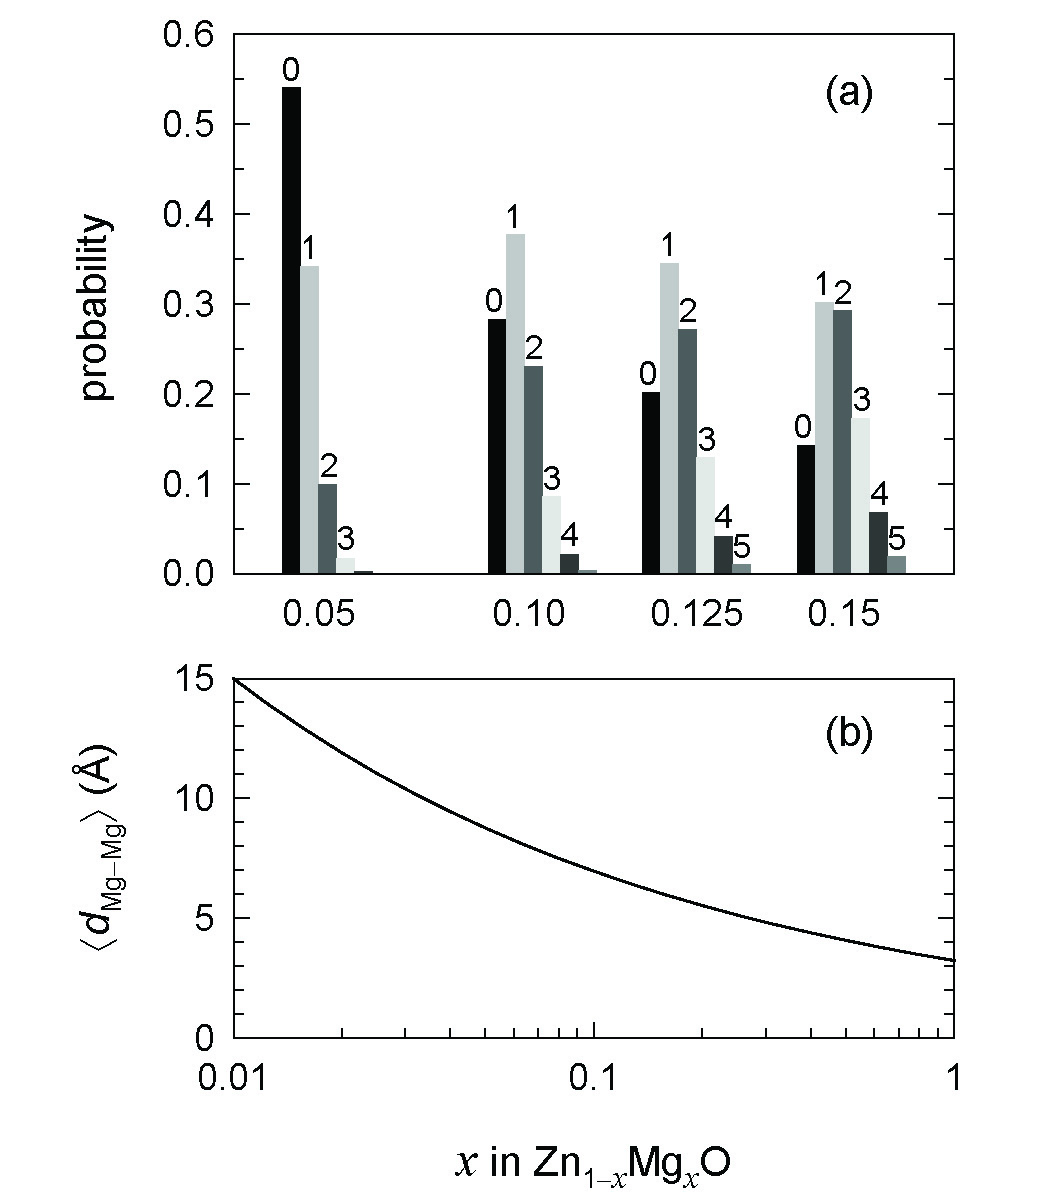
In order to obtain an appropriate real-space model for the PDF analysis of Zn0.875Mg0.125O, we estimate as follows, the impact of Mg-substitution on the chemical environment within the ZnO lattice. Cations in the wurtzite lattice form a hexagonal close-packed sublattice, where each cation has 12 nearest neighbors. At the Mg-substitution level of 0.125, it is estimated that 80 % of the cations have at least one Mg neighbor in the cation sublattice (Fig. 9). Each cation (whether Zn or Mg) has as neighbors, 1.5 Mg atoms on average, and the mean MgMg distance is as short as 6.5 Å. Therefore the coordination geometry of MgO4 will serve a substantial structural factor in the PDF of Zn0.875Mg0.125O and needs to be treated with independent parameters in the PDF refinement.
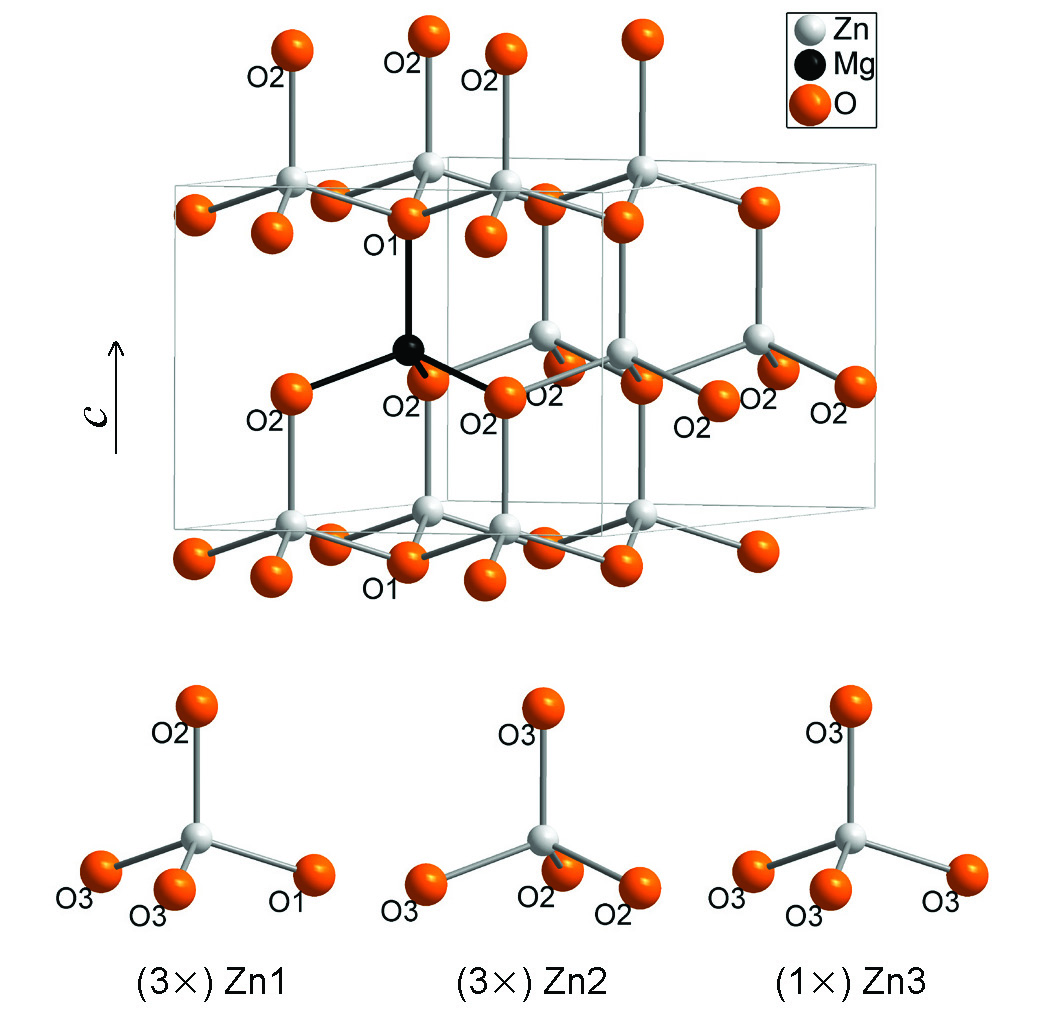
On the basis of the above considerations, the structural model for Zn0.875Mg0.125O was designed as follows. To distinguish the Mg and Zn atoms in the unit cell, while maintaining the composition, a 2 2 1 supercell of the primitive wurtzite structure was selected, with the cell parameters 6.5 Å, 5.205 Å, 90∘, 120∘, and the unit content Zn7MgO8. In the average structure scheme, in which the atomic positions are set as () for cations and () for anions, the external and internal geometries of all the tetrahedra are uniformly defined by the ratio and , respectively. However in the supercell model, we allowed the MgO4 unit to have its own coordination geometry, irrespective of the ZnO4 geometry. As a result, the eight O atoms in the supercell unit are divided into three groups; one O atom bonded to Mg along the -axis (O1), three O atoms bonded to Mg laterally (O2), and the remaining four O atoms (O3). The seven Zn atoms are also grouped according to their proximities to the Mg atom; three Zn atoms having an apical O2 oxygen atom (Zn1), three Zn atoms bonded to O2 atoms laterally (Zn2), and one Zn bonded to only O3 atoms (Zn3). Figure 10 illustrates the supercell configuration and the three different types of ZnO4 geometries.
The PDF of ZnO was analyzed using a simple wurtzite cell (Zn2O2) obeying the symmetry requirements of the space group. However, for the supercell refinement of Zn0.875Mg0.125O, several symmetry constraints were lifted from the average structure description. The -coordinates of the O1, O2, and O3 types of oxygen atoms were independently varied, and the -coordinate of Mg was also refined. We also attempted in-plane displacements of the O2 atoms, but found that these were unstable in the refinement. Therefore, the refinement for Zn0.875Mg0.125O included three more position parameters than those for ZnO. For both ZnO and Zn0.875Mg0.125O, the refinements of used the variables of lattice constants, atomic position parameters, isotropic temperature factors, structure scale factor, and peak sharpening coefficients.
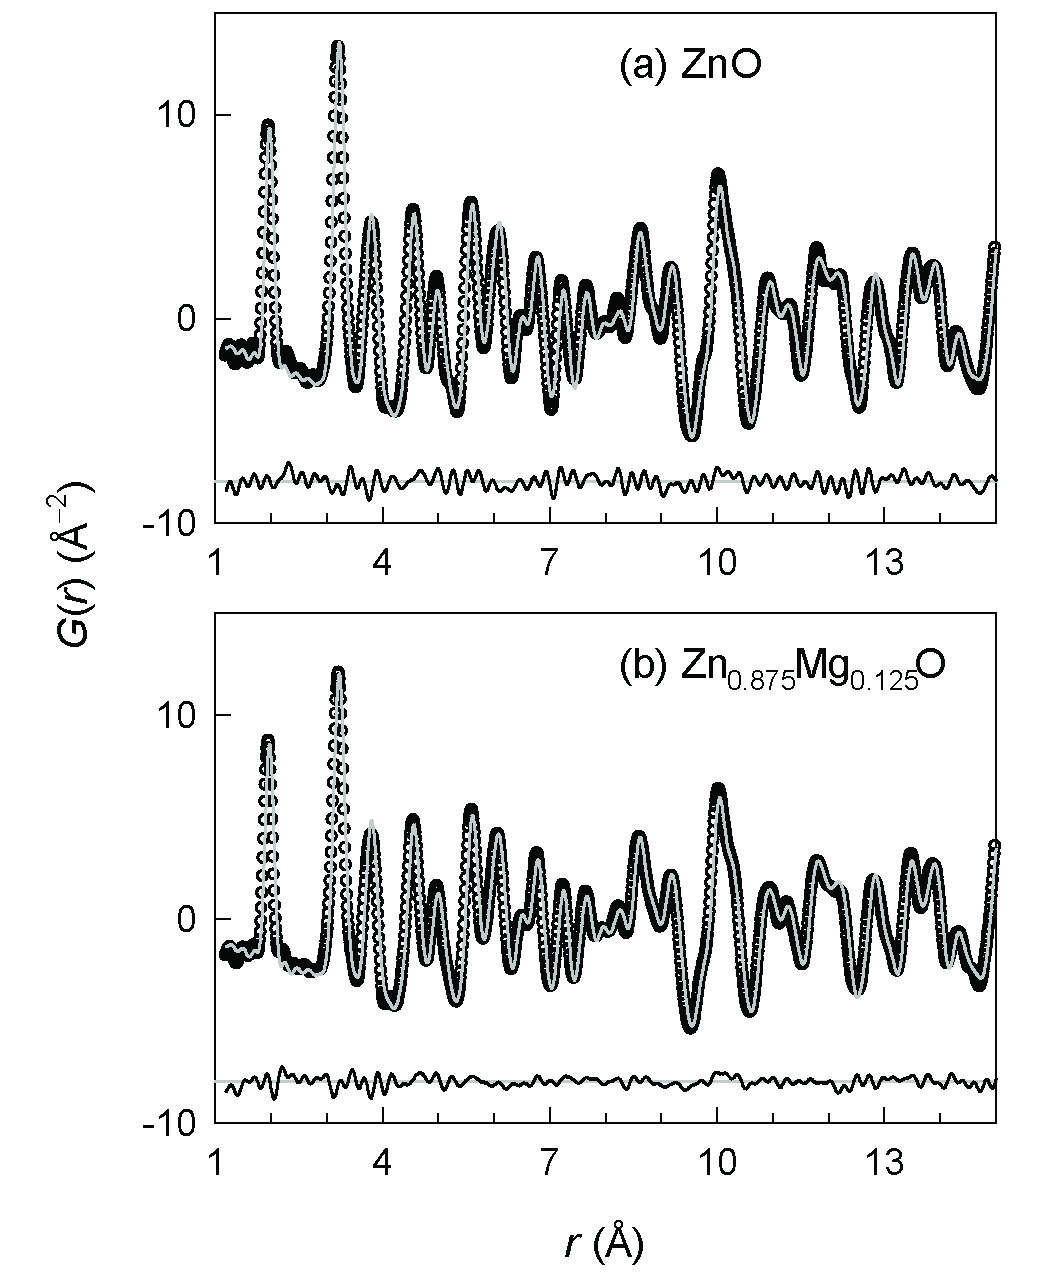
Figure 11 shows the neutron PDF refinements for ZnO and Zn0.875Mg0.125O, carried out in the range of 1.2 Å to 22 Å. The refinement parameters are summarized in Table 2. For both structures, the refinements were achieved with satisfactorily low ’s of 7.9 % (ZnO) and 8.3 % (Zn0.875Mg0.125O). In comparison with the Rietveld results, the PDF-refined lattice constants are systematically larger by 0.06 %, but good agreements are observed for the ratios. Also, the oxygen atom position in ZnO is reasonably well reproduced from the PDF and Rietveld refinements. An interesting finding emerges from the atomic coordinates of Mg and its adjacent oxygen atoms (O1 and O2) in Zn0.875Mg0.125O. As found in Table 2, the three groups of O atoms have clearly distinct -coordinates from one another. Both the O1 and O2 groups are vertically shifted towards their respective Mg atoms. Mg itself also moves towards the basal plane formed of O2 atoms. The resulting MgO4 unit has a squashed tetrahedral geometry (point group ), with a much shorter height than those of ZnO4 tetrahedra. However the O3 atoms, which are not directly bonded to Mg, have similar -coordinates to those found in ZnO. Therefore, the (Zn3)(O3)4 tetrahedra retain the unperturbed geometry of ZnO. The other types of ZnO4 tetrahedra share corners with MgO4 and are likely to undergo intermediate distortion.
| ZnO | Zn0.875Mg0.125O | |
|---|---|---|
| (Å) | 3.2514(3) | 3.2527(4) 2 |
| (Å) | 5.2089(6) | 5.2015(8) |
| 1.6020 | 1.5991 | |
| (O) | 0.3824(4)/0.8824(4) | 0.3825(8)/0.8825(8) (O3) |
| 0.386(3) (O2) | ||
| 0.858(5) (O1) | ||
| (Mg) | 0.486(8) | |
| (Zn/Mg) (Å2) | 0.0086(8) | 0.0063(6) |
| (O) (Å2) | 0.0070(6) | 0.0081(8) |
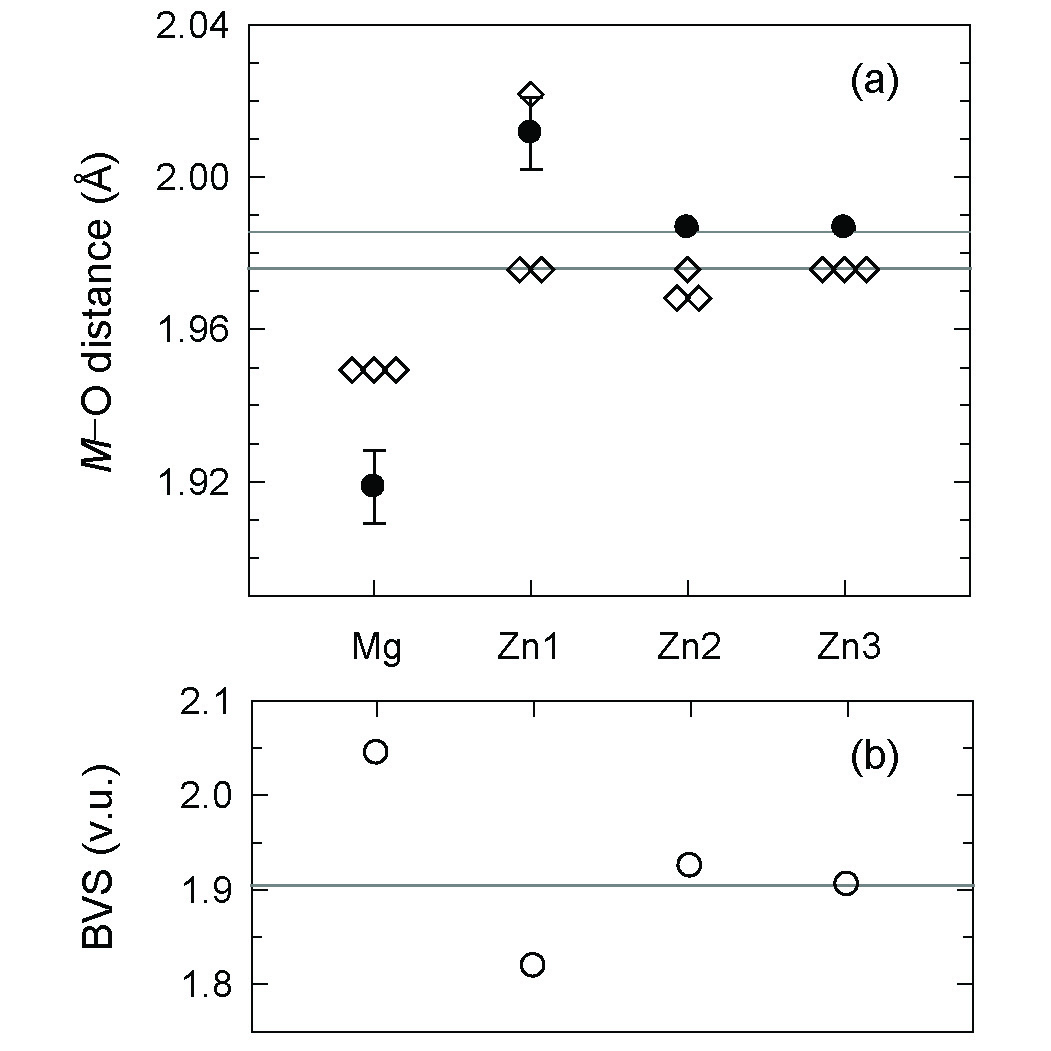
To examine the presence of short-range structural characteristics, the PDF refinements were carried out from 1.2 Å to different values of between 1030 Å. The lattice constants and position parameters showed insignificant variations with , and the values had shallow minima at for both ZnO and Zn0.875Mg0.125O. The MgO and ZnO bond distances plotted in Fig. 12 represent the averaged results of multiple refinements over 1.2 (Å), where was increased from 10 to 30 Å in 2 Å steps. From Fig. 12a, we find a meaningful distinction between the MgO4 and ZnO4 bonding structures. The MgO bonds are shorter than the ZnO bonds, and the former set consists of one short and three longer bonds, in contrast to the latter. These results are consistent with the greater sensitivity of the 25Mg NMR spectra (Fig. 5b, c) to Mg substitution into ZnO-rich lattices, compared to the 67Zn NMR results (Fig. 4). For Mg and the three Zn atom types in Zn0.875Mg0.125O, bond valence sums (BVS)Brown1 are evaluated, as shown in Fig. 12b. The valence sums for all of the cation and anion sites in Zn0.875Mg0.125O are within a reasonable range around the ideal magnitude of 2 valence units (v.u.). The relatively underbonded situation for Zn1 atoms and the slight overbonding of the Mg atom are the results of a rather drastic shift of the bridging O1 atom. The global instability index (GII)Brown1 of Zn0.875Mg0.125O is calculated as 0.116 v.u., which is significantly larger than that of ZnO (0.067 v.u.). The GII value is often used as a measure of the residual bond strain, and is known not to exceed 0.2 v.u. for ordinary structures in the standard state.Brown1 ; Brown2 It is worth mentioning, in light of the above GII considerations, that the increased microstrain upon Mg-substitution results in characteristic optical and x-ray line broadening behavior of Zn1-xMgxO that we have previously reported.Kim3 ; Kim4
The solid solution of Zn1-xMgxO has the thermodynamic solubility limit of 15 % on the ZnO-rich side. Obviously the distinct coordination preferences of Mg and Zn prevent the formation of a continuous solid solution across the entire composition range, . While Mg has a point symmetry of in its binary oxide MgO, wurtzite ZnO possesses only a environment. Here, we rationalize the neutron PDF result for the MgO4 tetrahedral geometry, in several ways. Both bond valenceBrese and ionic radiiShannon compilations are useful to explain the smaller tetrahedral volume of MgO4, as compared with ZnO4. The bond valence parameter of MgO () is smaller than that of ZnO (), implying that in general MgO bonds are shorter than ZnO bonds, for the same coordination numbers. Similarly, the 4-coordinate ionic radius of Mg2+ (0.57 Å) is smaller than that of Zn2+ (0.60 Å). In order for the MgO4 tetrahedron to have a smaller volume than ZnO4, either the tetrahedral height or the base area should shrink, or an isotropic volume change could occur. From the PDF analysis, the parameter around Mg showed a clear decrease, whereas the parameter appears to be nearly unchanged. The -axial parameter contraction of MgO4 unit can be deduced also from the composition-dependent changes of the average structure of Zn1-xMgxO.
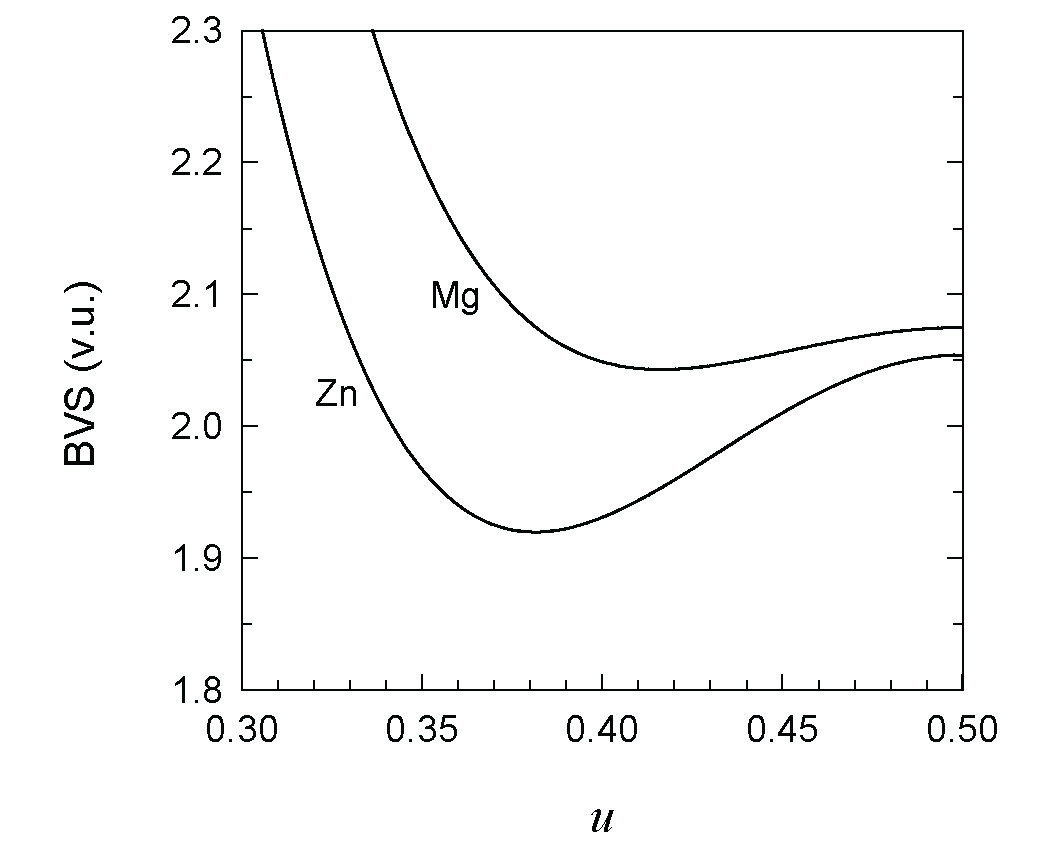
The variable is the only position parameter in the wurtzite structure. It corresponds to the ratio of the apical bond distance to the length, , or , where is the height of the tetrahedron. For Zn0.875Mg0.125O, (Mg) is determined to be 0.395, a value that finds no correspondence to the experimental structures of pure wurtzites. Existing wurtzites have values within the range of 0.374 to 0.383. Such a high found for MgO4 is closely linked with its extremely small aspect ratio (, as compared to the ideal value 1.633). To compare the potential fields within the tetrahedral spaces of MgO4 and ZnO4, the valence sums of Mg and Zn were calculated as functions of (Fig. 13). In ZnO, the tetrahedral cavity is slightly oversized for Zn, and the BVS(Zn) has a minimum of 1.9 v.u. at 0.382. The potential minimum suggested by BVS(Zn) is in a good agreement with the experimental for ZnO. However, the MgO4 shell in Zn1-xMgxO is rather small for Mg, resulting in a global overbonding situation. The BVS(Mg) is minimized at a markedly higher range than for BVS(Zn), making it clear why the experimental (Mg) is conspicuously larger than (Zn).
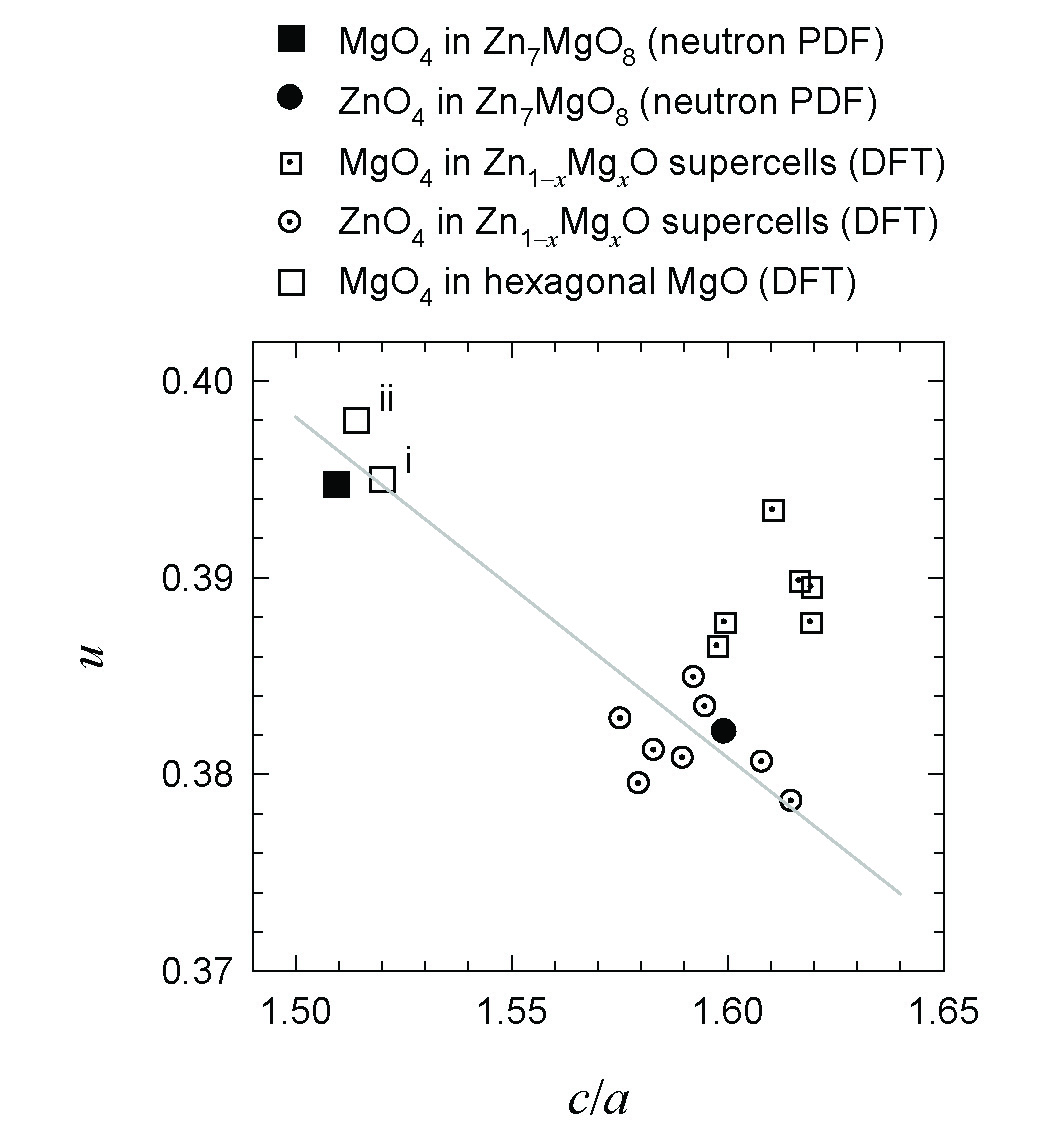
Several authors have used first-principles density functional theory (DFT) to predict the relaxed structure of hypothetical wurtzite MgO.Limp ; Gopal ; Janotti An earlier DFT study attempted to relax the energy-minimized wurtzite MgO structure, but only to obtain a hexagonal structure corresponding to the limit of -axis compression (, ).Limp However in later studies, the energy minimizations for wurtzite MgO were achieved within appropriate boundary conditions; , by Janotti Janotti , and , by Gopal and SpaldinGopal . Therefore, wurtzite MgO, if it ever occurs, is expected to have an abnormally small ratio and large value, compared with common wurtzites including ZnO. Interestingly, the above computational approximations of the hexagonal MgO structure agree well with our PDF analyses of Zn1-xMgxO, which underscores that the MgO4 fragment has smaller and larger than ZnO4. Malashevich and VanderbiltMala1 and Fan Fan performed DFT computations of Zn1-xMgxO supercell models, also deriving consistent conclusions that decreases with Mg-substitution, and that (Mg) (Zn). The results from the neutron PDF refinement and the above DFT computations are plotted together in Fig. 14, in which the distinct internal/external geometries of MgO4 and ZnO4 are contrasted. As a general trend, isolated MgO4 tetrahedra always have larger parameters than ZnO4 units. The extremely good agreement between the local coordination of Mg in Zn0.875Mg0.125O determined here from PDF studies and DFT calculations on end-member wurtzite MgO is remarkable. This is in part attributed to our use of the ratio as a comparison parameter. This ratio has fewer systematic errors than do the values of the lattice parameters taken separately.
The total polarization of polar oxides can be broken down into electronic, ionic, and piezoelectric contributions, related respectively to the polarizability of component ions, ionic arrangements, and lattice parameters. Mg-substitution decreases the electronic polarization () of ZnO, because of its greater ionic character, whereas the concomitant -axis compression is expected to increase the piezoelectric polarization (). Quantitative estimation of the above two contributions (, ) requires sophisticated theoretical analyses and cannot be provided here for ZnO and Zn0.875Mg0.125O. Meanwhile, the ionic polarization () of Zn1-xMgxO can be approximated by a simple electrostatic model using the -axial positions of Zn, Mg, and O. We calculated of Zn0.875Mg0.125O and ZnO, assuming point charges ( +2 for Zn and Mg, and 2 for O), and using the atomic coordinates as determined by neutron PDF analysis (see Appendix). Separate reference structures were used for ZnO and Zn0.875Mg0.125O, with the corresponding experimental and values, but with = 0.375, so that within isolated (Zn,Mg)O4 moieties the net centers of the cation and anion charges coincide. The calculated values (= here), along , are for ZnO and for Zn0.875Mg0.125O (). For comparison, Malashevich and VanderbiltMala1 have employed the Berry-phase approach, to obtain electric polarization of a Zn5MgO6 () supercell. They find , , and , relative to . In fact, the following relations hold true in general for other Zn1-xMgxO supercells () studied by them: , , , and || || ||. We therefore expect that the total polarization of Zn1-xMgxO should be larger than that of ZnO, with the increases of piezoelectric and ionic polarizations dominating the decrease of the electronic contribution. We note that (ZnO) from Malashevich and Vanderbilt differs somewhat from the results of other DFT studiesGopal ; Corso ; Bernardini ; Noel which reported . But since we are primarily interested in the relative portions of , , and in the , and their changes with respect to the Mg-substitution in ZnO, we ignore the small discrepancies in the absolute values.
The result, an increase of upon Mg-substitution, differs from our previous estimates based solely on synchrotron x-ray diffraction analyses.Kim1 ; Kim2 This inconsistency arises mostly from the improved models for the Zn1-xMgxO supercell structures that are permitted by the superior neutron scattering results. Figure 8 clearly shows the greatly enhanced data quality of the neutron scattering measurements, compared with x-ray experiments. The neutron data lead to better precision (see Table 1 and ref.Kim1 ), as well as better accuracy, in the subsequent structure analyses.
It is also noteworthy that the structure modeling for the PDF or Rietveld analyses can confine the range of structural information that is sought. For example, Rietveld refinement of Zn1-xMgxO used only one positional parameter, and therefore MgO4 and ZnO4 tetrahedra are characterized by the same and . In the x-ray PDF refinement, two position parameters were refined, so that we could differentiate (Mg) and (Zn), but not their ratios. However, for the neutron PDF refinement, we used four positional parameters as variables, and were able to distinguish the MgO4 and ZnO4 geometries through both and . Again, the choice of a structural model relies on the quality of the diffraction data, for this application on a system with relatively low-atomic-number elements. The neutron data showed sufficient integrity for testing various structure models, which were not possible for the x-ray data alone.
IV Conclusion
Detailed structural analyses of Zn1-xMgxO () solid solutions, focusing on the dissimilar local geometries of Mg and Zn, have been performed by using Raman scattering, 67Zn/25Mg NMR spectroscopy, and neutron Rietveld/PDF analyses. Line broadenings of the Raman and 67Zn/25Mg NMR spectra imply that Mg-substitution into a ZnO-rich lattice gradually increases the configurational disorder and crystal defects in the lattice. Rietveld refinement of time-of-flight neutron diffraction patterns and Raman peak profile analyses show that the macroscopic lattice distortions in Zn1-xMgxO wurtzites develop in a way such that the ratio decreases with Mg content . A real-space neutron PDF analysis using a supercell model of Zn7MgO8 reveals that the Mg and Zn atoms in Zn1-xMgxO have markedly distinct local geometries: MgO4 tetrahedra are smaller in height and volume and have a larger internal parameter . The wurtzite structural parameters and for MgO4 deviate from their ideal values, in agreement with computational predictions of wurtzite MgO structures. Previous DFT studies on Zn1-xMgxO supercells and the present neutron PDF analysis strongly suggest that Mg-substitution will increase the spontaneous polarization of ZnO.
ACKNOWLEDGEMENTS
The authors acknowledge support from the National Science Foundation through the MRSEC program (DMR05-20415) and from the Department of Energy, Basic Energy Sciences, Catalysis Science Grant No. DE-FG02-03ER15467. This work has benefited from the use of NPDF at the Lujan Center at Los Alamos Neutron Science Center, funded by DOE Office of Basic Energy Sciences. Los Alamos National Laboratory is operated by Los Alamos National Security LLC under DOE Contract DE-AC52-06NA25396. The authors are grateful to the NSF-supported National High Magnetic Field Laboratory, in Tallahassee, Florida for access to the high-field (19.6 T) NMR facilities, and to Zhehong Gan for assistance with the NMR measurements. Andrei Malashevich and David Vanderbilt kindly provided the DFT optimized structural data for Zn1-xMgxO supercells. The authors also thank Brent Melot and Daniel Shoemaker for the neutron data collection.
References
- (1) A. Tsukazaki, A. Ohtomo, T. Kita, Y. Ohno, H. Ohno, and M. Kawasaki, Science 315, 1388 (2007).
- (2) K. Koike, K. Hama, I. Nakashima, G. Takada, M. Ozaki, K. Ogata, S. Sasa, M. Inoue, and M. Yano, Jpn. J. Appl. Phys. 43, L1372 (2004).
- (3) S. Rajan, H. Xing, S. DenBaars, U. K. Mishra, and D. Jena, Appl. Phys. Lett. 84, 1591 (2004).
- (4) S. Sasa, M. Ozaki, K. Koike, M. Yano, M. Inoue, Appl. Phys. Lett. 89, 053502 (2006).
- (5) H. Tampo, H. Shibata, K. Matsubara, A. Yamada, P. Fons, S. Niki, M. Yamagata, and H. Kaine, Appl. Phys. Lett. 89, 132113 (2006).
- (6) J. H. Davies, The Physics of Low-Dimensional Semiconductors: An Introduction (Cambridge University Press, New York, 1998).
- (7) Y.-I. Kim, K. Page, and R. Seshadri, Appl. Phys. Lett. 90, 101904 (2007).
- (8) Y.-I. Kim, K. Page, A. M. Limarga, D. R. Clarke, and R. Seshadri, Phys. Rev. B 76, 115204 (2007).
- (9) Th. Proffen, T. Egami, S. J. L. Billinge, A. K. Cheetham, D. Louca, and J. B. Parise, App. Phys. A 74, S163 (2002).
- (10) D. A. Shirley, Phys. Rev. B 5, 4709 (1972).
- (11) P. Thompson, D. E. Cox, and J. B. Hastings, J. Appl. Cryst. 20, 79 (1987).
- (12) M. Yoshikawa, Mater. Sci. Forum. 52-53, 365 (1989).
- (13) R. Dupree and M. E. Smith, J. Chem. Soc. Chem. Commun. 1988, 1483.
- (14) D. Massiot, F. Fayon, M. Capron, I. King, S. Le Calve, B. Alonso, J.-O. Durand, B. Bujoli, Z. Gan, and G. Hoatson, Mag. Reson. Chem. 40, 70 (2002).
- (15) P. F. Peterson, M. Gutmann, Th. Proffen, and S. J. L. Billinge, J. Appl. Cryst. 32, 1192 (2000).
- (16) C. L. Farrow, P. Juhas, J. W. Liu, D. Bryndin, E. S. Bozin, J. Bloch, Th. Proffen, and S. J. L. Billinge, J. Phys.:Condens. Matter 19, 335219 (2007).
- (17) A. C. Larson and R. B. von Dreele, Los Alamos National Laboratory Report No. LAUR 86-748, 1994.
- (18) B. H. Toby, J. Appl. Cryst. 34, 210 (2001).
- (19) J. M. Calleja and M. Cardona, Phys. Rev. B 16, 3753 (1977)
- (20) T. C. Damen, S. P. S. Porto, and B. Tell, Phys. Rev. 142, 570 (1966).
- (21) J. M. Zhang, T. Ruf, M. Cardona, O. Ambacher, M. Stutzmann, J.-M. Wagner, and F. Bechstedt, Phys. Rev. B 56, 14399 (1997).
- (22) H.-M. Cheng, K.-F. Lin, H.-C. Hsu, C.-J. Lin, L.-J. Lin, and W.-F. Hsieh J. Phys. Chem. B 109, 18385 (2005).
- (23) E. Kundla, A. Samoson, and E. Lippmaa, Chem. Phys. Lett. 83, 229 (1981).
- (24) E. S. Toberer, J. D. Epping, B. F. Chmelka, R. Seshadri, Chem. Mater. 18, 6345 (2006)
- (25) K. J. D. MacKenzie and R. H. Meinhold, Am. Miner. 79, 250 (1994). Mg survey
- (26) K. J. D. MacKenzie and R. H. Meinhold, Thermochim. Acta 230, 331 (1993).
- (27) M. Magi, E. Lippmaa, A. Samoson, G. Engelhardt, and A.-R. Grimmer, J. Phys. Chem. 88, 1518 (1984).
- (28) H. Sawada, R. Wang, and A. W. Sleight, J. Solid State Chem. 122, 148 (1996).
- (29) T. M. Sabine and S. Hogg, Acta Crystallogr. B 25, 2254 (1969).
- (30) S. C. Abrahams and J. L. Bernstein, Acta Crystallogr. B 25, 1233 (1969).
- (31) P. Harrison, G. A. Jeffrey, and J. R. Townsend, Acta Crystallogr. 11, 552 (1958).
- (32) J. Albertsson, S. C. Abrahams, and A. Kvick, Acta Crystallogr. B 45, 34 (1989).
- (33) E. H. Kisi and M. M. Elcombe, Acta Crystallogr. C 45, 1867 (1989).
- (34) V. F. Sears, Neutron News 3, 26 (1992).
- (35) I. D. Brown, The Chemical Bond in Inorganic Chemistry: The Bond Valence Model (Oxford University Press, Oxford, 2002).
- (36) I. D. Brown, Acta Crystallogr. B 48, 553 (1992).
- (37) Y.-I. Kim and R. Seshadri, J. Korean Phys. Soc. in press.
- (38) Y.-I. Kim and R. Seshadri, Inorg. Chem. in press.
- (39) N. E. Brese and M. O’Keeffe, Acta Crystallogr. B 47, 192 (1991).
- (40) R. D. Shannon, Acta Crystallogr. A 32, 751 (1976).
- (41) S. Limpijumnong and W. R. L. Lambrecht, Phys. Rev. B 63, 104103 (2001).
- (42) A. Janotti, D. Segev, and C. G. Van de Walle, Phys. Rev. B 74, 045202 (2006).
- (43) P. Gopal and N. A. Spaldin, J. Electron. Mater. 35, 538 (2006).
- (44) A. Malashevich and D. Vanderbilt, Phys. Rev. B 75, 045106 (2007).
- (45) X. F. Fan, H. D. Sun, Z. X. Shen, J.-L. Kuo, and Y. M. Lu, J. Phys.:Condens. Matter 20, 235221 (2008).
- (46) A. Malashevich and D. Vanderbilt, private communications.
- (47) A. Dal Corso, M. Posternak, R. Resta, and A. Baldereschi, Phys. Rev. B 50, 10715 (1994).
- (48) F. Bernardini, V. Fiorentini, and D. Vanderbilt, Phys. Rev. B 56, R10024 (1997).
- (49) Y. Noel, C. M. Zicovich-Wilson, B. Civalleri, Ph. D’Arco, and R. Dovesi, Phys. Rev. B 65, 014111 (2001).
APPENDIX
Complete list of atomic coordinates for the 16-atom wurtzite supercell Zn7MgO8 (, , 90∘, 120∘), as determined by the neutron PDF analysis.
| Atom | Type | |||
|---|---|---|---|---|
| Zn | 0.1667 | 0.3333 | 0 | Zn1 |
| 0.6667 | 0.3333 | 0 | Zn3 | |
| 0.1667 | 0.8333 | 0 | Zn1 | |
| 0.6667 | 0.8333 | 0 | Zn1 | |
| 0.3333 | 0.1667 | 0.5 | Zn2 | |
| 0.8333 | 0.1667 | 0.5 | Zn2 | |
| 0.8333 | 0.6667 | 0.5 | Zn2 | |
| Mg | 0.3333 | 0.6667 | 0.486(8) | Mg |
| O | 0.1667 | 0.3333 | 0.386(3) | O2 |
| 0.6667 | 0.3333 | 0.3825(8) | O3 | |
| 0.1667 | 0.8333 | 0.386(3) | O2 | |
| 0.6667 | 0.8333 | 0.386(3) | O2 | |
| 0.3333 | 0.1667 | 0.8825(8) | O3 | |
| 0.8333 | 0.1667 | 0.8825(8) | O3 | |
| 0.3333 | 0.6667 | 0.858(5) | O1 | |
| 0.8333 | 0.6667 | 0.8825(8) | O3 |