A New Hubble Space Telescope Distance to NGC 1569:
Starburst Properties and IC 342 Group Membership
Abstract
We present deep HST ACS/WFC photometry of the dwarf irregular galaxy NGC 1569, one of the closest and strongest nearby starburst galaxies. These data allow us, for the first time, to unequivocally detect the tip of the red giant branch and thereby determine the distance to NGC 1569. We find that this galaxy is 3.360.20 Mpc away, considerably farther away than the typically assumed distance of 2.20.6 Mpc. Previously thought to be an isolated galaxy due to its shorter distance, our new distance firmly establishes NGC 1569 as a member of the IC 342 group of galaxies. The higher density environment may help explain the starburst nature of NGC 1569, since starbursts are often triggered by galaxy interactions. On the other hand, the longer distance implies that NGC 1569 is an even more extreme starburst galaxy than previously believed. Previous estimates of the rate of star formation for stars younger than 1 Gyr become stronger by more than a factor of 2. Stars older than this were not constrained by previous studies. The dynamical masses of NGC 1569’s three super star clusters, which are already known as some of the most massive ever discovered, increase by 53% to 6-7.
Subject headings:
galaxies: dwarf — galaxies: irregular — galaxies: evolution — galaxies: individual (NGC 1569 (catalog )) — galaxies: stellar content1. Introduction
Massive starbursts drive the evolution of galaxies at high redshift; they provide chemical enrichment and thermal and mechanical heating of both the interstellar and intergalactic medium. In the past decade, a large population of star-forming galaxies has been discovered at high redshift, highlighting the importance of these galaxies on a cosmological scale. However, starburst galaxies can only be studied in detail in the nearby Universe where they are much rarer. The dwarf irregular galaxy NGC 1569 is one of the closest examples of a true starburst. Star formation in NGC 1569 has been studied extensively with the Hubble Space Telescope (HST; e.g., Greggio et al. 1998, hereafter G98, Aloisi et al. 2001, Angeretti et al. 2005, hereafter A05), with results showing that its star formation rates (SFRs) are 2-3 times higher than in other strong starbursts (e.g. NGC 1705) and 2-3 orders of magnitude higher than in Local Group irregulars and the solar neighborhood, if the SFR per unit area is considered. NGC 1569 is also home to three of the most massive super star clusters (SSCs) ever discovered.
Although it lies on the sky in the same direction as the IC 342 group of galaxies (see Fig. 2 in Karachentsev et al. 2003), the typically assumed distance of 2.20.6 Mpc (Israel 1988) is based on the luminosity of the brightest resolved stars (Ables 1971) and places NGC 1569 well in front of IC 342 ( Mpc; Saha, Claver, & Hoessel 2002). NGC 1569 has therefore generally been viewed as an isolated starburst galaxy just beyond the outskirts of the Local Group. The isolated environment makes it more complicated to understand the trigger of the starburst, since starbursts are often associated with galaxy interactions and are not generally believed to be internally driven. However, NGC 1569’s distance is relatively uncertain, and a large range of possible distances exists in the literature. For example, using HST/WFPC2 photometry, Makarova & Karachentsev (2003) attempted to measure the brightness of stars at the tip of the red giant branch (TRGB) in NGC 1569 and found, due to the limited number of stars available at their detection limit, two possible solutions; a short distance of Mpc or a long distance of Mpc, with no preference for one over the other. We note also that distance determinations based on the brightest resolved stars in dwarf galaxies are prone to considerable uncertainty due to stochastic effects (e.g. Greggio 1986), and that, at the distance of NGC 1569, ground-based observations suffer from the possibility of misinterpreting star clusters or pairs of stars as individual stars.
In an effort to better determine its star formation history (SFH), we have used the HST ACS/WFC to obtain deep - and -band photometry of NGC 1569. These data also provide for the first time an accurate distance based on unequivocal identification of the TRGB, which we present and discuss in this Letter.
2. Observations and Photometry
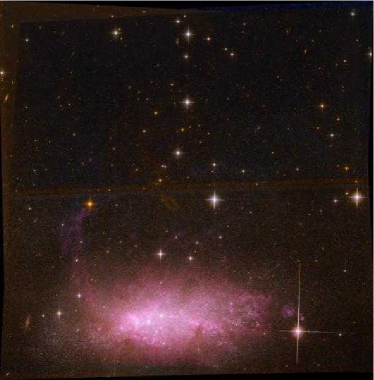
NGC 1569 was imaged in November 2006 and January 2007 with the ACS/WFC using the F606W () and F814W () broad-band filters and the F658N (H) narrow-band filter (HST GO-10885, PI: Aloisi). The H image was not used for photometry and is thus excluded from further discussion herein. The total exposure time in the -band was 61716s, comprised of 54 individual images that were taken at two different orientations. Similarly, for the -band we have 22 images with a total exposure time of 24088s, also taken at two orientations. Images in both filters were dithered using standard patterns to fill in the gap between the two ACS CCDs and to improve the sampling of the point spread function (PSF). For each filter, the individual images were processed with the most up-to-date version of the ACS pipeline (CALACS) and then combined into a single image using the MULTIDRIZZLE software package (Koekemoer et al. 2002). During the combination, we fine-tuned the image alignment and corrected for small shifts, rotations and scale variations between the images. The MULTIDRIZZLE software also removes cosmic rays and bad pixels and corrects the images for geometric distortions. Our final and images were resampled to a pixel size of (0.7 times the original ACS/WFC pixel scale) and cover roughly . Figure 1 shows our 3-color image of NGC 1569.
We performed photometry on the processed images using the stand alone version of DAOPHOT (Stetson 1987) in the following manner. To create the PSF model, in each image we chose 400 bright stars with good spatial coverage across the entire image, but avoided the crowded inner regions of the galaxy. Nearby neighbors were subtracted from around the PSF stars and the ‘cleaned’ stars were used to make the final PSF. We performed PSF fitting on our and images using ALLSTAR. To find and photometer faint neighbors, we performed a single iteration of fitting the ‘known’ stars, subtracting them from the frame, searching for faint companions, and then re-performing the PSF fitting on the entire original frame using the updated catalog. The and photometry lists were then matched, with a required matching radius of 0.5 pixels, resulting in a photometric catalog of 445,000 stars. We corrected for CCD charge transfer efficiency losses following the prescription in Riess and Mack (2004). The photometry was converted to the Johnson-Cousins system by following the procedure outlined in Sirianni et al. (2005), but using updated ACS zeropoints (Bohlin 2007).
3. TRGB Distance to NGC 1569
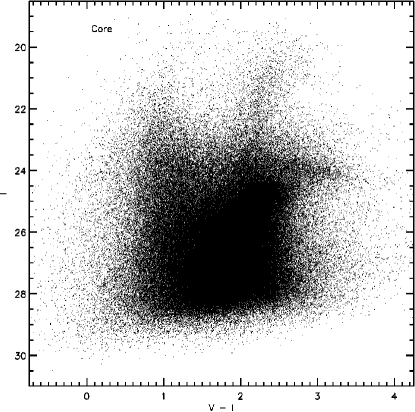
As has been shown by previous authors (e.g. G98, A05), NGC 1569 has undergone recent, massive bursts of star formation, and this is evident in Fig. 2 where we plot the CMD for all stars in the ‘core’ of NGC 1569. For the purposes of this paper, we refer to the bottom half of Fig. 1 as the core of NGC 1569 and the top half as the halo. Figure 2 is dominated by features associated with young stars; above , the blue plume, which samples both the young ( Myr) main sequence as well as massive ( ) stars on the blue part of the core helium-burning phase, is clearly visible at . In addition, the red plume of supergiants at and the blue loop stars (residing between the blue and red plumes) are indicative of evolved stars with masses between 5 and 9 . We note also the presence of intermediate-age carbon stars on the thermally pulsing asymptotic giant branch at and .
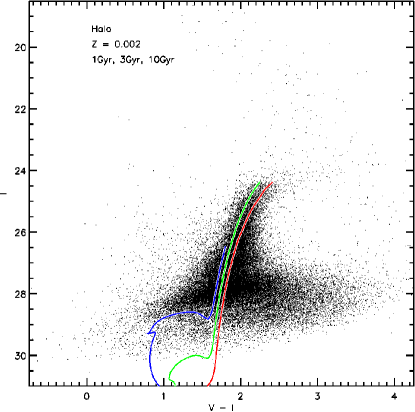
The recent star formation burst in NGC 1569 has occurred almost exclusively in the core of the galaxy, as is evidenced by Fig. 3, where we have plotted only those stars in the halo of NGC 1569. In this figure the only obvious feature is the upper 4 magnitudes of the galaxy’s RGB, the result of an underlying population in NGC 1569 with an age 2 Gyr. This feature is visible in the core CMD as well, but there it is more heavily blended with younger evolutionary features.
The location of the TRGB acts as a discontinuity in the luminosity function (LF) of a stellar population. We measure the brightness of the TRGB by following the software developed by one of us (RvdM) and detailed in Cioni et al. (2000). The software calculates the first and second derivatives of the LF, fits Gaussians to their peaks, and then corrects the peak magnitudes for the small biases induced by LF smoothing due to photometric errors and binning. In the top panel of Fig. 4 we plot the LF for RGB stars in NGC 1569’s halo, and indicate the identified TRGB at = 24.370.03 (random error). The bottom panel shows the core LF and its identified TRGB at = 24.470.01 (in this case we applied a loose CMD color cut to help isolate RBG stars, although this is not required for our method to provide valid results). The fainter TRGB magnitude in the core may be explained by an internal reddening of E(B–V) 0.07, or by the presence of younger and/or more metal-rich RGB stars in the core of the galaxy. Our TRGB measurements cannot determine the exact cause of this variation.

A variety of authors have calculated both the foreground reddening toward and intrinsic reddening in NGC 1569. Maps of the extinction due to the Milky Way (MW) provided by Burstein & Heiles (1982) and Schlegel et al. (1998) give values of E(B–V) = 0.50 and 0.68 mag, respectively. The most commonly adopted extinction for NGC 1569 is E(B–V) = 0.56 (Israel 1988), calculated using integrated UV photometry. We note that we adopt the reddening law of Cardelli et al. (1989), where AV = 3.1E(B–V), and AI = 0.479AV. We test the range of reddening values by comparing our photometry to the Padova isochrones (Marigo et al. 2008), focusing on matching the slope and color of the observed and theoretical RGBs in the halo. The slope of the observed CMD is best matched by isochrones with Z = 0.002 ( 0.1). Isochrones that are more metal-poor are too vertical to match the RGB, while more metal-rich isochrones have too much curvature. The color of the data best matches the Z = 0.002 isochrones if we use the lowest reddening value, E(B–V) = 0.50. In Fig. 3 we illustrate this agreement by overplotting isochrones for stellar populations with ages of 1, 3, and 10 Gyr, Z = 0.002 ([Fe/H] ), and E(B–V) = 0.50. Adopting a reddening value on the low end of the published values is reasonable for the following reasons. As discussed by Relaño et al. (2006), the Schlegel et al. (1998) foreground reddening is higher than the total extinction derived by most authors (e.g. Israel 1988, Origlia et al. 2001) and is likely an overestimate of the reddening at the position of NGC 1569. In addition, since the value calculated by Israel (1988) is based on integrated UV photometry of the core of NGC 1569, it is probably a measure of both the foreground reddening and extinction due to the gas and dust associated with the recent burst of star formation. Since the recent star formation in NGC 1569 is concentrated in the core, extinction in the halo should be lower.
Using synthetic CMDs, Barker, Sarajedini, and Harris (2004) studied the reliability of the TRGB as a distance indicator for stellar populations with complex star formation histories. They found that the -band TRGB absolute magnitude = 0.1 independent of SFH, provided that the combination of age, metallicity, and multiple bursts are such that the median dereddened color of the RGB stars 0.5 mag below the TRGB is . For NGC 1569, we find the median = 1.4 for all RGB stars between 0.4 and 0.6 mag below the tip. It is therefore appropriate to assume = 0.1 for our distance calculations. Combined with = 24.370.03 and E(B–V) = 0.500.05 in the halo this yields , or Mpc.
4. Implications of a Longer Distance
The IC 342 group of galaxies has a mean distance of 3.350.09 Mpc with a line-of-sight depth of 0.25 Mpc (1; Karachentsev 2005, hereafter K05). Our new HST TRGB distance to NGC 1569 places it at the same distance as the group, and only slightly farther away than IC 342 itself (3.280.27 Mpc; Saha et al. 2002). Given the apparent separation of 545, and applying the law of cosines, we find that NGC 1569 is the 4th closest galaxy to IC 342, with a physical separation of kpc. In the rest frame of the Local Group, the IC 342 group has = 22618 km s-1 (standard error), with a dispersion of 54 km s-1 (K05). NGC 1569’s radial velocity, = 88 km s-1, is 2.5 from the group average. While NGC 1569 may simply be a statistical outlier in the velocity distribution, an alternative explanation is that NGC 1569 may be falling into the IC 342 group for the first time. Either way, NGC 1569 is not an isolated galaxy, so its starburst may be due to tidal interactions with other galaxies in the IC 342 group.
The increased distance of NGC 1569 alters the existing estimates for its SFR and SSC masses that were based on the old distance of Mpc. SSCs are young, massive clusters that are bright enough to be easily observed in detail out to beyond the Local Group. Their masses, which are several orders of magnitude higher than typical Galactic open clusters, are large enough that SSCs are likely to survive for the entire lifetime of their host galaxy. SSCs are thus possible precursors to globular clusters. The Milky Way and Large Magellanic Cloud (LMC) host massive young clusters up to . However, the starburst in NGC 1569 has spawned three SSCs that are even more massive: NGC 1569-A1, NGC 1569-A2 (hereafter A1 and A2), and NGC 1569-B.
The most recent mass estimate for any of these clusters was calculated for NGC 1569-B by Larsen et al. (2008). Combining HST photometry with high-resolution spectroscopy, and assuming that NGC 1569-B is in virial equilibrium, they find for Mpc. The clusters A1 and A2 were originally thought to be a single cluster, before being resolved into two components (de Marchi et al. 1997). However, mass estimates still typically treat A1 and A2 as a single cluster (e.g. Anders et al. 2004). Gilbert and Graham (2002) provided the most recent calculation of masses for A1 and A2 individually. They obtained a high-resolution spectrum that samples both A1 and A2 simultaneously and found that the cross-correlation function between their spectrum and standard stars is best fit by two components having similar line-of-sight velocity dispersions, but different peak velocities. The resulting masses of the two components are 3.9 and 4.4 for Mpc (their method does not determine which component has which mass). Given the linear relationship between dynamical mass and distance, our longer distance to NGC 1569 increases all these mass estimates by 53%. Thus, the mass of NGC 1569-B becomes , and A1 and A2 are and .
Regarding the star formation in NGC 1569, the most recent work was by A05. Using HST NICMOS photometry they identified three major epochs of star formation, 1.33.7 yr ago, 415 yr ago, and 1 Gyr ago, with SFRs of 3.2, 1.1, and 0.8 yr-1 kpc -2, respectively. The primary SFR calculations from A05 were based on an assumed distance of 2.2 Mpc, but they also calculated SFRs using a distance of 2.9 Mpc. By adopting the longer distance, SFRs increase by a factor of 2, and the epochs of star formation shift to younger ages (e.g., 0.82.7 yr ago for the youngest epoch). Similarly, G98 found that a shift in the distance of NGC 1569 to 4 Mpc from 2.2 Mpc increased the recent SFR by a factor of 2.8 and suggested that the youngest epoch of star formation ended more recently (5 Myr ago as compared to 10 Myr ago). Note that these results only apply to stars younger than 1 Gyr as older stars were not constrained by these studies. The present-day SFR, based on H observations by Hunter & Elmegreen (2004), increases from 0.32 yr-1 to 0.75 yr-1 due to their use of 2.5 Mpc as the distance to NGC 1569. A05 did not need to include a significant epoch of star formation older than 1 Gyr in their models due to a deficiency of RGB stars detectable in their data. In contrast, our data, which are significantly deeper and cover a much larger area, show a well populated, fully formed RGB, suggesting that star formation in NGC 1569 began 2 Gyr ago. In a future paper we will make use of the depth and areal coverage of our photometry to re-derive the SFRs with a technique similar to A05 and characterize the variations in the SFH of NGC 1569 as a function of both time and location.
Facilities: HST (ACS).
References
- (1) Ables, H.D. 1971, Publications of the U.S. Naval Observatory Second Series, 20, 126
- (2) Aloisi, A., et al. 2001, AJ, 121, 1425
- (3) Anders, P., de Grijs, R., Fritze-v.Alvensleben, U., & Bissantz, N. 2004, MNRAS, 347, 17
- (4) Angeretti, L., Tosi, M., Greggio, L., Sabbi, E., Aloisi, A., & Leitherer, C. 2005, AJ, 129, 2203 (A05)
- (5) Barker, M.K., Sarajedini, A., & Harris, J. 2004, ApJ, 606, 869
- (6) Bohlin, R.C. 2007 in ASP Conf. Ser. 364, The Future of Photometric, Spectrophotometric, and Polarimetric Standardization, ed. C. Sterken (San Francisco: ASP), 315
- (7) Burstein, D. & Heiles C. 1982, AJ, 87, 1165
- (8) Cardelli, J.A., Clayton, G.C., & Mathis, J.S. 1989, ApJ, 345, 245
- (9) Cioni, M.-R. L., van der Marel, R.P., Loup, C., & Habing, H.J. 2000, A&A, 359, 601
- (10) de Marchi, G., Clampin, M., Greggio, L., Leitherer, C., Nota, A., & Tosi, M. 1997, ApJ, 479, 27
- (11) Gilbert, A.M., & Graham, J.R. 2002, in IAU Symp. 207, Extragalactic Star Clusters, ed. D. Geisler, E.K. Grebel, & D. Minniti (San Francisco: ASP), 471
- (12) Greggio, L. 1986, A&A, 190, 111
- (13) Greggio, L., Tosi, M., Clampin, M., De Marchi, G., Leitherer, C., Nota, A. & Sirianni, M. 1998, ApJ, 504, 725 (G98)
- (14) Hunter, D.A. & Elmegreen, B.G. 2004, AJ, 128, 2170
- (15) Israel, F.P. 1988, A&A, 194, 24
- (16) Karachentsev, I.D., Sharina, M.E., Dolphin, A.E., & Grebel, E.K. 2003, A&A, 408, 111
- (17) Karachentsev, I.D. 2005, AJ, 129, 178
- (18) Koekemoer, A. M., Fruchter, A. S., Hook, R. N., & Hack, W. J. 2003, HST Calibration Workshop (Baltimore: STScI), 337
- (19) Larsen, S.S., Origlia, L., Brodie, J., & Gallagher, J.S. III 2008, MNRAS, 383, 263
- (20) Marigo, P., Girardi, L., Bressan, A., Groenewegen, M. A. T., Silva, L., & Granato, G. L., A&A, 482, 883
- (21) Makarova, L.N. & Karachentsev, I.D. 2003, Astrophysics, 46, 144
- (22) Origlia, L., Leitherer, C., Aloisi, A., Greggio, L., & Tosi, M. 2001, ApJ, 122, 815
- (23) Riess, A. & Mack, J. 2004, ISR ACS 2004-006
- (24) Relaño, M., Lisenfeld, U., Vilchez, J. M., & Battaner, E. 2006, A&A, 452, 413
- (25) Saha, A., Claver, J., & Hoessel, J.G. 2002, AJ, 124, 839
- (26) Schlegel, D.J., Finkbeiner, D.P., Davis, M. 1998, ApJ, 500, 525
- (27) Sirianni, M. et al. 2005, PASP, 117, 1049
- (28) Stetson, P.B. 1987, PASP, 99, 191S