A photometric redshift of for the AGILE GRB 080514B
Abstract
Aims. The AGILE gamma-ray burst GRB 080514B is the first burst with detected emission above 30 MeV and an optical afterglow. However, no spectroscopic redshift for this burst is known.
Methods. We compiled ground-based photometric optical/NIR and millimeter data from several observatories, including the multi-channel imager GROND, as well as ultraviolet Swift UVOT and X-ray XRT observations. The spectral energy distribution of the optical/NIR afterglow shows a sharp drop in the Swift UVOT UV filters that can be utilized for the estimation of a redshift.
Results. Fitting the SED from the Swift UVOT band to the band, we estimate a photometric redshift of , consistent with the pseudo redshift reported by Pelangeon & Atteia (2008) based on the gamma-ray data.
Conclusions. The afterglow properties of GRB 080514B do not differ from those exhibited by the global sample of long bursts, supporting the view that afterglow properties are basically independent of prompt emission properties.
Key Words.:
Gamma rays: bursts: individual: GRB 080514B1 Introduction
Gamma-Ray Bursts (GRBs) are the most luminous explosions in the Universe, with the bulk of the released energy emerging in the 0.1 to 1 MeV range (e.g., Kaneko et al. 2006; Preece et al. 2000). Indeed, most bursts have not been observed at energies much above 1 MeV, where low photon counts and typically small instrumental collecting areas hamper the gathering of data. For example, the Burst And Transient Source Experiment (BATSE; operating from 25 keV to 2 MeV) aboard the Compton Gamma-Ray Observatory (CGRO) detected 2704 bursts during a nine-year lifetime (1991 to 2000), while the COMPTEL telescope on CGRO, operating in the 0.8 MeV to 30 MeV range, in the same time period observed only 44 events with high significance (Hoover et al. 2005). The number of GRBs detected at even higher energies with the EGRET TASC and spark chamber instruments is even lower (Dingus 1995; Kaneko et al. 2008).
To date no burst detected above 30 MeV has an observed afterglow. The discovery of GRB 080514B by the Italian AGILE gamma-ray satellite (Tavani et al. Tavani (2008)) on May 14, 2008 at 09:55:56 UT (Rapisarda et al. 2008) was therefore of particular interest. AGILE carries three instruments covering the energy range from 20 keV to 50 GeV and detected GRB 080514B at energies well above 30 MeV (Giuliani et al. 2008a ,b ). GRB 080514B was a bright, multi-spiked event with a duration (T90) of 5.6 s in the energy range from 350 to 1000 keV, characterizing it as a long burst.
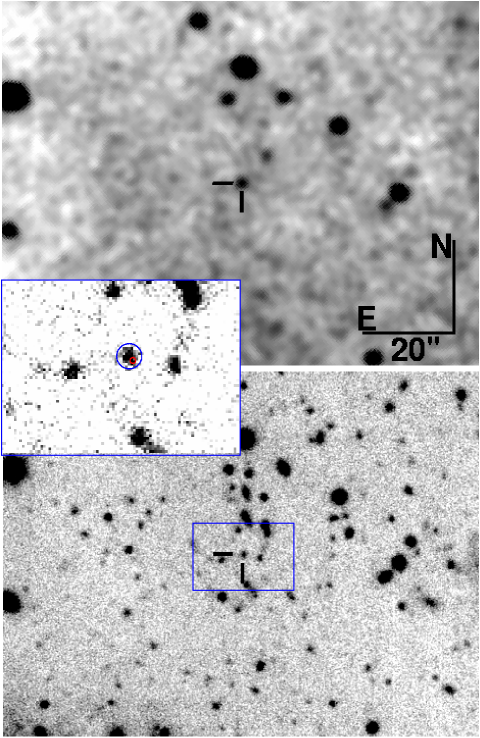
The burst was also observed by Mars Odyssey, operating as part of the Interplanetary Network (IPN) (Hurley et al. 2006), making it possible to constrain the error box of the burst to about 100 arcmin2 (Rapisarda et al. 2008). This localization led to the discovery of its X-ray afterglow by the Swift satellite at coordinates R.A., Dec. (J2000) = with an uncertainty of 16 (radius, 90% confidence) at 0.43 days after the trigger (Page et al. 2008). Before the announcement of the X-ray afterglow position, however, the optical afterglow had already been discovered by our group by observing the complete IPN error box (de Ugarte Postigo et al. 2008a , b ; fig.1). Here we report our optical/near-infrared follow-up observations of the afterglow of GRB 080514B starting 0.43 days after the trigger, extending to late times of 24 days.
| (days) | filter | instr./telesc. | exposure (s) | mag |
|---|---|---|---|---|
| 0.430 | UVOT | 284 | 20.45 0.40 | |
| 0.432 | UVOT | 142 | 19.75 0.30 | |
| 0.434 | UVOT | 142 | 21.00 0.63 | |
| 0.438 | UVOT | 568 | 21.47 0.56 | |
| 0.443 | UVOT | 142 | 20.88 1.50 | |
| 0.446 | UVOT | 413 | 21.97 1.30 | |
| 0.488 | UVOT | 419 | 20.17 0.27 | |
| 0.492 | UVOT | 209 | 19.91 0.27 | |
| 0.494 | UVOT | 209 | 20.40 0.31 | |
| 0.501 | UVOT | 838 | 21.78 0.57 | |
| 0.507 | UVOT | 209 | 19.74 0.42 | |
| 0.512 | UVOT | 616 | 20.63 0.37 | |
| 0.555 | UVOT | 415 | 20.88 0.46 | |
| 0.559 | UVOT | 207 | 20.09 0.32 | |
| 0.561 | UVOT | 207 | 21.62 0.91 | |
| 0.567 | UVOT | 791 | 22.09 0.76 | |
| 0.640 | Watcher | 120x14 | 19.23 0.47 | |
| 0.660 | Watcher | 120x15 | 19.89 0.56 | |
| 0.727 | IAC 80 | 3x300 | 20.26 0.21 | |
| 0.743 | IAC 80 | 3x300 | 20.59 0.20 | |
| 0.761 | IAC 80 | 3x300 | 20.16 0.16 | |
| 0.774 | IAC 80 | 3x300 | 20.03 0.14 | |
| 0.907 | GROND/2.2m | 3x1501 | 21.53 0.04 | |
| 0.907 | GROND/2.2m | 3x1501 | 21.16 0.03 | |
| 0.907 | GROND/2.2m | 3x1501 | 20.77 0.08 | |
| 0.907 | GROND/2.2m | 3x1501 | 20.43 0.05 | |
| 0.907 | GROND/2.2m | 3x1200 | 19.82 0.03 | |
| 0.907 | GROND/2.2m | 3x1200 | 19.10 0.04 | |
| 0.907 | GROND/2.2m | 2x1200 | 17.5 | |
| 1.021 | NEWFIRM/KPNO | 23x30x2 | 19.84 0.14 | |
| 1.038 | NEWFIRM/KPNO | 15x30x2 | 20.06 0.07 | |
| 1.763 | NOT | 1x300 | 22.31 0.08 | |
| 1.782 | NOT | 1x300 | 23.03 0.13 | |
| 1.798 | NOT | 1x300 | 22.00 0.10 | |
| 1.899 | GMOS/Gemini | 1x200 | 21.83 0.06 | |
| 1.993 | GROND/2.2m | 1x1501 | 22.74 0.08 | |
| 1.993 | GROND/2.2m | 1x1501 | 22.38 0.10 | |
| 1.993 | GROND/2.2m | 1x1501 | 21.78 0.13 | |
| 1.993 | GROND/2.2m | 1x1501 | 21.6 | |
| 1.993 | GROND/2.2m | 1x1200 | 20.3 | |
| 1.993 | GROND/2.2m | 1x1200 | 19.1 | |
| 1.993 | GROND/2.2m | 1x1200 | 17.7 | |
| 2.023 | NEWFIRM/KPNO | 15x30x2 | 20.95 0.30 | |
| 2.039 | NEWFIRM/KPNO | 15x15x4 | 20.3 | |
| 2.536 | White | UVOT | 5361 | 22.19 0.17 |
| 8.965 | GROND/2.2m | 4x1501 | 24.05 0.17 | |
| 8.965 | GROND/2.2m | 4x1501 | 24.40 0.25 | |
| 8.965 | GROND/2.2m | 4x1501 | 23.35 0.26 | |
| 8.965 | GROND/2.2m | 4x1501 | 23.28 0.24 | |
| 8.965 | GROND/2.2m | 4x1200 | 21.9 | |
| 8.965 | GROND/2.2m | 4x1200 | 20.5 | |
| 8.965 | GROND/2.2m | 3x1200 | 18.4 | |
| 24.13 | Keck | 960 | 24.17 0.33 | |
| 24.13 | Keck | 1080 | 24.73 0.34 |
2 Observations and data reduction
Swift UVOT began observing the afterglow 0.43 days after the SuperAGILE/IPN detection (Holland holland (2008)), in the broad-band , , , , and lenticular filters, covering the wavelength range between 1600 Å and 6000 Å (Poole et al. 2008). A second set of observations were obtained in the band days after the trigger, covering the wavelength range from 1600 Å to 8000 Å. Photometry was performed on the UVOT data using the standard Swift software tool uvotmaghist (version 1.0), where source counts are extracted using a circular aperture with a radius of 3″, and the background was derived from a source-free region close to the target with a 15″ radius. An aperture correction was applied in order to remain compatible with the effective area calibrations, based on 5″ aperture photometry (Poole et al. 2008).
Ground-based follow-up observations were performed by our group using the Watcher telescope in South Africa, the IAC80 telescope at Observatorio del Teide, the MPG/ESO 2.2m telescope on La Silla equipped with GROND (Greiner et al. 2007, 2008), the Nordic Optical Telescope on La Palma, the Kitt Peak 4m telescope, the Gemini North 8m and the Keck 10m telescope on Mauna Kea, Hawaii (Table 1). The data were analyzed using standard PSF photometry and aperture photometry for the host galaxy. The data given in the table supersede the magnitudes reported in the Gamma-ray burst Coordinate Network circulars (de Ugarte Postigo et al. 2008a ,b ; Rossi et al. 2008a,b; Updike et al. 2008a,b; Malesani et al. Malesani (2008); Perley et al. Perley (2008)).
Our dataset is completed by an observation at 86 GHz with the Plateau de Bure interferometer (Guilloteau et al. 1992) using the 5-antenna compact D configuration and performed 3.92 days after the burst. We did not detect any source at the afterglow position within a 3-sigma detection limit of 0.57 mJy.
Afterglow coordinates were derived from the GROND first epoch stacked -band image, which has an absolute astrometric precision of about , corresponding to the RMS accuracy of the USNO-B1 catalogue (Monet et al. 2003). The coordinates of the optical afterglow are R.A., Dec. (J2000) = , (Galactic coordinates , = ). The Schlegel, Finkbeiner, & Davis (1998) extinction maps give mag along this line of sight through the Galaxy. Assuming a ratio of visual-to-selective extinction of 3.1, this implies 0.19 mag.
Swift performed a Target of Opportunity (ToO) observation of the
AGILE/IPN error box 0.43 days after the trigger and found two new
X-ray sources. The brightest of these was found to fade, identifying it as
the X-ray afterglow.
X-ray data were obtained from the Swift data archive and the light curve from
the Swift light curve repository (Evans et al. 2007). To reduce the data, the
software package HeaSoft 6.4 was used111see http://heasarc.gsfc.nasa.gov/docs/software/
lheasoft/, with the
calibration file version v011222see http://heasarc.gsfc.nasa.gov/docs/heasarc/caldb/
caldb_intro.html. Data
analysis was performed following the procedures described in Nousek et al. (2006).
Spectral analysis was performed with the software package Xspec v12, using
the elemental abundance templates of the Galactic interstellar medium given by
Wilms et al. (2000). Because Swift did not begin observations until 0.43 days after
the trigger, the quality of the spectrum and of the light curve of the X-ray
afterglow suffers from a low count rate and data gaps due to Swift’s orbit.
3 Results
3.1 The X-ray afterglow
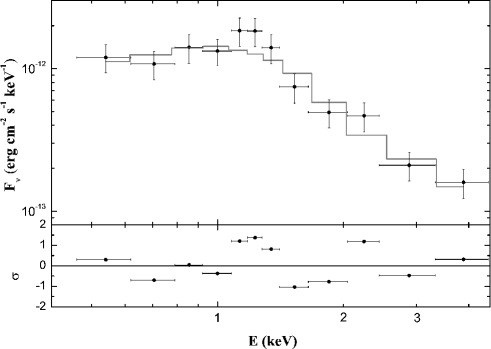
Fitting the spectrum of the first observing block ( days; total exposure time 5916 s) with an absorbed power-law333The Tübingen model was used to take in account the absorption, see Wilms et al. (Wilms (2000)). results in a spectral slope444For the flux density of the afterglow we use the usual convention . of and an effective hydrogen column density of (), in agreement with values reported by Page et al. (2008; Fig. 2) ( uncertainties). We were unable to constrain the possibility of spectral evolution. The derived hydrogen column density is higher than the Galactic value of based on radio observations (Kalberla et al. 2005). This suggests the presence of additional absorption by gas in the host galaxy.
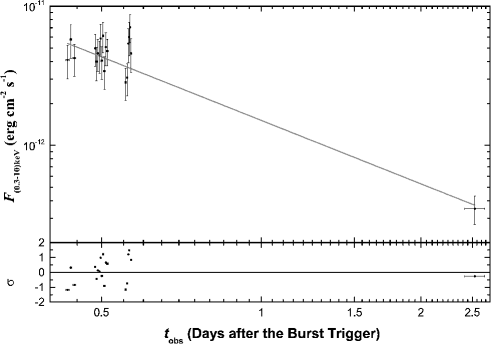
The canonical X-ray afterglow light curve derived by Nousek et al. (2006) shows a transition from a plateau to the normal decay phase between and days post-burst and a jet break thereafter. Unfortunately, for GRB 080514B at early times (0.463 to 0.694 days) the X-ray light curve exhibits substantial scatter, as it has also been the case for other X-ray afterglows (cf. O’Brien et al. 2006). This, together with the lack of data thereafter, makes it impossible to decide whether there was a plateau phase at early times (0.463 to 0.694 days), a flare, or a break in the decay between 0.694 to 2.315 days. Assuming a simple power-law decay, the light curve is well described by a temporal decay index of (/d.o.f. = 17.68/18). A smoothly broken power-law is statistically not favoured (Fig. 3).
3.2 The optical afterglow
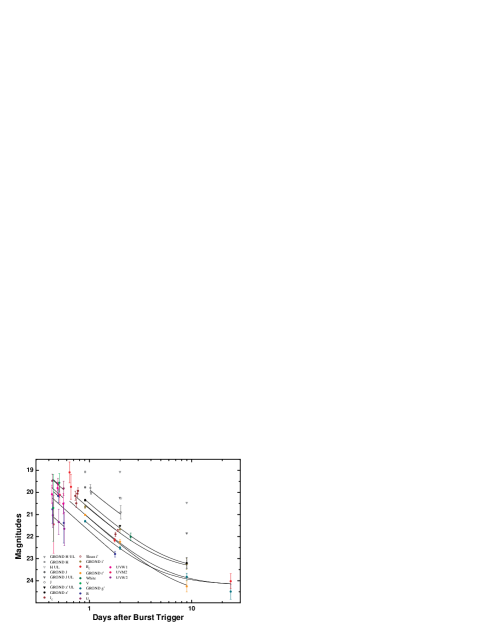
While the optical afterglow is detected over a broad range of filters, from the Swift UVOT band to the band (160-1700 nm), the data set is sparse, with some scatter (Fig. 4). To determine the slope of the light curve decay as well as the spectral energy distribution (SED) of the afterglow, we simultaneously fit all 14 bands with detections (excluding the UVOT White filter measurement) with a single power-law and an added host galaxy component for those bands where the late flattening indicates that the afterglow has become fainter than the host. From this fit (d.o.f. ), we find a decay slope . Unfortunately, this value alone is insufficient to decide whether this is a pre-break or a post-break decay. Light curves with such a (steep) pre-jet break decay slope or with such a (flat) post-jet break decay slope have both been observed (see, e.g., Zeh et al. 2006, Kann et al. Kann2008 (2008) for compilations of optical afterglow data). We thus find no evidence for a jet break.
3.3 SED and photometric redshift
The simultaneous fitting procedure described in §3.2 yields magnitudes normalized to one day after the GRB for each band, which define the spectral energy distribution (SED) of the afterglow. We find no evidence for strong chromatic evolution but caution again that the data are sparse and often have low signal-to-noise values. The SED is well described by a simple power-law with spectral slope () from the band to the band (Fig. 5). The UVOT band is an outlier of the fit but it does not significantly disturb the result. We do not find evidence for dust in the host galaxy, which would create spectral curvature. The three UVOT UV filters, on the other hand, show a much steeper slope. Such a feature cannot be explained by standard models of dust extinction, but it is the signature of the Lyman dropout effect due to intergalactic hydrogen along the line of sight to a relatively large redshift. Using HyperZ (Bolzonella et al. 2000), and assuming =0, the best fit indcates a photometric redshift of ( uncertainties, see Avni Avni (1976)), in agreement with the constraint of based on Gemini-North observations (Perley et al. 2008) and the pseudo redshift of based on the burst spectrum (Pelangeon & Atteia 2008). On the other hand, it is intermediate between the two redshift estimations presented by Gendre et al. (2008). Excluding the filter from the fit, does not change the obtained photometric redshift. Also, doubling the assumed Galactic extinction value to , does not change the deduced photometric redshift notebly. However, the shape of the SED then indicates that we have overcorrected for the extinction.

Fixing , we re-fit the SED (now excluding the UVOT UV filters) with dust models for the Milky Way, Large and Small Magellanic Clouds (see Kann et al. 2006 for the procedure). In all cases, adding as an additional parameter does not improve the fits significantly, and the derived extinction is zero within errors for all three cases too (at 3 confidence, for MW, for LMC and for SMC dust). No evidence for a 2175 Å feature (which would lie close to the and bands) is apparent, and no discrimination is possible between dust models.
The assumption of zero extinction is consistent with several studies (Starling et al. 2007; Schady et al. 2007) on the dust-to-gas ratios in host galaxies of GRBs where it is shown that the observed GRBs occur in low-metallicity environments.
For an assumed redshift of , and fixing the Galactic hydrogen column density to the value given by Kalberla et al. (2005), this implies a host-intrinsic column density of and an unabsorbed spectral index of (). The deduced value for the spectral slope is consistent with the mean value found for Swift X-ray afterglows (O’Brien et al. 2006).
Using the derived spectral slope and redshift, the absolute magnitude of the afterglow is and , at one and four days after the GRB, respectively (for the method see Kann et al. 2006, 2008; no extinction is assumed). A comparison with the sample presented in Kann et al. (2008) shows that these are typical values for a GRB afterglow, i.e., GRB 080514B is neither exceptionally bright or faint.
| afterglow model | Optical | X-ray | ||
| predicted | -level | predicted | -level | |
| iso | ||||
| ISM, wind, | ||||
| ISM, | ||||
| wind, | ||||
| jet | ||||
| ISM, wind, | ||||
| ISM, wind, | ||||
3.4 The host galaxy
A galaxy underlying the position of the optical transient is detected in all GROND optical bands at 8.9 days, as well as in the deep Keck and -band images obtained 24.13 days post-burst. Using the stacked GROND images, the coordinates of this galaxy are R.A., Dec. (J2000) = , , which is off from the position of the optical afterglow. Assuming a cosmological model with km s-1 Mpc (Spergel et al. Spergel2003 (2003)), for a redshift of 1.8 the offset of the optical transient from the center of its likely host galaxy is kpc.
Assuming a power-law spectrum for the putative host galaxy of the form , its absolute -band magnitude is , where mag is the distance modulus and is the cosmological -correction, ). Hence, , which for =0.45, as it follows from the third epoch GROND data, makes this galaxy approximately 0.5 mag more luminous than the characteristic magnitude of the Schechter function describing the -band luminosity function of galaxies in the Las Campanas redshift survey (Lin et al. 1996). Its -band magnitude matches well into the distribution of host magnitudes of long bursts at this redshift (Guziy et al. 2005; Savaglio et al. 2008).
As mentioned in §3.1 and 3.2, based on the light curve alone we cannot unambiguously decide whether the data belong to the pre-jet break phase or to the post-jet break phase. However, using the standard relations (e.g., Sari et al. 1999), the data favors an isotropic model and a wind environment with, at =1 day, the position of the cooling frequency in between the optical/NIR and the X-ray band (Tab. 2). The difference of the spectral slopes between both bands is , which has to be compared to the theoretical value of . Unfortunately, the non-detection of the afterglow at 86 GHz does not constrain the shape of the SED further.
4 Summary and conclusions
To our knowledge, GRB 080514B is the first gamma-ray burst detected above 30 MeV for which an afterglow has been found in the X-ray band and in the optical/NIR bands. Based on our ground-based follow-up observing campaign, in combination with Swift UVOT and Swift XRT data starting 0.4 days after the burst, we find: (1) The X-ray/optical/NIR light curve after 0.4 days is well described by a single power-law with no sign of a jet break. (2) The SED of the afterglow indicates strong Lyman blanketing at short wavelengths, implying a photometric redshift of . This is the first redshift determination for a GRB with prompt emission detected beyond 30 MeV. We find no evidence for extinction by dust in the GRB host galaxy. (3) A comparison of the observed light curve decay with the spectral energy distribution favours a model in which the afterglow blast wave propagated in a wind medium. (4) The intrinsic properties of the optical afterglow are typical for other long-duration GRBs. (5) The putative GRB host galaxy, identified in our GROND and Keck images, has and an absolute -band magnitude of . (6) The optical transient was offset from the center of its host by kpc.
We conclude that according to our data set the afterglow properties as well as the properties of the host galaxy match into what is known about the corresponding properties of the long burst sample. The only property that make this burst remarkable is its detection above 30 MeV.
Acknowledgements.
A.R., P.F., D.A.K. and S.K. acknowledge support by DFG Kl 766/11-3 and 13-1. R.F. and S.S. were supported by the Thüringer Landessternwarte Tautenburg. T.K acknowledges support by the DFG cluster of excellence ’Origin and Structure of the Universe’. J.P.U.F. acknowledges support by the DNRF and J. Gorosabel by the programmes ESP2005-07714-C03-03 and AYA2007-63677. We acknowledge D. Malesani for a careful reading of the manuscript, P. E. Nissen and W. J. Schuster for performing the NOT observations as well as Caroline Pereira, A. Pimienta, E. Curras and C. Pereira for performing the IAC80 observations. This work made use of data supplied by the UK Swift Science Data Centre at the University of Leicester.References
- (1) Avni Y., 1976, ApJ, 210, 642
- (2) Bolzonella, M., Miralles, J.-M., Pelló, R. 2000, A&A, 363, 476
- (3) Dingus, B. 1995, Ap&SS, 231, 187
- (4) Evans, P. A., Beardmore, A. P., Page, K. L., et al. 2007, A&A, 469, 379
- (5) de Ugarte Postigo, A., Castro-Tirado, A., Gorosabel, J., et al. 2008a, GCN 7719
- (6) de Ugarte Postigo, A., Castro-Tirado, A., Gorosabel, J., et al. 2008b, GCN 7720
- (7) Gendre, A., Galli, A., & Boër, M. 2008, GCN 7730
- (8) Giuliani, A., Fornari, F., Mereghetti, S., et al. 2008a, GCN 7716
- (9) Giuliani, A., Mereghetti, S., Fornari, F., et al. 2008b, A&A, submitted
- (10) Greiner, J., Bornemann, W., Clemens, C., et al. 2007, The Messenger, 130, 12
- (11) Greiner, J., Bornemann, W., Clemens, C., et al. 2008, PASP, 120, 405
- (12) Guilloteau, S., Delannoy, J., Downes, D., et al. 1992, A&A, 262, 624
- (13) Guziy, S., Gorosabel, J., Castro-Tirado, A., J. et al. 2005, A&A 441, 975
- (14) Holland, S., T., 2008, GCN 7759
- (15) Hoover, A. S., Kippen, R. M. & McConnell, M. L. 2005, Nuovo Cim. 28 C, No. 4-5, 825
- (16) Hurley, K., Mitrofanov, I., Kozyrev, A., et al. 2006, ApJS, 164, 124
- (17) Kalberla, P. M. W., Burton, W. B., Hartmann, D., et al. 2005, A&A, 440, 775
- (18) Kaneko, Y., Preece, R. D., Briggs, M. S., et al. 2006, ApJS, 166, 298
- (19) Kaneko, Y., Gonzáles, M. M., Preece, R. D., et al. 2008, ApJ, 677, 1168
- (20) Kann, D. A., Klose, S., Zeh, A., et al. 2006, ApJ, 641, 993
- (21) Kann, D. A., Klose, S., Zhang, B., et al. 2008, ApJ, submitted (arXiv:0712:2186)
- (22) Lin, H., Kirshner, R. P., Shectman, S. A., et al. 1996, ApJ, 464, 60
- (23) Malesani, D., Nissen, P., E., Schuster, W., J., et al. 2008, GCN 7734
- (24) Monet, D. G., Levine, S. E., Canzian, B., et al. 2003, AJ, 125, 984
- (25) Nousek, J. A., Kouveliotou, C., Grupe, D., et al. 2006, ApJ, 642, 389
- (26) O’Brien, P. T., Willingale, R., Osborne, J., et al. 2006, ApJ, 647, 1213
- (27) Page, K. L., Beardmore, A. P., Mereghetti, S., et al. 2008, GCN 7723
- (28) Pélangeon, A. & Atteia, J.-L. 2008, GCN 7760
- (29) Perley, D. A., Bloom, J. S., Chen, H.-W., et al. 2008, GCN 7874
- (30) Poole, T. S., Breeveld, A. A., Page, M. J., et al. 2008, MNRAS, 383, 627
- (31) Preece, R. D., Briggs, M. S., Mallozzi, R. S., et al. 2000, ApJS, 126, 19
- (32) Rapisarda, M., Costa, E., Del Monte, E., et al. 2008, GCN 7715
- (33) Rossi, A., Küpcü Yoldaş, A., Greiner J., et al. 2008a, GCN 7722
- (34) Rossi, A., Küpcü Yoldaş, A., Greiner J., et al. 2008b, GCN 7724
- (35) Schlegel, D., Finkbeiner, D. P., & Davis, M. 1998, ApJ, 500, 525
- (36) Sari, R., Piran, T., & Halpern, J. P. 1999, ApJ, 519, L17
- (37) Savaglio, S. Glazebrook, K., Le Borgne, D., 2008, (arXiv:0803.2718v1)
- (38) Schady, P., Mason, K. O., Page, M. J, .et al. 2007, MNRAS, 377, 273
- (39) Spergel, D. N., Verde, L., Peiris, H. V., et al. 2003, ApJS, 148, 175
- (40) Starling, R. L. C., Wijers, R. A. M. J., Wiersema, K., et al. 2007, ApJ, 661, 787
- (41) Tavani, M., Barbiellini, G., Argan, A., et al. 2008, (arXiv:0807.4254)
- (42) Updike, A., C., Bryngelson, G., Hartmann, D., H. 2008a, GCN 7725
- (43) Updike, A., C., Bryngelson, G., Hartmann, D., H. 2008b, GCN 7745
- (44) Wilms, J., Allen, A., & McCray, R. 2000, ApJ, 542, 914
- (45) Zeh, A., Klose, S., & Kann, D. A. 2006, ApJ, 637, 889