Dynamics of drying in 3D porous media
Abstract
The drying dynamics in three dimensional porous media are studied with confocal microscopy. We observe abrupt air invasions in size from single particle to hundreds of particles. We show that these result from the strong flow from menisci in large pores to menisci in small pores during drying. This flow causes air invasions to start in large menisci and subsequently spread throughout the entire system. We measure the size and structure of the air invasions and show that they are in accord with invasion percolation. By varying the particle size and contact angle we unambiguously demonstrate that capillary pressure dominates the drying process.
pacs:
47.56.+r, 47.57.-s, 47.55.CaDrying is a ubiquitous natural process; it is of particular importance and interest for porous media where there are many important applications, including soil drying in agriculture, recovery of volatile hydrocarbons from underground oil reservoirs, spray drying in food and pharmaceutical industries, and drying of paint and ceramic powders. Drying in porous media is often described theoretically by invasion percolation(IP)Wilkinson ; Page ; Shaw ; Prat and modeled by immiscible displacement experiments in 2DTsimpanogiannis . However, despite its great importance, direct imaging of drying in three dimensional(3D) porous media is rare, largely due to the difficulty of visualization in 3D porous media. Instead, indirect measurements such as light scattering and acoustic methodsPage , conductance measurementThompson , or pressure measurementKnut ; Furuberg ; Aker have been used. While valuable information is deduced with these techniques, many important dynamical features of drying, such as the flow pattern, the structure of the abrupt bursts and the liquid redistribution, remain poorly characterized. To study them, the critical investigation by direct imaging is indispensable.
In this paper, we study drying dynamics in 3D porous media by direct imaging with confocal microscopy. We observe a strong flow from the menisci in large pores to the menisci in small pores during drying. The flow causes abrupt air invasions starting from large menisci which subsequently spread throughout the entire system. The size, structure and dynamics of these invasions are explained by 3D invasion percolation coupled with liquid redistributionKnut ; Furuberg . The liquid redistribution is confirmed by direct observation. By varying the particle size and contact angle we also demonstrate unambiguously that capillary pressure dominates the drying process.
Porous media are prepared by evaporating a high concentration colloidal suspension, composed of fluorescently labeled PMMA particles(density and index of refraction ) suspended in decalin(). The particles and solvent are closely index matched, allowing 3D visualization through more than one hundred particle layers using confocal microscopy. Samples are dried on clean glass substrates with the initial volume fractions between and .
The overall drying process is demonstrated by evaporating a drop of suspension() with particle size . The drying is divided into two stages: The suspension is initially compacted as decalin evaporates and the colloid volume fraction increases. Due to the coffee-ring effect Deegan , the suspension compacts at the droplet edge with the randomly-close-packed particles, creating a network of pores. Images of horizontal(xy) and vertical(xz) cross sections taken at the interface between the packed region and free suspension are shown in Fig.1(b). Particles can not move once they are in the packed region. Interestingly, the xz section indicates that the packed region forms a “ceiling” on the top of the droplet due to the lowering of the air-liquid interface from evaporation. As solvent evaporates, the dense region at the edge grows towards the center and eventually fills the entire system (Fig.1(a), top three images). In the second stage, air invades the system. Cracks appear first, indicating large stresses in the system, then air continues to invade the network of pores until all the liquid is evaporated(bottom three images). It is the second stage which is the focus of this study.
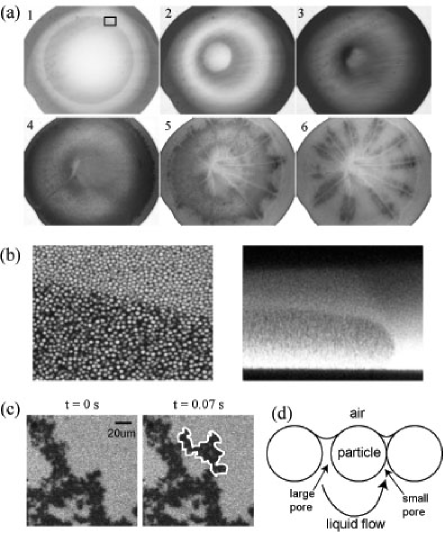
This second stage is characterized by a series of abrupt air invasions, or burstsHaines ; Morrow ; Knut ; Furuberg ; Aker . A typical burst is identified with confocal microscopy by a bright area suddenly turning black, corresponding to the displacement of decalin by air, which is optically mismatched, as illustrated by the highlighted area in Fig.1(c). In a single step, within 0.07s, an area of about 800 particle area is invaded. This abrupt behavior indicates that some large stress is driving the process.
The dominant stress during drying is the capillary pressure from the tiny menisciDufresne :
| (1) |
where is the surface tension coefficient, is the solvent-particle contact angle and is the radius of curvature which is typically for randomly close packed spheres of radius . Since and , Eq.(1) gives an enormous pressure: for particles! Relative to the ambient pressure surrounding the droplet, , the liquid within the pores has a very low pressure: . Therefore every meniscus acts like a low pressure pump trying to suck liquid from other places. Due to the inhomogeneity of the pore sizes, the menisci in small pores can produce lower pressure and draws liquid from menisci in large pores, as illustrated by the cartoon in Fig.1(d). We emphasize that this flow is quite different from the capillary flow in the coffee-ring problem, wherein the faster evaporation rate at the droplet edge leads to bulk flow outwards from the center to the edge. This flow would move the air-liquid interface rapidly through the large pores, creating bursts. The bursting process will terminate either when all the pores are small enough to balance the capillary pressure or when the displaced liquid flows to the nearby menisci and reduces the capillary pressure. Previous research in 2D systems proposed that the later mechanism results in an exponential cut-off of burst sizeKnut ; Furuberg .
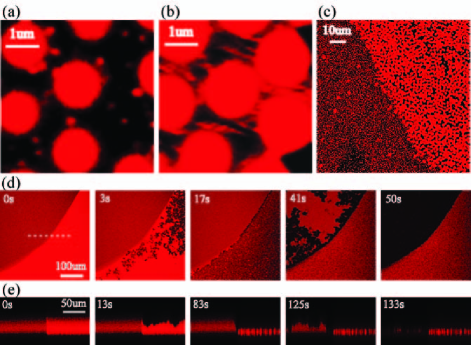
To visualize this flow, we add a small quantity of tiny tracer particles() to a suspension of larger spheres with , as shown in Fig.2(a). The tracer particles are small enough to move freely through the pores. During the compaction stage, the tracer particles move randomlyfootnote1 . However, upon entering the invasion stage, a strong flow appears, as shown in Fig.2(b). The flow velocity and direction vary with time and location, with the magnitude measured from to . The flow is not from center towards edge, thus we exclude the possibility of the “coffee-ring” effect. This provides direct evidence of the flow in Fig.1(d).
To confirm that the flow is indeed from large to small menisci, we prepare samples comprised of two distinct domains of differing particle diameters (d=1.1 and 2 um), illustrated in Fig.2(c). Various times in the drying process at the boundary of the two domains are highlighted by the xy sections shown in Fig.2(d). The large-pore domain (right) is invaded first, proving that air invasions start in large pores. Strikingly, fluid displacements are restricted to the large-pore domain until it has been completely invaded. Since evaporation occurs everywhere, the only way to halt air invasions at the boundary between the domains is to cause a macroscopic flow from the large-pore to the small-pore domain to compensate for evaporation. The large-pore domain effectively serves as a liquid reservoir which prevents drying of the small-pore domain until the reservoir is completely exhausted. A similar process in the xz direction is shown in Fig.2(e). This phenomenon is further proof confirming the flow pattern from large to small menisci shown in Fig.1(d). Moreover, it provides a means to precisely control the order of drying. It also illustrates a method to spontaneously concentrate material to small-pore regions through drying.
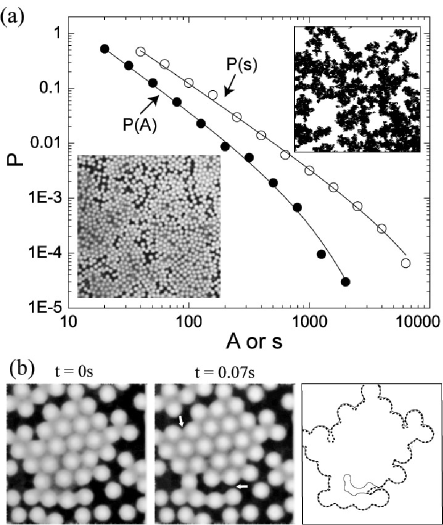
The flow evacuates the liquid from large pores and leads to abrupt bursts. The sequence of bursts has been studied indirectly through the associated pressure changes in similar systemsKnut ; Furuberg ; however, there has been no structural characterization of these events. We directly visualize these bursts by horizontally scanning a fixed area over time. The horizontal scanning requires drying to proceed horizontally as well. We achieve this by drying the sample between two parallel substrates. We coat both substrates with a layer of PMMA to match the wetting property with the bulk particles. Since the invaded air strongly scatters the light, we restrict our measurements to regions near the bottom substrate, where the measurement is most reliable. Images are acquired at frames per second, and the burst areas are measured by subtracting two adjacent frames (see fig 1(c)). More than 600 bursts in a single drying process are measured to obtain good statistics. We find that the area of the bursts ranges from a single particle to hundreds of particles. The probability of a burst, , as a function of its area, , exhibits a power-law distribution for small areas but rapidly decreases for large areas as shown by the log-log plot() in the main panel of Fig.3(a). The power-law distribution is in accord with the invasion percolation and the deviation at large areas reflects the fact that, during the bursts, liquid does not have time to evaporate but instead gets redistributed among the menisci. This redistribution decreases the capillary pressure and prevents the bursts from growing too large. The functional form Knut ; Furuberg , accounts for both the power-law behavior of invasion percolation and the exponential decay due to redistribution of the liquid and fits the data well as shown by the solid line in Fig.3. We obtain and .
The exponent differs from previous work which found Knut ; Furuberg . However, this was for a 2D network of pores whereas our system is roughly one hundred particle layers in thickness and thus more nearly 3D. We examine the freshly invaded regionsfootnote2 at single particle level and find a complex structure, as shown in the lower inset of Fig.3(a). Instead of being completely filled by air, only of the invaded region is filled by air. This value agrees with 3D bond percolation thresholds, Stauffer . Scans at different heights also show that the invaded region is a 3D connected network of air. These results suggest that each burst is a 3D invasion percolation event. Therefore we compute the true 3D size of a burst, , from the 2D area, A: , with the fractal dimension of 3D percolation. We plot in the main panel as open symbols() and fit the data with: , and obtain , . Theoretical work showed that the power is related to percolation exponentsRobbins1 : . This relation predicts in 3D and in 2D. Our data are in excellent accord with the 3D result.
The sequence of bursts quickly spreads throughout the field of view and forms a macroscopic pattern, as shown in the picture taken at the moment when invasions first percolate the field of view() in the upper inset of Fig.3(a). The pattern is fractal-like and similar to previous experimentShaw . However, from the magnified image in lower inset, we determine that the black region is not completely filled by air, but instead formes 3D percolated networks of air.
We can also directly determine the origin for the exponential cut-off: the liquid redistribution. In two frames separated by , we catch a single burst and the subsequent liquid redistribution. The two frames are shown in the two pictures of Fig.3(b) on the left. The first picture is before the burst while the second is after. The burst occurs at the spot indicated by the lower arrow and an obvious meniscus re-adjustment occurs at the spot indicated by the upper arrow. More careful comparison is done in the third picture of Fig.3(b), where we trace the air-liquid interfaces of the first two pictures. The dotted line is the interface before the burst while the solid line is after. There are meniscus re-adjustments in several places. These re-adjustments reduce the capillary pressure and lead to the exponential cut-off, . This observation provides unambiguous evidence for the redistribution argument proposed by previous indirect measurementsKnut ; Furuberg .
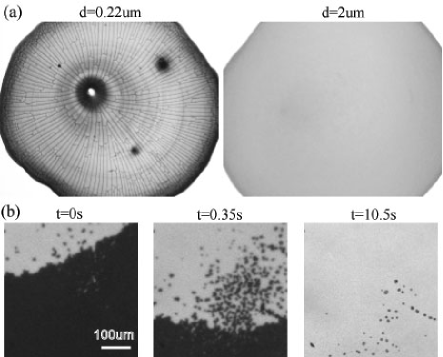
We also vary both the pore size and the contact angle, to further validate the prediction of Eq.(1). The effect of pore size is demonstrated by comparing two completely dried samples with particles of (left) and (right) in Fig.4(a). The beautiful crack pattern in the sample indicates large stresses during drying, while the absence of cracks in the sample suggests that the stresses are much lower; This is consistent with Eq.(1). We vary the contact angle of the invading fluid by studying the re-hydration of a dried sample. We see a marked difference in re-hydration: the liquid-air interface sweeps the whole field of view in a smooth and continuous manner, in sharp contrast with the fractal pattern of drying in Fig.3(a). This demonstrates the important effect of , as predicted in Eq.(1). This result is in great agreement with a previous simulation, which explained the smooth interface by the cooperative activity of neighboring menisciRobbins2 ; Robbins3 .
By using direct imaging, we show that drying of a 3D porous media can be well described by invasion percolation provided the effects of liquid redistribution are included; which leads to an exponential cut-off of the power-law distribution of abrupt invasions. The liquid redistribution is directly observed, verifying the important feature that had heretofore only been deduced by indirect methods. Our study reveals the flow pattern of drying which may ultimately afford a means to control drying in porous media. A deep understanding of drying may provide a means to help eliminate cracking or other undesirable effects.
This work was supported by ICI with partial support from the NSF(DMR-0602684) and the Harvard MRSEC(DMR-0213805). We thank Mark Robbins for helpful discussions.
References
- (1) D. Wilkinson and J. F. Willemsen, J. Phys. A 16, 3365 (1983).
- (2) J. H. Page et al, Phys. Rev. Lett. 71, 1216 (1993).
- (3) T. M. Shaw, Phys. Rev. Lett., 59, 1671 (1987).
- (4) M. Prat, Inter. Journal of Multiphase Flow, 19, 691 (1993).
- (5) I. N. Tsimpanogiannis and Y. C. Yortsos, Phys. Rev. E, 59, 4353 (1999).
- (6) A. H. Thompson, A. J. Katz and R. A. Raschke, Phys. Rev. Lett., 58, 29 (1987).
- (7) K. J. Måløy, L. Furuberg, J. Feder and T. Jøssang, Phys. Rev. Lett., 68, 2161 (1992).
- (8) L. Furuberg, K. J. Måløy and J. Feder, Phys. Rev. E, 53, 966 (1996).
- (9) E. Aker et al, Europhys. Lett., 51, 55 (2000).
- (10) R. D. Deegan et al, Nature 389, 827 (1997).
- (11) W. B. Haines, J. Agr. Sci., 20, 97 (1930).
- (12) N. R. Morrow, Ind. Eng. Chem., 62, 32 (1970).
- (13) E. R. Dufresneet al , Phys. Rev. Lett., 91, 224501 (2003).
- (14) There is a weak ”coffee ring” flow as well, but its magnitude is negligible compared with thermal motion.
- (15) The result is only valid for freshly invaded region because the fraction of liquid decreases with evaporation.
- (16) D. Stauffer, Introduction to Percolation Theory, (Taylor and Francis, London, 1985).
- (17) N. Martys, M. O. Robbins and M. Cieplak, Phys. Rev. B, 44, 12294 (1991).
- (18) M. Cieplak and M. O. Robbins, Phys. Rev. Lett, 60, 2042 (1988).
- (19) M. Cieplak and M. O. Robbins, Phys. Rev. B, 41, 11508 (1990).