The Rise and Fall of Galaxy Activity in Dark Matter Haloes
Abstract
We use the catalogue of galaxy groups constructed from the Sloan Digital Sky Survey (SDSS DR4) by Yang et al. (2007) to study the dependence of galaxy activity on stellar mass, , halo mass, and group hierarchy (central vs satellite galaxies). The wealth of data provided by the SDSS allows us to split the sample on the basis of galaxy activity in star-forming galaxies, galaxies with optical AGN activity, composite galaxies (both star formation and optical AGN activity) and radio sources. We find a smooth transition in halo mass as the activity of central galaxies changes from star formation to optical AGN activity to radio emission. Star-forming centrals preferentially reside in haloes with , central galaxies with optical-AGN activity typically inhabit haloes with , and centrals emitting in the radio mainly reside in haloes more massive than . Although this seems to suggest that the environment (halo mass) determines the type of activity of its central galaxy, we find a similar trend with stellar mass: central star formers typically have stellar masses less than , while optical-AGN hosts and central radio sources have characteristic stellar masses of and , respectively. Since more massive haloes typically host more massive centrals, it is unclear whether the activity of a central galaxy is causally connected to its stellar mass or to its halo mass. In general, satellite galaxies have their activity suppressed with respect to central galaxies of the same stellar mass. This holds not only for star formation activity, but also for AGN activity in the optical and the radio. At fixed stellar mass, we find that the activity of satellite galaxies depends only weakly on halo mass. In fact, using a set of reduced conditional probability functions, we find that for satellite galaxies the dependence of galaxy activity on halo mass is more than four times weaker than the dependence on stellar mass. We also investigate whether the strength of galaxy activity is influenced by the environment, using the specific luminosities in H, [OIII] and at 1.4 GHz. We find that the specific luminosity of star-forming and optical-AGN centrals systematically decreases with increasing halo mass, while the specific luminosity of centrals with high radio activity increases with halo mass. Independently of the activity class, the specific luminosity of satellite galaxies does not significantly vary with halo mass. All these results are consistent with a picture in which low mass haloes accrete cold gas, while massive haloes have coronae of hot gas that promote radio activity of their central galaxies.
keywords:
galaxies: active – galaxies: clusters: general – cosmology: dark matter – radio lines: galaxies.1 Introduction
Ever since the seminal work of Hubble (1926), it is known that the local galaxy population consists of two main branches: the red sequence populated by bulge-dominated galaxies with old stellar populations (early-type galaxies), and the blue cloud comprising disk galaxies with some level of star-formation activity (late-type galaxies). With the help of large galaxy redshift surveys, such as the Sloan Digital Sky Survey (SDSS; York et al. 2000; Stoughton et al. 2002), this bimodality has been dramatically confirmed (e.g., Blanton et al. 2003; Strateva et al. 2001). This bimodality is tightly linked to environment, with early-types preferentially residing in dense environments such as galaxy clusters, while late-types mainly populate low-density structures such as galaxy groups and the more generic field (e.g., Dressler 1980; Postman & Geller 1984; Lewis et al. 2002; Goto et al. 2003; Kauffmann et al. 2004; Hogg et al. 2004; Weinmann et al. 2006).
In the current paradigm of galaxy formation, it is believed that virtually all galaxies initially form as late-type disk galaxies due to the cooling of gas with non-zero angular momentum in virialized dark matter haloes (e.g., White & Frenk 1991). During their subsequent evolution, disk galaxies may be transformed into early-types via a variety of transformation mechanisms. Probably the most important of these is major mergers, in which two disk galaxies of roughly equal mass merge to produce a spheroidal galaxy (Toomre & Toomre 1972; Negroponte & White 1983). During such a merger the gas looses its angular momentum and accumulates at the center where it can trigger an intense starburst and fuel the central black hole (e.g., Hernquist 1989; Mihos & Hernquist 1996). This not only couples the growth of the central black hole to that of its host galaxy, which may explain the observed - relation (Gebhardt et al. 2000; Ferrarese & Merritt 2000), but it may also quench subsequent star formation by exhausting the gas supply and by expelling or heating the cold gas via AGN activity (e.g., Menci et al. 2005; Springel, Di Matteo & Hernquist 2005; Hopkins et al. 2006). In addition to this so-called quasar mode of AGN feedback, one also considers the so-called radio mode, in which the radio activity associated with a low accretion efficiency of the central black hole provides a heating term that can offset the cooling, therewith preventing any new gas from cooling and forming stars. It has been suggested that this radio-mode feedback plays a crucial role in explaining why the most massive galaxies are red and dead (e.g., Bower et al. 2006; Croton et al. 2006; Cattaneo et al. 2006; Kang, Jing & Silk 2006; Nusser, Silk & Babul 2006; Sijacki & Springel 2006). The inclusion of AGN feedback (radio mode and/or quasar mode) allows models of galaxy formation to reproduce the bright end of the observed luminosity function. In order to reproduce the faint end of the luminosity function, the models typically invoke supernova feedback to expel gas from low mass haloes (e.g., Larson 1974; White & Rees 1978; Dekel & Silk 1986).
Clearly, star formation and AGN activity are thought to play a pivotal role in the formation and evolution of galaxies. An important, largely outstanding question, is how this activity is influenced by the galaxy’s environment. Such a link will put strong constraints on the mechanisms responsible for triggering and quenching such activity. For example, if AGN were to be fueled by the same cold gas that feeds star formation in disk galaxies, their environmental dependence would most probably follow the one of star-forming galaxies, i.e. the fraction of AGN would decrease in denser environments. Alternatively, if the AGN activity were maintained by galaxy-galaxy interactions, it would be preferentially associated with intermediate mass groups with low velocity dispersions or with young clusters that are not yet virialized (e.g., Gunn 1979; Shlosman et al. 1990).
The existence, in the local Universe, of a star-formation rate - density relation is well established by now. Hashimoto et al. (1998) measured the environment in terms of local density, which is based on the distance of a galaxy to its third nearest neighbor. They found a continuous correlation between star-formation rate (SFR) and local density, whereby galaxies with a higher SFR reside preferentially in lower density environments. In addition, the authors showed that low levels of star formation depend more strongly on the local density within a cluster than in the field, while high SFRs (which they identified as starbursts) are less sensitive to local density in both clusters and the field. This suggest that two processes determine the SFR - density relation: gas removal via stripping, responsible for the low SFRs of galaxies in dense environments, and galaxy-galaxy interactions, causing the prevalence of starbursts in intermediate-density environments. Similar results were obtained by Carter et al. (2001) and Gómez et al. (2003) who found that the fraction of star-forming galaxies decreases with increasing galaxy density (derived from the distance of a galaxy to its 10th nearest neighbor). In particular, Lewis et al. (2002) and Gómez et al. found a break in this trend at a critical density of 1 h-2 Mpc2, below which the fraction of star-forming galaxies is high and constant and above which it drops rapidly. The authors also found that the SFR increases with the cluster-centric radius, to reach the SFR typically measured in the field at radii larger than 3 - 4 times the cluster virial radius. They concluded that this trend can not be explained by the morphology - density relation alone, against the intuitive interpretation of the SFR - density relation as a direct product of the environmental dependence of galaxy morphology. Kauffmann et al. (2004) found a decrease in the specific star-formation rate (i.e SFR/M∗) of a factor of 10 between low- and high-density environments. More recently, Weinmann et al. (2006), using a catalogue of galaxy groups from the Sloan Digital Sky Survey (SDSS DR2), have been able to quantify the galaxy environment in terms of halo mass, i.e. the mass of the dark-matter halo hosting a galaxy group. The authors have shown that the fraction of late-type galaxies (actively forming stars) smoothly increases with decreasing halo mass, down to 1012 M⊙. For any given halo mass, this same fraction increases with the halo-centric radius.
As for AGN, a number of studies in the literature have found a constant fraction of optical AGN at low redshift across a wide range of environments, from the field to galaxy clusters (Monaco et al. 1994; Coziol et al. 1998; Shimada et al. 2000; Schmitt 2001; Gómez et al. 2003; Miller et al. 2003). Kauffmann et al. (2004) obtained rather opposite results, indicating that the fraction (at fixed stellar mass) of AGN with strong [OIII] emission doubles in low-density environments with respect to the denser ones. In their study, environment is primarily based on the number of neighboring galaxies, but a comparison with cosmological simulations allowed the authors to assign to the lowest/highest local densities a characteristic halo mass of 1012 - 1013 M⊙ and 1014 - 1015 M⊙, respectively.
A different approach to studying the environment dependence of optical AGN activity has been used by Wake et al. (2004), Croom et al. (2005) and Li et al. (2006), who measured the cross-correlation between optical AGN and a reference sample of inactive galaxies. The authors agree that optical AGN and the control sample share the same clustering amplitude on scales larger than a few Mpc. In the range between 100 kpc and 1 Mpc, however, optical AGN are clustered more weakly than the control galaxies, while for scales smaller than 70 kpc there is a weak indication for optical AGN to cluster more strongly than inactive galaxies. Using N-body simulations, Li et al. reveal that the AGN anti-bias measured between 100 kpc and 1 Mpc is possibly due to AGN residing preferentially at the center of their dark-matter haloes. In addition, the fraction of optical AGN located in 1012 - 1013 M⊙ haloes is found to be larger than that in haloes as massive as 1014 - 1015 M⊙.
Based on their [OIII] luminosity, optical AGN are often divided in LINERs and Seyferts, where the latter have higher [OIII] luminosities and accretion rates (e.g., Kewley et al. 2006). Kelm et al. (2004) and Constantin & Vogeley (2006) have shown that LINERs are more strongly clustered than Seyferts. This trend is consistent with the morphology-density relation, given that LINERs are generally hosted by more massive galaxies (cf. Kewley et al. 2006). However, Constantin et al. (2007) found that LINERs associated with moderately massive host galaxies ( 3 1010 M⊙) appear to be more common in voids (the most underdense environments in the Universe) than in walls, although their accretion rates and old stellar populations are comparable to their wall counterparts. Void AGN hosted by more massive galaxies seem, instead, to accrete more strongly and to have younger stellar populations than those in walls. These trends would thus suggest that the AGN activity in voids is tightly connected with the availability of fuel, the same fuel that supports the star-formation activity of their host galaxies.
On the basis of their radio activity, AGN are commonly distinguished between radio-quiet and radio-loud. These two groups are known to exhibit different clustering properties, which are also different from those of optical AGN. For example, Yee & Green (1984) and Ellingson et al. (1991) found that radio-loud AGN are located in galaxy clusters as rich as Abell class 0/1, possibly reflecting the picture where radio-loud AGN reside in elliptical galaxies, while radio-quiet AGN are mostly associated with disk galaxies. On the contrary, McLure & Dunlop (2001) found that the clustering amplitudes of radio-quiet and radio-loud AGN are rather similar, and both groups of radio AGN are detected in environments as rich as Abell class 0. Later on, Prestage & Peacock (1988), Hill & Lilly (1991), Miller et al. (2002) and Best (2004) claimed that radio-loud AGN appear to favor galaxy groups and weak clusters and to avoid the densest environments unless they are hosted by the central cluster galaxy. A more in-depth analysis by Best (2004) has shown that the fraction of radio-loud AGN with absorption lines (in their optical spectra) increases in denser environments while the fraction of radio-loud AGN with emission lines decreases. Significantly larger samples of radio AGN such as those drawn from the SDSS survey have confirmed the early results obtained by Best (2004) and have indicated that radio-loud AGN are more likely hosted by the brightest group or cluster galaxies (Best et al. 2005a, 2007; Kauffmann, Heckman & Best 2008).
In the studies mentioned above, the environment is usually parameterized in terms of a projected number density of galaxies, above a given magnitude limit. Typically this number density, indicated by , is measured using the projected distance to the th nearest neighbor, with typically in the range 5-10. However, as discussed in Weinmann et al. (2006), the physical interpretation of itself depends on environment: in clusters, where the number of galaxies is much larger than , measures a local number density, which is a sub-property of the cluster (i.e., is strongly correlated with cluster-centric radius). In low-density environments, which are populated by haloes which typically contain only one or two galaxies, measures a much more global density, covering a scale that is much larger than the halo in which the galaxy resides. This ambiguous, physical meaning of severely complicates a proper interpretation of the various correlations between environment and galaxy properties. Furthermore, this environment indicator can not distinguish between central and satellite galaxies. This is important, since models of galaxy formation and evolution predict that these two types of galaxies interact with their host haloes in very different ways: while central galaxies can accrete halo gas that cools, and may drive subsequent star formation and/or AGN activity, satellite galaxies are subjected to various processes such as strangulation, ram-pressure stripping and galaxy harassment (Bower 2006; Croton et al. 2006; Kang, Jing & Silk 2006; Hopkins et al. 2006; Larson, Tinsley & Caldwell 1980; Balogh, Navarro & Morris 2000; Gunn & Gott 1972; Farouki & Shapiro 1981; Moore et al. 1996).
In this paper, we re-visit the environmental dependence of galaxy activity (star formation, optical AGN activity and radio emission), using a large galaxy-group catalogue constructed from the SDSS. This catalogue allows us to parameterize the environment in terms of the halo mass in which each galaxy resides and to split the galaxy population in centrals and satellites, thus allowing for a more straightforward comparison with galaxy formation models. In particular, the observational results presented here place important constraints on the various mechanisms responsible for triggering and quenching different sort of activity in central and satellites galaxies. Throughout this paper we adopt a flat CDM cosmology with and (Spergel et al. 2007) and we express units that depend on the Hubble constant in terms of .
2 Data
The analysis presented in this paper is based on the SDSS DR4 galaxy group catalogue of Yang et al. (2007; hereafter Y07). This group catalogue is constructed applying the halo-based group finder of Yang et al. (2005a) to the New York University Value-Added Galaxy Catalogue (NYU-VAGC; see Blanton et al. 2005), which is based on SDSS DR4 (Adelman-McCarthy et al. 2006). From this catalogue Y07 selected all galaxies in the Main Galaxy Sample with an extinction corrected apparent magnitude brighter than , with redshifts in the range and with a redshift completeness . This sample of galaxies is used to construct three group samples: Sample I, which only uses the galaxies with measured redshifts from the SDSS, Sample II which also includes galaxies with SDSS photometry but with redshifts taken from alternative surveys, and Sample III which includes an additional galaxies that lack a redshift due to fiber-collisions, but which have been assigned the redshift of their nearest neighbor (cf. Zehavi et al. 2002). Since the assignment of optical activity to the galaxies (see below) requires SDSS spectra, the present analysis is based on Sample I.
The magnitudes and colours of all galaxies are based on the standard SDSS Petrosian technique (Petrosian 1976; Strauss et al. 2002), have been corrected for galactic extinction (Schlegel, Finkbeiner & Davis 1998), and have been -corrected and evolution corrected to , using the method described in Blanton et al. (2003). We use the notation to indicate the resulting absolute magnitudes in the -band. Stellar masses for all galaxies, denoted by , are computed using the relations between stellar mass-to-light ratio and colour of Bell et al. (2003; see Y07 for details).
As described in Y07, the majority of the groups in our catalogue have two estimates of their dark matter halo mass : one based on the ranking of its total characteristic luminosity, and the other based on the ranking of its total characteristic stellar mass. As shown in Y07, both halo masses agree very well with each other, with an average scatter that decreases from dex at the low mass end to dex at the massive end. In addition, detailed tests with mock galaxy redshift catalogues have demonstrated that these group masses are more reliable than those based on the velocity dispersion of the group members (Yang et al. 2005b; Weinmann et al. 2006; Y07). In this paper we adopt the group masses based on the stellar mass ranking111We have verified, though, that none of our results changes significantly if we adopt the luminosity-rank based masses instead.. These masses are available for a total of groups in our sample, which host a total of galaxies that constitute the sample of galaxies that we use for our analysis described below.
Note that this is not a volume-limited sample. Consequently, the sample suffers from Malmquist bias, causing an artificial increase of the average luminosity (and also stellar mass) of the galaxies with increasing redshift. To correct for this bias, we weight each galaxy by , where is the comoving volume of the Universe out to a comoving distance at which the galaxy would still have made the selection criteria of our sample. In what follows all distributions are weighted by , unless specifically stated otherwise.
Using the group catalogue, we split our sample into “centrals”, which are defined as the most massive group members in terms of their stellar mass, and “satellites”, which are those group members that are not centrals. In what follows, we refer to this distinction between centrals and satellites as the “group hierarchy”. Finally, for each group member we determine the projected radius from the luminosity weighted group center using the angular separation and the angular diameter distance at the redshift of the group. We normalize these projected radii by the characteristic radius of the group, , which is defined as the radius inside of which the dark matter halo associated with the group has an average overdensity of . This radius is computed from the mass and redshift of the group using equation (5) in Y07.

2.1 Optical Activity
In order to assign the galaxies in our sample to one of four classes of optical activity, we match the galaxies in our sample with the catalogue of emission-line fluxes constructed by Kauffmann et al. (2003b). These authors measured various nebular fluxes from the SDSS spectra corrected for Galactic extinction after subtraction of the stellar absorption-line spectrum. The latter is fitted with model galaxy spectra computed using the stellar population code of Bruzual & Charlot (2003), and the best-fitting synthetic spectrum is subtracted from the observed spectrum. Emission-line fluxes are then corrected for the intrinsic reddening from the galaxy itself using an extinction curve of the form (Charlot & Fall 2000) and assuming the canonical flux ratio H/H = 2.86 (Case I, Osterbrock 1989).
We consider a galaxy to be ‘optically active’ if its [OIII]5007 and H emission lines are detected with a S/N ratio 3. In order to discriminate between star-formation and AGN activity, we use the line-flux ratios [OIII]5007/H and [NII]6584/H to place the galaxies in our sample on the BPT diagram (Baldwin, Philips & Terlevich 1981). This diagram is traditionally used to separate type II AGN from star-forming galaxies and composite galaxies. In the standard unified model (e.g. Antonucci 1993), AGN are classified as type I if their central black hole and its broad emission-line region are viewed directly. When, instead, the central black hole is obscured and only its narrow emission-line region is visible, AGN are labeled as type II. Since the photometry and spectra of type I AGN are dominated by non-thermal emission, they can not be used to study the properties of their host galaxies, such as stellar mass. Consequently, AGN of type I are excluded from our sample.
Fig. 1 shows the BPT diagram of the galaxies in our sample. The dashed line represents the demarcation line of pure star formation defined by Kauffmann et al. (2003b, their equation 1) and the solid line is the extreme starburst demarcation line derived by Kewley et al. (2001, their equation 5). We classify as star-forming (SF) all galaxies that in the BPT diagram lie below the pure star formation line and as type II AGN all galaxies above the extreme-starburst line. Those galaxies in between the two lines are labeled as composites (CO). The remaining galaxies in sample I that either do not satisfy our S/N requirements or do not exhibit emission lines are classified as ‘not optically active’ (NOA). The number of star-forming galaxies (SF), optical AGN and composite (CO) galaxies is listed in Table 1, where we also indicate whether they are centrals or satellites.
The label AGN comprises both Seyfert II galaxies and LINERs (the latter have a lower [OIII]5007/H at fixed [NII]6584/H). Kewley et al. (2006) have demonstrated that Seyferts of type II and LINERs form a continuous sequence, where LINERs have a lower accretion rate than Seyferts. In §4 we will use the specific [OIII] luminosity to split our sample in type II Seyferts and LINERS, but for the main part of this paper we do not discriminate between these two types of AGN.
| Centrals | Satellites | |
|---|---|---|
| ALL | 228062 | 62667 |
| SF | 51738 | 18017 |
| CO | 35174 | 7358 |
| AGN | 24273 | 4506 |
| HRA | 2595 | 390 |
| LRA | 2594 | 366 |
Notes: The numbers of centrals and satellites in our sample and in the various classes of optical and radio activity (SF=star forming, CO=composite, AGN=optical AGN activity, LRA=low radio activity, HRA=high radio activity).
2.2 Radio Activity
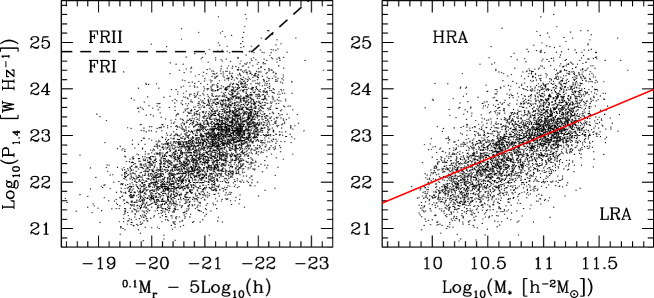
In addition to the optical activity, we also consider the radio activity of the galaxies in our sample. To that extent we match our galaxy sample with the NVSS survey (National Radio Astronomy Observatory Very Large Array Sky Survey; Condon et al. 1998) and the FIRST survey (Faint Images of the Radio Sky at Twenty centimeters; Becker et al. 1995), both conducted at a frequency of 1.4 GHz. We follow the identification procedure of Best et al. (2005b), and we refer the reader to their paper for details. Contrary to Best et al., who only selected galaxies with a flux density 5 mJy, we select all galaxies detected at 1.4 GHz, independent of their flux densities. Using the observed flux density and the SDSS redshift we derive the radio power at 1.4 GHz, , which we plot as a function of galaxy absolute magnitude in the -band in the left-hand side panel of Fig. 2. Here, the dashed lines mark the area typically populated by FRII-type objects according to Owen & White (1991). The FRI/FRII classification was first introduced by Fanaroff & Riley (1974): in FRI sources the radio emission peaks near the center of the galaxy and the emission from the jets fades with galacto-centric distance. FRII sources, on the other hand, have edge-brightened radio lobes. As is evident from Fig. 2, the population of radio galaxies in the local Universe is clearly dominated by FRI-type objects, which are typically hosted by elliptical galaxies with very little on-going star formation and weak emission lines (Ledlow & Owen 1995; Govoni et al. 2000; Best et al. 2005b). In the right-hand panel of Fig. 2 we plot of our sample galaxies as a function of their stellar mass ; the solid line indicates the locus where the specific radio power, , which coincides with the peak of the corresponding distribution (cf. Fig. 15). We split our radio galaxies in sources with low radio activity (LRA) and those with high radio activity (HRA), depending on whether is smaller or larger than , respectively. The numbers of LRA and HRA galaxies identified in our sample, and split according to centrals and satellites, are indicated in Table 1.
The optical and radio activity defined here are not mutually exclusive. In fact, it is well known that radio galaxies can also display optical activity. This overlap is summarized in Table 2, where we list the number of LRA and HRA centrals and satellites with optical activity (SF, CO or AGN) and with no optical activity (NOA). Note that the majority (75 percent) of the LRA galaxies also reveal optical activity, roughly equally split among SF, CO and AGN. However, in the case of the HRA galaxies 50 percent does not reveal any optical activity. Forty percent of HRA galaxies with optical activity are identified as AGN, while only 26 percent show evidence for ongoing star formation.
| SF | CO | AGN | NOA | |
|---|---|---|---|---|
| LRA centrals | 685 | 606 | 653 | 651 |
| LRA satellites | 149 | 91 | 79 | 71 |
| HRA centrals | 322 | 426 | 538 | 1308 |
| HRA satellites | 66 | 61 | 57 | 182 |
Notes: The numbers of LRA and HRA centrals and satellites that are also identified as star-forming galaxies (SF), composite galaxies (CO), optical AGN, or that are not optically active (NOA).
3 The Ecology of Galaxy Activity
Using the sample defined above, we now investigate how the optical and radio activity of galaxies correlate with their stellar mass and with the mass of the dark matter halo in which they reside. In addition, we also examine whether the group hierarchy (central vs. satellite) has any impact on the presence of activity in the optical and/or the radio.

We define as the fraction of galaxies with properties (halo mass, stellar mass, group hierarchy) that are in activity class (SF, CO, AGN, LRA, HRA). These fractions are computed using
| (1) |
Here is the weight of galaxy , defined as the reciprocal of the comoving volume of the Universe out to a comoving distance at which the galaxy would still have made the selection criteria of our sample, is the number of galaxies with properties that are in activity class , and is the total number of galaxies with properties . Errors are determined using the jackknife technique. We divide the group catalogue into subsamples of roughly equal size, and recalculate 20 times, each time leaving out one of the 20 subsamples. The jackknife estimate of the standard deviation then follows from
| (2) |
with the fraction obtained from jackknife sample , and the average.
3.1 Halo Mass Dependence
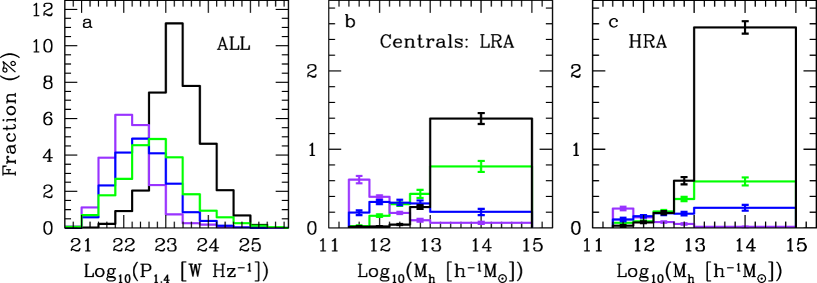
The upper and lower panels of Fig. 3 show and , respectively. Here ‘C’ and ‘S’ refer to centrals and satellites, respectively, is the activity class (SF, CO, AGN, LRA, HRA), and is the halo mass. Thus, these plots show the halo mass distributions of the various activity classes, split according to centrals and satellites. Note how the peak of the halo mass distribution of centrals shifts towards a higher halo mass as their activity changes from star formation to optical AGN activity to radio emission. Star-forming centrals prefer the least massive environments with a halo mass of (this is the minimum halo mass probed by the galaxy group catalogue of Y07); their fraction drops rapidly with increasing halo mass, and becomes negligible in haloes with . Central galaxies classified as composites prefer somewhat more massive haloes; the halo mass distribution peaks around and remains non-negligible up to the scale of massive clusters. The fraction of centrals harboring an optically classified AGN rises sharply from to , stays roughly constant at a level of about 14% out to and decreases by nearly a factor of 2 at the massive end. Finally, the percentage of central radio galaxies increases with increasing halo mass, and reaches a maximum in the most massive halo mass bin. The results for HRA and LRA centrals are remarkably similar, with a weak trend for the HRA centrals to prefer more massive haloes than LRA centrals. Thus, when moving to more massive haloes, the characteristic activity of central galaxies changes from star formation to optical AGN activity to radio activity. Note, though, that the absolute fraction of ‘active’ galaxies decreases quite drastically with increasing halo mass; while more than 60 percent of the centrals in low mass haloes () are active (mostly star forming), at the massive end only percent of the centrals are active, split roughly equally among optical AGN activity and radio activity (both HRA and LRA).
With regard to satellite galaxies, the fraction of those with star-formation activity diminishes by a factor of 3 going from group masses of to . Note that in massive haloes, the fraction of satellite galaxies with star formation activity is an order of magnitude higher than that of central galaxies. The fractions of CO and AGN satellites increase with increasing halo mass. Especially for the composites, this behavior is quite different from that of the centrals. Finally, the fractions of HRA and LRA satellites is rather constant across the full range of halo masses probed. Note, though, that only a very small fraction of satellite galaxies ( percent) are radio active, which is roughly an order of magnitude lower than for central galaxies.
As discussed in Section 2.2, optical and radio activity are not mutually exclusive (cf. Table 2). Panel (a) of Fig. 4 shows the distribution of of all radio sources for each optical activity class. Here, the fractions on the y-axis are computed with respect to the total number of radio galaxies in our sample. SF galaxies dominate at 1022.6 WHz-1, while the AGN distribution extends to larger values, in agreement with the findings of Best (2004). The NOA radio sources are, instead, preferentially associated with 1023 WHz-1. Panels (b) and (c) show the fractions , where corresponds to an optical activity class (SF, CO, AGN or NOA) and to a radio activity class (HRA or LRA). Upon inspection, these fractions are qualitatively consistent with what one would expect if radio and optical activity are independent, i.e., . Thus, for example, central radio galaxies with star formation are typically found in less massive haloes than central radio galaxies with optical AGN activity, irrespective of their specific radio power. In the case of satellite galaxies, the statistics are typically too poor to reach any meaningful conclusion. This finding that the optical and radio activities of galaxies are independent is in good agreement with Best et al. (2005a), who found that the probability that a galaxy of given stellar mass classifies as HRA is independent of whether it it optically classified as an AGN.
3.2 Stellar Mass Dependence
We now turn our attention to the stellar mass dependence of galaxy activity. The upper and lower panels of Fig. 5 show and , respectively, where is the stellar mass of the galaxy. Note how the typical stellar mass of active centrals increases going from star forming centrals to centrals with optical AGN activity to radio-active centrals. The stellar mass distribution of SF centrals peaks at , and drops rapidly with increasing , becoming negligible for . The stellar mass distributions of CO and AGN centrals peak near , though the distribution of the AGN centrals is somewhat more skewed towards larger masses. Finally, central galaxies with radio activity are typically very massive, with stellar masses in excess of . Qualitatively, these trends are remarkably similar to those with halo mass shown in Fig. 3. This similarity owes to the fact that the stellar mass and halo mass of central galaxies are tightly related (e.g., Yang, Mo & van den Bosch 2008), and indicates that it will be difficult to disentangle whether the activity of central galaxies is causally connected to halo mass or to stellar mass (see below).
As for the satellites, the stellar mass distributions are remarkably similar to those of the centrals. This is very different from the halo mass distributions (cf. Fig. 3), which show clear differences for centrals and satellites. This is a first indication that the activity of a galaxy is more closely related to stellar mass than to halo mass.
Finally, we note that the stellar mass distributions for various activity classes shown in Fig. 5 are in good agreement with previous studies (e.g., Brinchmann et al. 2004; Kauffmann et al. 2004; Best et al. 2005b; Kewley et al. 2006).

3.3 Breaking the causality degeneracy
In order to examine whether halo mass or stellar mass is more causally connected to galaxy activity, one needs to probe the halo mass dependence for fixed bins in stellar mass and vice versa. Fig. 6 plots the fractions (left-hand panels) and (right-hand panels) as functions of halo mass and stellar mass. Only -bins with at least 50 galaxies are shown, with darker shades of grey indicating larger fractions. Note that this figure reveals the same overall trends as in Figs. 3 and 5, which are projections of Fig. 6 along the and axes, respectively.
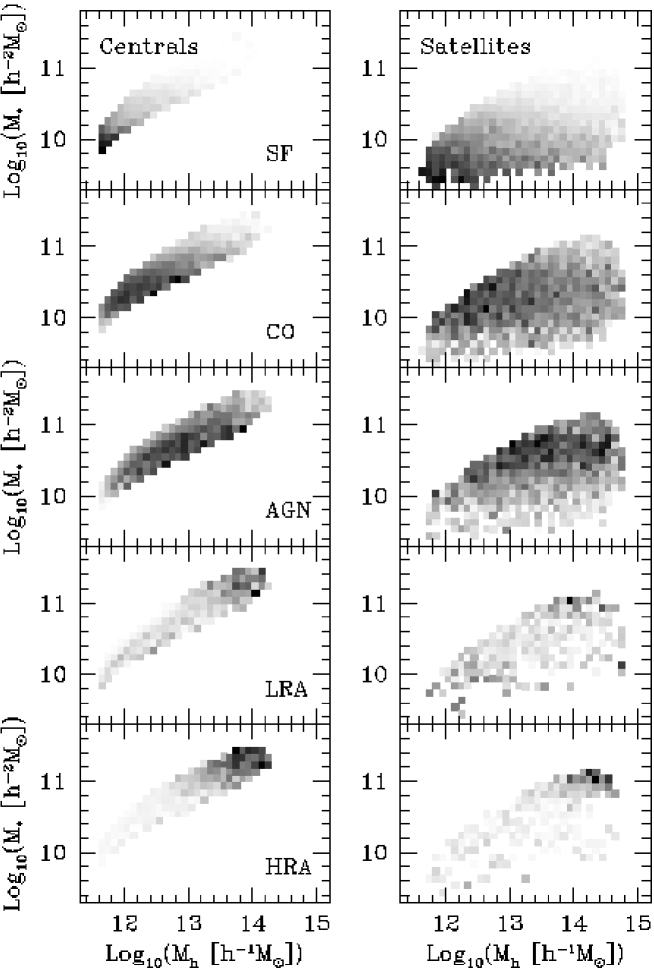
The relatively tight correlation between stellar mass and halo mass for centrals, which partly owes to the way that halo masses have been assigned to the groups (see Section 2 and Y07), limits the dynamic range over which we can probe the halo mass dependence at fixed stellar mass, and vice versa. Hence, it is virtually impossible to tell which of these two conditionals is more causally connected to the activity. In the case of the satellites, however, it is clear that the fractions vary more with stellar mass at fixed halo mass than with halo mass at fixed stellar mass, irrespective of the activity class being considered. In fact, the fractions are almost independent of halo mass at fixed stellar mass, which clearly indicates that stellar mass is a more defining property of the activity class to which the galaxy belongs than halo mass.
To make this more quantitatively, we ignore the distinction between centrals and satellites and define the reduced conditional fractions
| (3) |
and
| (4) |
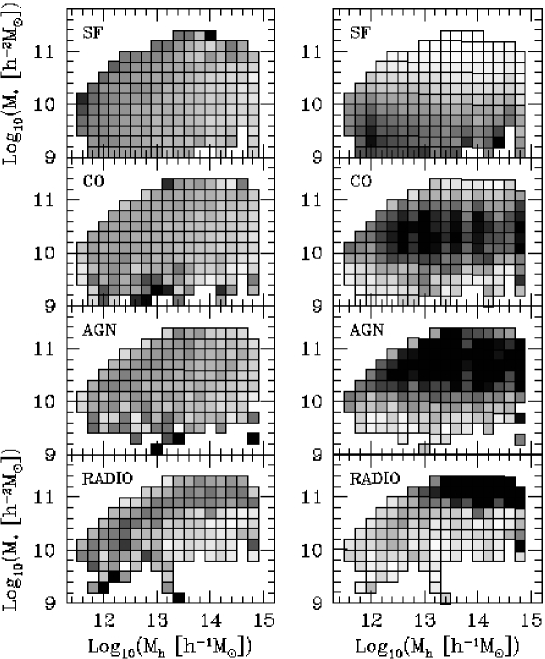
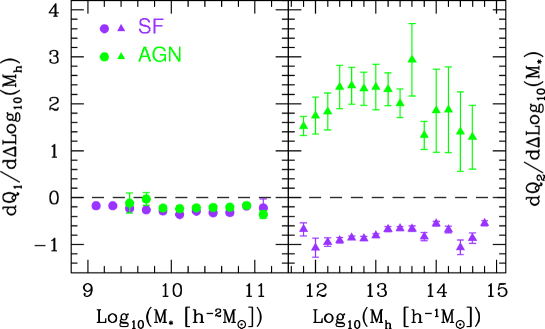
Note that any variation of as a function of at fixed traces the dependence of galaxy activity on halo mass; conversely, changes in as a function of at fixed reflect that galaxy activity depends on stellar mass. The reduced fractions and are plotted in the left-hand and right-hand panels of Fig. 7, respectively, as a function of halo mass and stellar mass for the different activity classes. Note that we have combined the HRA and LRA classed into a single class (labeled RADIO) in order to increase the statistical significance of the present analysis. As in Fig. 6, darker shades of grey correspond to larger values of and .
While at a given stellar mass, varies little with halo mass, changes dramatically with stellar mass at a given . This confirms that galaxy activity is more causally connected to stellar mass than to halo mass. For the star forming galaxies and the optical AGN, we find that the are well fitted by simple linear relations. The right-hand panel of Fig. 8 plots the corresponding slopes, , as functions of . Clearly, these differ significantly from zero, with little dependence on halo mass, indicating that the fraction of galaxies with SF and optical AGN activity depends strongly on stellar mass at fixed . For comparison, the left-hand panels plots as functions of for the same activity classes. Although significantly different from zero (dashed line), these slopes are much smaller. The average is and for the SF and AGN galaxies, respectively, indicating that there is a weak trend for SF and AGN activity to decrease with increasing halo mass. On the other hand, the average values of are and for SF and AGN galaxies, respectively, indicating that while SF activity decreases with increasing stellar mass, optical AGN activity is strongly boosted in more massive galaxies. Comparing these values, the stellar mass dependencies of SF and optical AGN activity are and times more prominent than the corresponding halo mass dependencies. This is the quantitative confirmation that the occurrence of galaxy activity is more strongly related to galaxy stellar mass than to halo mass.
3.4 Group hierarchy
Our analysis thus far has clearly shown that stellar mass is a more important parameter for determining the activity class of a certain galaxy than halo mass. We now investigate whether the group hierarchy plays a role; does the mere fact that a galaxy is a central galaxy, rather than a satellite galaxy, boost or suppress its probability to be active in the optical and/or radio?
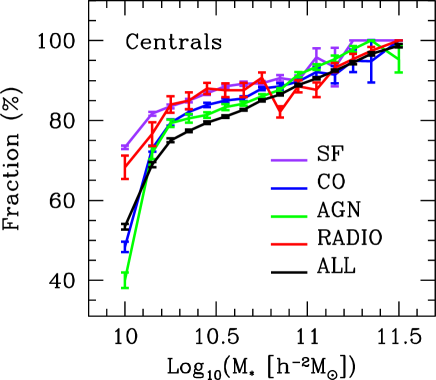
To address this question we have computed the central fractions
| (5) |
with and the numbers of central and satellite galaxies of activity class and stellar mass . Once again, the errors on the central fractions are determined using the jackknife technique with 20 subsamples. The results for SF, CO, AGN and RADIO (HRA and LRA combined) are shown in Fig. 9 as indicated. For comparison, we also show the central fractions of all galaxies, independent of their activity (or absence thereof). Clearly, the central fractions of active galaxies are higher than those of all galaxies, at basically all stellar masses, and for all activity classes. This indicates that galaxies of a given stellar mass are more likely to be active when they are centrals than when they are satellites. This effect is most pronounced for star formation, while optical AGN activity seems to be only boosted by a mild amount for central galaxies compared to satellites of the same stellar mass.
This is in qualitative agreement with Best et al. (2007), who found that brightest cluster galaxies (i.e. equivalent to our ‘centrals’) are more likely to host a radio-loud AGN than other galaxies of the same stellar mass, and with van den Bosch et al. (2008a), who have shown that central galaxies have bluer colors, on average, than satellite galaxies of the same stellar mass. Since satellite galaxies of a given stellar mass where central galaxies of the same stellar mass prior to being accreted by their host halo, this suggests that activity, whether in the optical or in the radio, is suppressed (or quenched) as soon as a galaxy becomes a satellite.
3.5 Halo-centric Distance
The galaxy group catalogue also allows us to check whether the position of a galaxy within its group may foster or hamper a specific kind of activity. For this purpose, we compute the projected distance, , of each satellite galaxy from the luminosity-weighted center of its group normalized by the characteristic radius of the group, (see Section 2). We define the normalized fraction of satellites of a given activity class and per bin of as:
| (6) |
where is the weighted fraction of satellite galaxies of activity class in a given bin of , and is the weighted fraction of satellite galaxies (unconstrained by activity) in the same -bin. This distribution is therefore normalized with respect to the radial distribution of the general population of satellite galaxies.
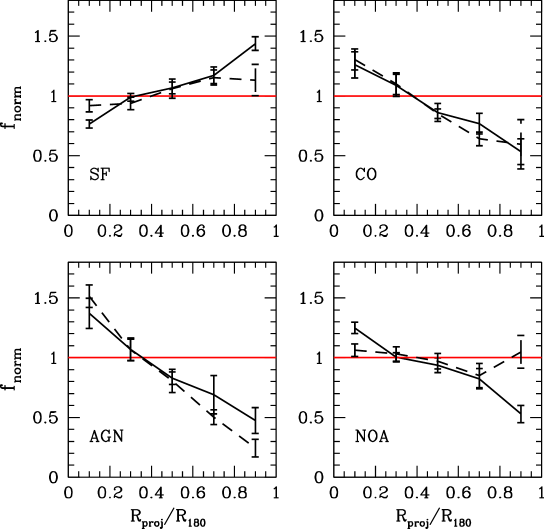
The solid curves in Fig. 10 show as function of , thus obtained. Results are shown separately for star forming satellites (SF; upper left-hand panel), composite satellites (CO; upper right-hand panel), satellites with optical AGN activity (AGN; lower left-hand panel), and satellite with no optical activity (NOA; lower right-hand panel). No results are shown for radio activity, simply because the number of satellite galaxies with radio activity is too small to allow for a meaningful assessment of their radial distribution. As before, the (1) errors have been computed using the jackknife method.
The SF satellites have () at small (large) . This suggests that star formation is suppressed at small halo-centric radii. CO and AGN activity, on the other hand, seems to be boosted at small halo-centric radii. Although these results seem to indicate that halo-centric radius plays an important causal role for galaxy activity, it is important to realize that we have not used stellar mass as a control variable. As shown in van den Bosch et al. (2008b), the group catalogue of Y07 used here reveals clear evidence for mass segregation, in that more massive satellites preferentially reside at smaller halo-centric distances. Since the analysis in Section 3.3 indicates that there is a strong causal connection between stellar mass and galaxy activity, the trends with halo-centric radius shown in Fig. 10 do not necessarily imply that activity is causally connected to . In order to test this we proceed as follows. For each satellite galaxy of activity class in a given bin of we select a random satellite, unconstrained in activity, in the same radial bin (but not necessarily in the same group) that is matched in stellar mass () and redshift (). We use this matched sample to compute
| (7) |
where is the fraction of satellite galaxies (unconstrained in activity) with halo-centric radius that are matched in stellar mass and redshift to those in . The results thus obtained are shown in Fig. 10 as dashed lines. Overall, it is clear that is very similar to , for all activity classes shown. This indicates that the trends with halo-centric radius of the latter are simply a reflection of the mass segregation combined with a causal relation between activity and stellar mass. In other words, there is no indication that the occurrence of galaxy activity in satellite galaxies has a direct dependence on halo-centric radius.
4 The Ecology of Galaxy Activity Strength
In the previous section we have shown that the occurrence of any kind of galaxy activity is mainly governed by stellar mass, rather than halo mass. In addition, there is an indication that being a central galaxy, rather than a satellite of the same stellar mass, causes a significant boost in the occurrence of activity.
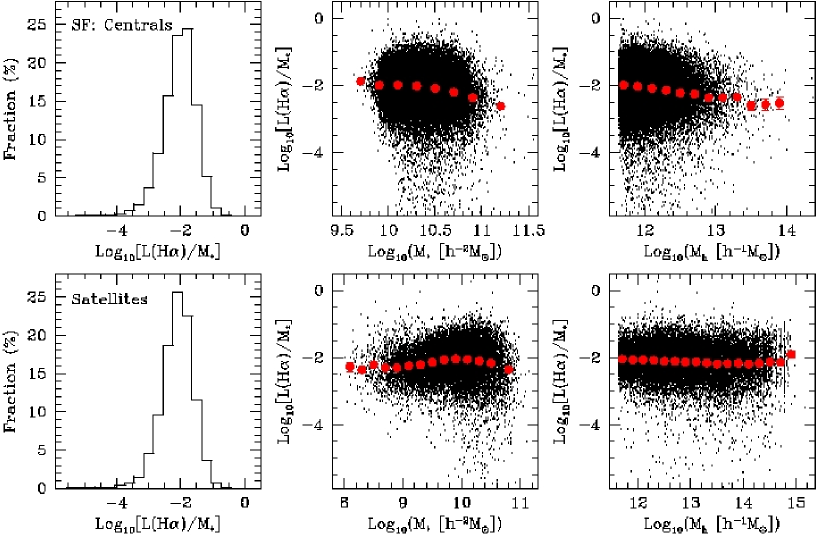
We now investigate the dependence of the activity strength on stellar mass, halo mass and group hierarchy. For star formation and optical AGN activity, we define the activity strength in terms of the specific luminosities in the H and [OIII] emission lines, and , respectively, both corrected for dust obscuration as described in Section 2. Since the spectra are obtained with fibers with a diameter of 3′′, we need to correct for the missed flux. To that extent we scale by the ratio measured in the band between the galaxy Petrosian flux and the flux observed through the spectroscopic fiber. Note that no such correction is needed for , since the [OIII] emission is believed to be dominated by emission from the AGN.
The results for the SF strength are shown in Fig. 11. The histograms in the left-hand panels show the distributions of for the SF centrals (upper left-hand panel) and SF satellites (lower left-hand panel), normalized by the total numbers of centrals and satellites in our group sample, respectively. Both distributions peak around and are weakly skewed towards smaller specific luminosities. No clear differences are evident between the distributions for centrals and satellites. The middle and right-hand panels of Fig. 11 show scatter plots of the specific H luminosities as functions of stellar mass and halo mass, respectively. The solid red circles indicate the averages of per bin of stellar mass or halo mass, while the errorbars (typically smaller than the solid circles) indicate the error on the mean. For central galaxies, the mean of decreases by a factor of four with increasing stellar mass and increasing halo mass. These trends are statistically significant at 4. Thus, in addition to suppressing the occurrence of SF activity, a larger stellar mass or a larger host halo mass also suppresses the strength of the SF activity. Unfortunately, the sample is not large enough to examine whether halo mass or stellar mass are more causally linked to this trend. For satellite galaxies, we find no obvious trend of the specific H luminosity with halo mass or stellar mass. This difference between centrals and satellites suggests that group hierarchy has a direct impact on the strength of star formation activity in galaxies.
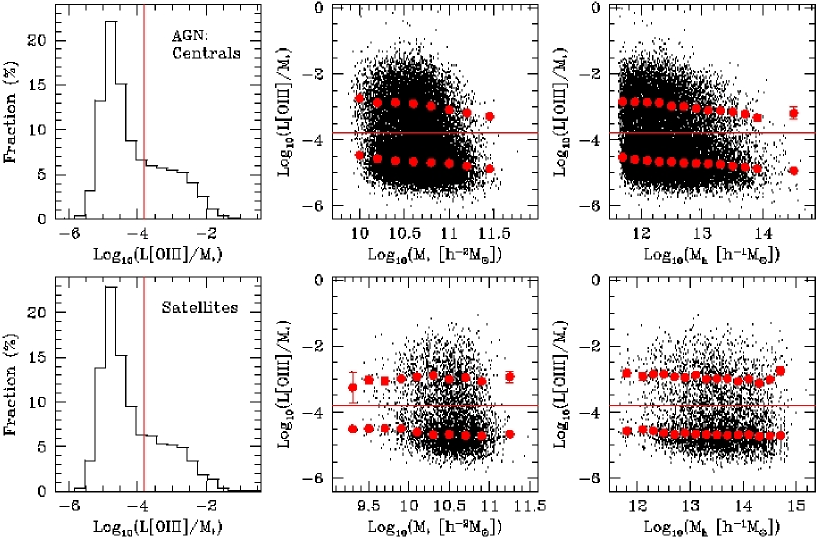
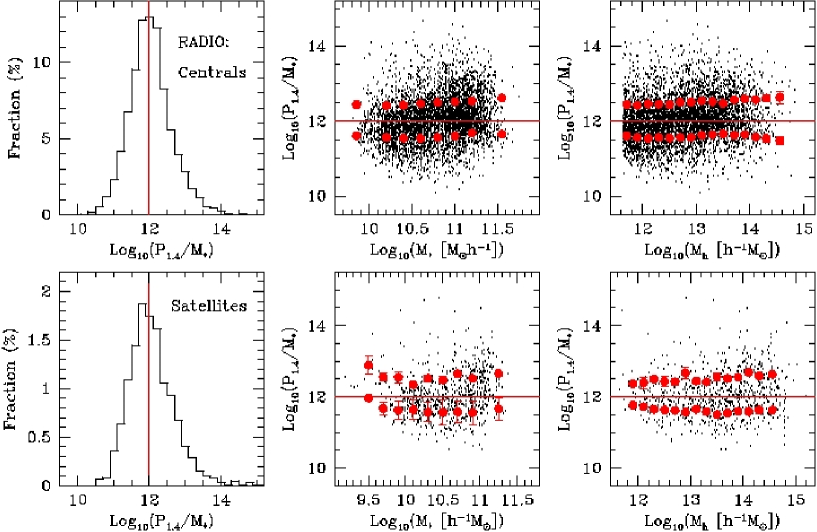
Fig. 12 shows the same as Fig. 11 but for the specific [OIII] luminosity (related to optical AGN activity) rather than the specific H luminosity. Note that the distributions of are strongly skewed towards higher values, for both centrals and satellites. In fact, the distributions are well fit by a sum of two Gaussians, with their respective peaks at and . We identify these two ‘populations’ with LINERS and type II Seyfert galaxies, respectively (cf. Kewley et al. 2006). In order to probe these two populations separately, we (somewhat arbitrarily) split our optical AGN in LINERS and type II Seyfert galaxies depending on whether is smaller or larger than , respectively. As is evident from the upper panels in the middle and right-hand columns of Fig. 12, the central galaxies with Seyfert II activity reveal a decrease of their average specific [OIII] luminosity by a factor three going from low mass (either stellar or halo) to high mass (at the 4 significance level). For the central LINERS, the (average) specific [OIII] luminosity diminishes by a factor of about 2 for increasing stellar and halo mass (at the 6 significance level). On the contrary, satellite galaxies show no dependence of optical AGN strength on either stellar mass or halo mass; neither for type II Seyferts nor for LINERS. Finally, Fig. 13 shows the same as Figs. 11 and 12 but for the specific radio power [in W Hz(M⊙)]. As evident from the left-hand panels, the distributions of specific radio power for both centrals and satellites peak at (indicated by a red, vertical line), and we have used this value to split the population of radio galaxies in high radio activity (HRA; ) and low radio activity (LRA: ) subsamples. The mean specific radio power of HRA centrals increases mildly with stellar mass by a factor of 1.5 (at the significance level), while the mean specific radio power of LRA centrals is constant with . In the case of radio satellites (both HRA and LRA), the mean , although noisy, shows no clear dependence on stellar mass. Similar trends are seen as function of halo mass (right-hand panels of Fig. 13).
5 Conclusions
An important aspect of galaxy formation is understanding the processes that trigger, quench and control star formation and AGN activity. Since both require the presence of gas, this is similar to understanding how galaxies accrete their gas, and how gas can be expelled, stripped or exhausted. A large number of processes are thought to play a role. At the low mass end, it is believed that supernova feedback plays a crucial role in expelling and/or heating gas so as to keep the overall star formation efficiency low. At the massive end, it is generally believed that AGN activity somehow expels or reheats cold gas causing a quenching of star formation. Ram pressure and tidal forces are believed to remove gas from satellite galaxies, while major mergers are efficient in funneling gas to the central regions, igniting starbursts and/or AGN activity, which in turn may exhaust and/or expel the gas resulting in a subsequent shutdown of galaxy activity. In order to probe the environments in which these various processes operate, we have used the SDSS galaxy group catalogue of Yang et al. (2007) and examined the dependence of galaxy activity on stellar mass, halo mass, and group hierarchy (centrals vs. satellites). In particular, we have split the galaxy population in star formers, optical AGN, composite galaxies (both star formation and optical AGN activity) and radio sources (split in high and low radio activity) using emission line fluxes extracted from the SDSS spectra by Kauffmann et al. (2003b) and by cross correlating the SDSS with the FIRST and NVSS catalogues.
For the subsample of central galaxies, we find a smooth transition in halo mass as the activity of central galaxies changes from star formation to optical AGN activity to radio emission (see Fig. 3). Star-forming centrals preferentially reside in haloes less massive than , central galaxies with optical AGN activity inhabit haloes with a characteristic mass of and centrals emitting in the radio preferentially reside in haloes with . A similar trend is present as function of stellar mass. Star formation is mainly occurring in central galaxies with , while the hosts of optical-AGN and radio sources have typical stellar masses of and , respectively (see Fig. 5). Unfortunately, since the relation between stellar mass and halo mass for central galaxies is relatively narrow, we cannot discriminate whether this trend is causally linked to stellar mass or to halo mass.
In addition to the occurrence of activity, we have also investigated the halo and stellar mass dependencies of the activity strengths. The activity strength of star forming and optical AGN centrals is seen to systematically decrease with both stellar and halo mass by a factor of 4 - 2 across the range and , while the specific radio power of HRA centrals increases by a factor of 1.5. Again, the tight relation between and prevents us from investigating which is more causally connected to the activity strength.
In hierarchical models of structure formation, dark matter haloes and galaxies continuously grow in mass. We may therefore interpret the mass dependence of central galaxies as a trend with time: central galaxies start out forming stars, but once their stellar mass exceeds a few times (or their halo mass exceeds ), star formation is quenched, and optical AGN activity becomes important. By the time the halo mass starts to exceed a few time (or the stellar mass exceeds ), the radio-mode of AGN activity starts to become important, while optical AGN activity is somewhat suppressed. Interestingly, the mass scale of this first transition coincides with the mass scale where (i) the mass-to-light ratios of dark matter haloes are minimal (Yang, Mo & van den Bosch 2003; van den Bosch et al. 2007), (ii) dark matter haloes start to develop an accretion shock at their virial radius, giving rise to a hot corona (Birnboim & Dekel 2003; Keres et al 2005; Birnboim, Dekel & Neistein 2007), and (iii) galaxies undergo a transition from being disk-dominated to being bulge-dominated (Kauffmann et al. 2003a).
The following picture emerges: central galaxies in haloes with accrete cold gas, which they actively turn into stars. During this period supernova feedback is believed to play an important role (Dekel & Silk 1986) and to be responsible for an increase of the baryonic mass fraction that is converted into stars with increasing halo mass. If a galaxy undergoes a major merger during this epoch, it regrows a disk around its newly formed bulge (e.g., Kauffmann, White & Guiderdoni 1993). The tight relation between bulge mass and black hole mass suggests that this bulge formation is somehow coupled to the formation of a supermassive black hole at its center (Gebhardt et al. 2000; Ferrarese & Merritt 2000). Once the halo mass exceeds , it starts to develop a rapidly expanding accretion shock, which heats up any newly accreted gas to the halo’s virial temperature. Somehow most of this gas is prevented from cooling, resulting in a quenching of the star formation of the central galaxy (e.g., Dekel & Birnboim 2006; Cattaneo et al. 2006; Birnboim et al. 2007). From this point onwards, the galaxy cannot regrow a new disk after it undergoes a major merger, which explains the transition towards more bulge dominated systems. These mergers are also likely to drive any remaining gas to the center of the merger remnant, where it gives rise to a starburst (exhaust the cold gas supply) and to AGN activity (e.g. Mihos & Hernquist 1996; Sanders & Mirabel 1996). The latter may play an important role in reheating or expelling gas, and thus in quenching the star formation (e.g., Menci et al. 2005; Springel, Di Matteo & Hernquist 2005; Hopkins et al. 2006). Once the halo has grown a hot corona that is massive and dense enough (i.e., when starts to exceed a few times ), it starts to dissipate the energy output from the AGN, giving rise to radio lobes, i.e. the hot gas serves as a ‘working surface’ for the jet (e.g. Kauffmann, Heckman & Best 2008). This in turn gives rise to radio-mode AGN feedback, which is believed to play an important role in preventing the hot gas from cooling and forming stars (e.g., Bower et al. 2006; Croton et al. 2006; Kang, Jing & Silk 2006; Monaco, Fontanot & Taffoni 2007).
As to satellite galaxies, our results support a picture in which satellite galaxies, in general, have their activity quenched. This is supported by the fact that the fraction of active satellites is always smaller than the fraction of active centrals of the same stellar mass (see Figs. 5), and by the fact that the probability for an active galaxy to be a central galaxy is higher than that for random galaxy of the same stellar mass (see Fig. 9). The fact that satellite galaxies only reveal a weak dependence of activity on halo mass (with more massive haloes showing somewhat smaller fractions of active satellites), indicates that the efficiency of this activity-shutdown mechanism must operate with roughly equal efficiency in haloes of all masses. This is in good agreement with van den Bosch et al. (2008a,b) who, using the same galaxy group catalogue as that used here, found that satellite galaxies are redder and more concentrated than central galaxies of the same stellar mass, but that the magnitude of this effect is virtually independent of halo mass. As discussed in van den Bosch et al. (2008a), this seems to favor strangulation (i.e., the removal of the satellite’s hot gas reservoir) as the main quenching mechanism, rather than processes such as ram-pressure stripping which mainly operate in the dense ICM of massive clusters.
The activity of satellite galaxies shows a strong dependence on stellar mass, very similar to that of central galaxies. This is consistent with a picture in which satellite galaxies were central galaxies prior to being accreted, thus ‘inheriting’ their stellar mass dependence. We also find that the activity of satellite galaxies is correlated with their projected group-centric distance: while star forming satellites preferentially reside in the outskirts, satellite galaxies with optical AGN activity have smaller projected distances to their group centers than the average satellite. However, these trends do not reflect a causal connection between activity and halo-centric distance. Rather, they are simply a reflection of mass segregation (more massive satellites have smaller halo-centric distances) combined with the relation between activity and stellar mass. The absence of a direct link between activity and halo-centric distance indicates that the activity-quenching mechanism(s) must operate on time scales longer than, or comparable to the dynamical time in the haloes. This is again consistent with the idea that the main quenching mechanism is strangulation, which seems to operate on a timescale of several Gyrs (e.g. McCarthy et al. 2008; Kang & van den Bosch 2008), and is also supported by the lack of correlation between the activity strength of satellites and either stellar or halo mass as shown in Figs. 11, 12 and 13.
References
- (1) Adelman-McCarthy, J.K. et al., 2006, ApJS, 162, 38
- (2) Antonucci, R., 1993, ARA&A, 31, 473
- (3) Baldwin, J., Philips, M., Terlevich, R., 1981, PASP, 93, 5
- (4) Balogh, M.L., Navarro, J.F., Morris, S.L., 2000, ApJ, 540, 113
- (5) Becker, R.H., White, R.L., Helfand, D.J., 1995, ApJ, 450, 559
- (6) Bell, E.F., McIntosh, D.H., Katz, N., Weinberg, M.D., 2003, ApJS, 149, 289
- (7) Bell, E.F. et al., 2004, ApJ, 608, 752
- (8) Best, P.N., 2004, MNRAS, 351, 70
- (9) Best, P.N., Kauffmann, G., Heckman, T.M., Brinchmann, J., Charlot, S., Ivezić, Z., White, S.D.M., 2005a, MNRAS, 362, 25
- (10) Best, P.N., Kauffmann, G., Heckman, T.M., Ivezić, Z., 2005b, MNRAS, 362, 9
- (11) Best, P.N., von der Linden, Kauffmann, G., Heckman, T.M., Kaiser, C.R., 2007, MNRAS, 379, 894
- (12) Birnboim Y., Dekel A., 2003, MNRAS, 345, 349
- (13) Birnboim Y., Dekel A., Neistein, E., 2007, MNRAS, 380, 339
- (14) Blanton, M.R. et al., 2003, ApJ, 594, 186
- (15) Blanton, M.R. et al., 2005, AJ, 129, 2562
- (16) Bower, R.G., 2006 MNRAS, 370, 645
- (17) Bower, R.G., Benson, A.J., Malbon, R., Hell, J.C., Frenk, C.S., Baugh, C.M., Cole, S., Lacey, C.G., 2006, MNRAS, 370, 645
- (18) Brinchmann, J., Charlot, S., White, S.D.M., Tremonti, C., Kauffmann, G., Heckman, T., Brinkmann, J., 2004, MNRAS, 351, 1151
- (19) Bruzual, G., Charlot, S., 2003, MNRAS, 344, 1000
- (20) Byrd, G., Valtonen, M., 1990, ApJ, 350, 89
- (21) Carter, B.J., Fabricant, D.G., Geller, M.J., Kurtz, M.J., McLean, B., 2001, ApJ, 559, 606
- (22) Cattaneo, A., Dekel, A., Devriendt, J., Guiderdoni, B., Blaizot, J., 2006, MNRAS, 370, 1651
- (23) Charlot, S., Fall, S.M., 2000, ApJ, 539, 718
- (24) Colless, M. et al., 2001, MNRAS, 328, 1039
- (25) Condon, J.J., Cotton, W.D., Greisen, E.W., Yin, Q.F., Perley, R.A., Taylor, G.B., Broderick, J.J., 1998, AJ, 115, 1693
- (26) Constantin, A., Vogeley, M.S., 2006, preprint (astro-ph/0601717)
- (27) Constantin, A., Hoyle, F., Vogeley, M.S., 2007, preprint (arXiv:0710.1631)
- (28) Coziol, R., de Carvalho, R.R., Capelato, H.V., Ribeiro, A.L.B., 1998, MNRAS, 300, 945
- (29) Croom, S.M. et al., 2005, MNRAS, 356, 415
- (30) Croton, D.J. et al., 2006, MNRAS, 365, 11
- (31) Dekel, A., Silk, J., 1986, ApJ, 303, 39
- (32) Dekel A., Birnboim Y., 2006, MNRAS, 368, 2
- (33) Dressler, A., 1980, ApJ, 236, 351
- (34) Ellingson, E., Yee, H.K.C., Green, R.F., 1991, ApJ, 371, 49
- (35) Fanaroff, B.L., Riley, J.M., 1974, MNRAS, 167, 31
- (36) Farouki, R., Shapiro, S.L., 1981, ApJ, 243, 32
- (37) Ferrarese, L., Merritt, D., 2000, ApJ, 539, L9
- (38) Gebhardt, K. et al., 2000, ApJ, 539, L13
- (39) Gómez, P.L., Nichol, R.C., Miller, C.J. et al., 2003, ApJ, 584, 210
- (40) Govoni, F., Falomo, R., Fasano, G., Scarpa, R., 2000, A&A, 353, 507
- (41) Gunn, J.E., 1979, in Active Galactic Nuclei, eds. C. Hazard & S. Mitton (Cambridge: Cambridge University Press), p. 213
- (42) Gunn, J.E., Gott, J.R., 1972, ApJ, 176, 1
- (43) Hashimoto, Y., Oemler, A. Jr., Lin, H., Tucker, D.L., 1998, ApJ, 499, 589
- (44) Hashimoto, Y., Oemler, A.Jr., Lin, H., Tucker, D.L., 1998, ApJ, 499, 589
- (45) Hernquist L., 1989, ApJ, 342, 1
- (46) Hill, G.J, Lilly, S.J., 1991, ApJ, 367, 1
- (47) Hopkins, P.F., Hernquist, L., Cox, T.J., Di Matteo, T., Robertson, B., Springel, V., 2006, ApJS, 163, 1
- (48) Hubble, E.P., 1926, ApJ, 64, 321
- (49) Kang, X., Jing, Y.P., Mo, H.J., Böner, G., 2005, ApJ, 631, 21
- (50) Kang, X., Jing, Y.P., Silk, J., 2006, ApJ, 648, 820
- (51) Kang, X., van den Bosch F.C., 2008, ApJ, 676, L101
- (52) Kauffmann, G., White, S.D.M., Guiderdoni B., 1993, MNRAS, 264, 201
- (53) Kauffmann, G. et al., 2003a, MNRAS 341, 54
- (54) Kauffmann, G. et al., 2003b, MNRAS 346, 1055
- (55) Kauffmann, G., White, S.D.M., Heckman, T.M., Ménard, B., Brinchmann, J., Charlot, S., Tremonti, C., Brinkmann, J., 2004, MNRAS, 353, 713
- (56) Kauffmann, G., Heckman, T.M., Best, P.N., 2008, MNRAS, 384, 953
- (57) Kelm, B., Focardi, P., Zitelli, V., 2004, A&A, 418, 25
- (58) Keres D., Katz N., Weinberg D.H., Davé R., 2005, MNRAS, 363, 2
- (59) Kewley, L.J., Groves, B., Kauffmann, G., Heckman, T., 2006, MNRAS, 372, 961
- (60) Kewley, L.J., Dopita, M.A., Sutherland, R.S., Heisler, C.A., Trevena, J., 2001, ApJ, 556, 121
- (61) Larson, R.B., 1974, MNRAS, 169, 229
- (62) Larson, R.B., Tinsley, B.M., Caldwell, C.N., 1980, ApJ, 237, 692
- (63) Ledlow, M.J., Owen, F.N., 1995, AJ, 110, 1959
- (64) Li, C., Kauffmann, G., Wang, L., White, S.D.M., Heckman, T.M., Jing, Y.P., 2006, MNRAS, 373, 457
- (65) McCarthy, I.G., Frenk, C.S., Font, A.S., Lacey, C.G., Bower, R.G., Mitchell, N.L., Balogh, M.L., & Theuns, T., 2008, MNRAS, 383, 593
- (66) McLure, R.J., Dunlop, J.S., 2001, MNRAS, 321, 515
- (67) Menci, N., Fontana, A., Giallongo, E., Salimbeni, S., 2005, ApJ, 632, 49
- (68) Mihos J.C., Hernquist L., 1996, ApJ, 464, 641
- (69) Miller, N.A., Ledlow, M.J., Owen, F.N., Hill, J.M., 2002, AJ, 123, 3018
- (70) Miller, C.J., Nichol, R.C. Gómez, P.L., Hopkins, A.M., Bernardi, M., 2003, ApJ, 597, 142
- (71) Monaco, P., Giuricin, G., Mardirossian, F., Mezzetti, M., 1994, ApJ, 436, 576
- (72) Monaco, P., Fontanot, F., Taffoni, G., 2007, MNRAS, 375, 1189
- (73) Moore, B., Katz, N., Lake, G., Dressler, A., Oemler, A., 1996, Nature, 379, 613
- (74) Nusser, A., Silk, J., Babul, A., 2006, MNRAS, 373, 739
- (75) Osterbrock D.E., 1989, Astrophysics of gaseous nebulae and active galactic nuclei, University Science Books, Mill Valley CA
- (76) Owen, F.N., White, R.A., 1991, MNRAS, 249, 164
- (77) Petrosian V., 1976, ApJ, 209, L1
- (78) Postman, M., Geller, M.J., 1984, ApJ, 281, 95
- (79) Prestage, R.M., Peacock, J.A., 1988, MNRAS, 230, 131
- (80) Sanders, D.B., Mirabel, I.F., 1996, ARA&A, 34, 749
- (81) Schmitt, H.R., 2001, AJ, 122, 2243
- (82) Schlegel D.J., Finkbeiner D.P., Davis M., 1998, ApJ, 500, 525
- (83) Shimada, M., Ohyama, Y., Nishiura, S., Murayama, T., Taniguchi, Y., 2000, AJ, 119, 2664
- (84) Shlosman, I., Begelman, M.C., Frank, J., 1990, Nature, 345, 679
- (85) Sijacki, D., Springel, V., 2006, MNRAS, 366, 397
- (86) Spergel et al. 2007, ApJS, 170, 377
- (87) Springel, V., Di Matteo, T., Hernquist, L., 2005, MNRAS, 361, 776
- (88) Stoughton, C. et al., 2002, AJ, 123, 485
- (89) Strateva, I. et al., 2001, AJ, 122, 1861
- (90) Strauss M.A., et al., 2002, AJ, 124, 1810
- (91) Tanaka, M., Kodama, T., Arimoto, N., Okamura, S., Umetsu, K., Shimasaku, K., Tanaka, I., Yamada, T., 2005, MNRAS, 362, 268
- (92) Toomre, A., Toomre, J., 1972, ApJ, 178, 623
- (93) van den Bosch F.C., et al., 2007, MNRAS, 376, 841
- (94) van den Bosch F.C., Aquino D., Yang A., Mo H.J., Pasquali A., McIntosh D.H., Weinmann S.M., Kang X., 2008a, MNRAS, in press (arXiv:0710.3164)
- (95) van den Bosch, F.C., Pasquali A., Yang X., Mo H.J., Weinmann S.M., McIntosh D.H., Aquino D., 2008b, preprint (arXiv:0805.0002)
- (96) Wake, D.A. et al., 2004, ApJ, 610, L85
- (97) Weiner, B.J. et al., 2005, ApJ, 620, 595
- (98) Weinmann, S.M., van den Bosch, F.C., Xiaohu, Y., Mo, H.J., 2006, MNRAS, 366, 2
- (99) White, S.D.M., Frenk, C.S., 1991, ApJ, 379, 52
- (100) White, S.D.M., Rees, M.J., 1978, MNRAS, 183, 341
- (101) Yang X., Mo H.J., van den Bosch F.C., 2003, MNRAS, 339, 1057
- (102) Yang X., Mo H.J., van den Bosch F.C., Jing Y.P., 2005a, MNRAS, 356, 1293
- (103) Yang X., Mo H.J., van den Bosch F.C., Jing Y.P., 2005b, MNRAS, 357, 608
- (104) Yang X., Mo H.J., van den Bosch F.C., Pasquali A., Li C., Barden M., 2007, ApJ, 671, 153
- (105) Yang X., Mo H.J., van den Bosch F.C., 2008, ApJ, 676, 248
- (106) Yee, H.K.C., Green, R.F., 1984, ApJ, 280, 79
- (107) York, D.G. et al., 2000, AJ, 120, 1579
- (108) Zehavi I., et al., 2002, ApJ, 571, 172