The Stellar Populations of Stripped Spiral Galaxies in the Virgo Cluster
Abstract
We present an analysis of the stellar populations of the gas-stripped outer disks of ten Virgo Cluster spiral galaxies, utilizing SparsePak integral field spectroscopy on the WIYN 3.5m telescope and GALEX UV photometry. The galaxies in our sample show evidence for being gas-stripped spiral galaxies, with star formation within a truncation radius, and a passive population beyond the truncation radius. We find that all of the galaxies with spatially truncated star formation have outer disk stellar populations consistent with star formation ending within the last 500 Myr. The synthesis of optical spectroscopy and GALEX observations demonstrate that star formation was relatively constant until the quenching time, after which the galaxies passively evolved. Large starbursts at the time of quenching are excluded for all galaxies, but there is evidence of a modest starburst in at least one galaxy. For approximately half of our galaxies, the timescales derived from our observations are consistent with galaxies being stripped in or near the cluster core, where simple ram-pressure estimates can explain the observed stripping. However, the other half of our sample galaxies were clearly stripped outside the cluster core. Such galaxies provide evidence that the intra-cluster medium is not static and smooth. For three of the most recently stripped galaxies, there are estimates for the stripping timescales from detailed gas stripping simulations. For all three of these galaxies, our stripping timescales agree with those from the gas stripping simulations, suggesting that star formation is quenched near the time of peak pressure. While the stripping of star-forming gas in the outer disk creates a passive population in our galaxies, there is still normal star formation in the center of our sample galaxies. It may be that Virgo is not massive enough to completely strip these spiral galaxies and, in a more dynamically active cluster or a cluster with a higher density ICM, such a process would lead to passive spirals and/or S0s.
Subject headings:
galaxies: clusters: individual (Virgo), galaxies: evolution, galaxies: interactions, galaxies: stellar content, intergalactic medium1. Introduction
The morphology-density relationship (Dressler, 1980) implies that clusters are creating S0 galaxies at the expense of spirals. The most salient difference between the two galaxy populations is the presence (spirals) or absence (S0’s) of current strong star formation. Kauffmann et al. (2004) find that the star formation - environment correlation is the strongest correlation of any galaxy property with environment, suggesting that environment plays a key role in the termination of star formation. While there is intense debate as to the specific environmental processes that cause the transformation, stellar population simulations (Shioya et al., 2004) have shown that simple quenching of star formation in a spiral galaxy can form S0-type spectra. However, not all S0 galaxies are faded spirals; there is a significant fraction of S0’s with larger bulges than spiral galaxies (e.g. Christlein & Zabludoff, 2004), something that cannot be explained by simple disk fading. Ram pressure stripping is not the sole cause of the transformation of spirals to S0’s, but it does appear to be a key part of the transformation for many galaxies.
A recently discovered population of cluster galaxies, “passive spirals” (Dressler et al., 1999), have noticeable spiral structure but little, if any, ongoing star formation. UV photometry (Moran et al., 2006) has shown that these galaxies have intermediate stellar population properties between spirals and S0’s; passive spirals have no ongoing star formation, but have stopped forming stars only recently. These galaxies are consistent with an intermediate phase between spirals and S0s. Poggianti et al. (2006) suggest that S0’s may represent a heterogeneous population: “primordial passive galaxies” that formed at and environmentally-formed S0s, which may evolve through a passive spiral phase. Shioya et al. (2004) demonstrate that such evolution from active spiral to passive spiral to S0 is naturally explained by passive stellar evolution after a stripping event and also suggest that there are at least two paths to S0 galaxies.
In the nearby Virgo cluster, there exists a population of spiral galaxies with normal star formation inside some radius, but little or no star formation beyond that “truncation radius” (Koopmann & Kenney, 2004). Many of these galaxies have relatively undisturbed stellar distributions, despite their severely truncated H disks. Such a disturbance in the gas with little or no apparent stellar disk disturbance strongly suggests a gas-gas interaction; if a gravitational interaction disturbed the star formation, the stellar light should also be disturbed. The appearance of these galaxies beyond the stripping radius (i.e. normal stellar disk with no current star formation) is strikingly similar to the passive spirals in higher redshift clusters. By studying the stellar populations of our sample galaxies, we aim to understand when and where in the cluster galaxies are stripped. Are these Virgo spirals with truncated star-forming disks just passive spirals that have not been fully stripped?
Our sample of galaxies are drawn nearly entirely from the work of Koopmann, Kenney, & Young (2001), an atlas of -band and H-band images of spiral galaxies in Virgo. They find that of spiral galaxies in Virgo have truncated H disks (Koopmann & Kenney, 2004): relatively normal star formation in their central regions, with little or no star formation beyond a well-defined radius which we call the gas truncation radius. By studying the stellar populations of the outer disks of these galaxies through optical spectroscopy and UV imaging, we aim to understand where in clusters galaxies can be stripped and what effect gas stripping has on the star formation properties of spiral galaxies. The location in the cluster of stripping tells us how effective stripping is at different distances from the cluster center. Simple models of ISM-ICM stripping suggest that stripping can only occur in the cluster core, where the ICM densities are highest. Galaxies stripped far from the center of the cluster suggest a non-static, non-smooth ICM or extreme conditions outside the cluster core.
In §2, we outline our observations and explain the observational setup for optical spectroscopy and GALEX UV imaging. In §3, we discuss the relevant spectral features that we use to determine the stellar population properties of these galaxies. In §4, we describe the models that we have used to interpret the stellar population properties of our observed sample. In §5, we detail our observations and results and discuss what the results imply about the quenching of star formation in the galaxies’ outer disks. In §6, we discuss the implications of our individual galaxy results for the cluster as a whole, compare our results with simulations of neutral gas, and briefly discuss what our observations of these galaxies in Virgo may imply for galaxy evolution in clusters. Finally, in §7, we summarize our results.
2. Observations
2.1. Optical Spectroscopy
Galaxies in the sample were observed the nights of March 28, 2003 - April 1, 2003 and March 18 - 23, 2004 on the WIYN 3.5m telescope. For both runs, we used an identical spectrographic setup: the Bench Spectrographic camera with the 600@10.1 grating, tuned to provide spectral coverage between 3900 Å and 6800 Å at a sampling of 1.4 Å/pixel and a resolution of Å (FWHM). We used the SparsePak Formatted Field fiber instrument (Bershady et al, 2004) in order to get large spatial coverage (80″x 80″) of the Virgo galaxies. While the spectral window extends from quite blue (Å) to fairly red ( Å) the observing efficiency is not uniform over the entire range: fiber transmission causes significantly reduced throughput in the blue part of the spectrum and the grating sensitivity causes a drop in throughput in the red.
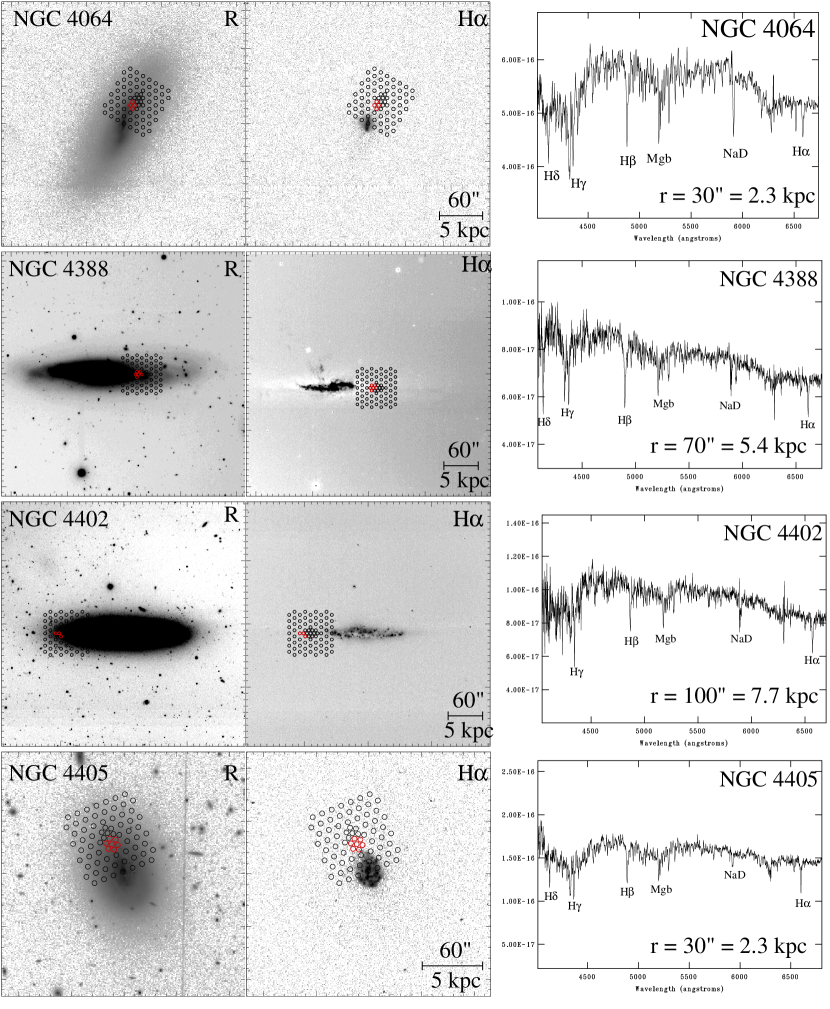
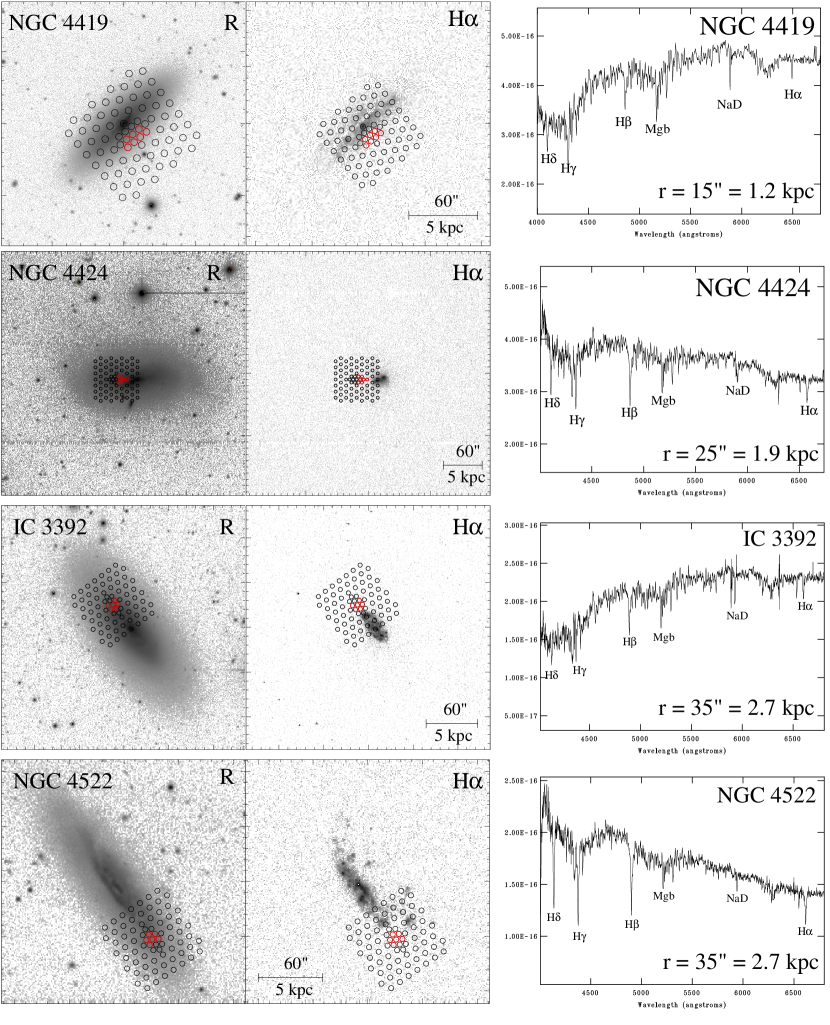
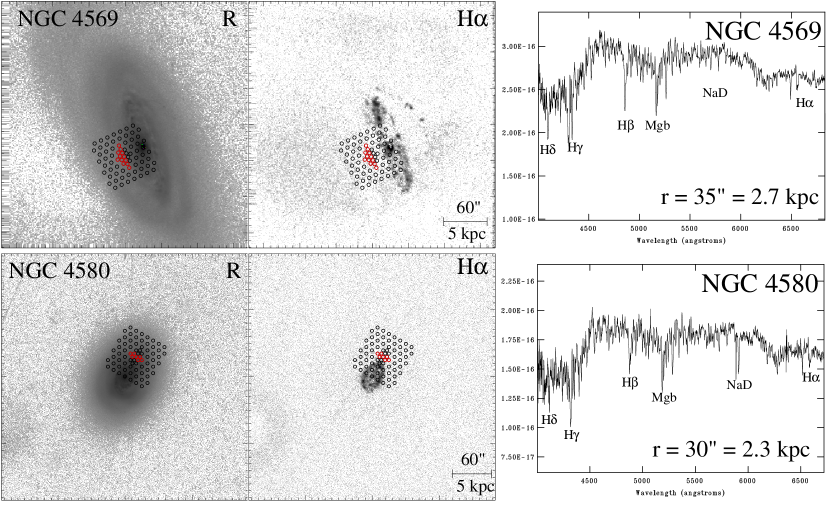
Several factors were considered when deciding an observational strategy for each of the disk galaxies in our sample. First, we must align the SparsePak array on the galaxy such that it’s outside the region of significant H emission. This part of the galaxy, beyond the region of ongoing star formation, is interesting because it is a stellar clock telling us when star formation was interrupted in that region of the disk. Moreover, emission from star-forming regions would fill in the age-sensitive Balmer absorption lines, leading to artificially old age estimates and complicating interpretations. Observationally, this makes it possible to observe the stellar populations in the disks of these galaxies by placing a majority of the SparsePak array outside the region of star formation (as shown in Figures 1 - 3).
As an additional observational constraint, we observed as close to the H truncation radius as possible. This was done for both practical and scientific reasons. From an observational standpoint, the regions of the stellar disks are low surface brightness (often, at the H truncation radius, mag/arcsec2), so it is necessary to observe in the highest surface brightness regions. From a scientific perspective, we are interested in when the galaxy was stripped of its star-forming gas. The inner regions should be the final regions to be stripped in an interaction with the ICM. Therefore, by studying the region of the galaxy close the stripping radius, we can determine how long ago the galaxy experienced strong pressure. If the galaxy is past the time of peak pressure stripping, this timescale will tell us how long ago peak pressure occurred.
The SparsePak array was positioned such that the highest density of fibers is nearest to the truncation radius. In most cases, the array was placed such that the central “diamond” of fibers was arranged along the major axis, just beyond the truncation radius. In some instances, however, the fiber array was placed parallel to the minor axis (i.e. NGC 4419, NGC 4569). In the case of NGC 4419, there is extended, low-level H emission throughout the main disk, so we placed the array to attempt to avoid some of that emission. In the case of NGC 4569, we chose the location to ensure that we could effectively subtract sky light from the galaxy spectra. One potential complication associated with observing along the minor axis is that bulge stars may contaminate the light from the stellar disk. However, both of these galaxies have rather small bulges and in neither case do we use fibers placed on the center of the galaxy for our analysis. Therefore, we do not expect bulge light to significantly affect our results.
The observations were reduced using the standard IRAF procedures, including zero correction and flat field correction. Following basic image calibration, spectra were extracted using the dohydra task in IRAF, as well as wavelength calibrated and sky subtracted (using several SparsePak sky fibers). The data were flux calibrated using the spectrophotometric standard Feige 34. Finally, individual exposures are combined to create a set of 75 spectra for each telescope pointing, with each spectrum being from one fiber ( or 360 pc111Here, and throughout this paper, we assume a distance to Virgo of 16 Mpc. in diameter).
| Galaxy | SparsePak | PASP | GALEX |
|---|---|---|---|
| NGC 4064 | 3h45m | 10° | |
| NGC 4388 | 3h45m | 270° | 1511s |
| NGC 4402 | 3h45m | 90° | 1511s |
| NGC 4405 | 3h45m | 22° | 2174s |
| NGC 4419 | 3h | 310° | 1061s |
| NGC 4424 | 3h45m | 90° | 2017s |
| IC 3392 | 3h45m | 37° | 1702s |
| NGC 4522 | 3h45m | 215° | 2505s |
| NGC 4569 | 3h30m | 205° | 1445s |
| NGC 4580 | 3h45m | 330° | 1453s |
The spectra are then examined, fiber by fiber, for any residual emission that may be present in the regions of the galaxy observed. In most cases, it appears the H images (Koopmann, Kenney, & Young, 2001) faithfully trace the emission and the spectra show little, if any, residual H emission beyond the truncation radius defined in the images. A comparison of two spectra from different regions of NGC 4522 shown in Figure 4 demonstrates the large differences between a spectrum taken beyond the truncation radius (top spectrum) and a spectrum in the star-forming disk (bottom spectrum). The metal lines (Mgb and NaD) are largely unaffected, but the lower-order Balmer lines are clearly seen in emission in the star-forming disk; in particular, H is filled in by star-forming emission. While this effect decreases markedly for the higher order lines (Osterbrock, 1989 reports emission line ratios of H/H = 2.86, H/H = 6.09, H/H =10.92 for a K emission region), these lines still suffer from emission fill-in in the inner disk. While we went to some effort to exclude fibers with H emission from the composite spectra that we analyzed, it became apparent through the analysis that there was some minor residual Balmer emission in the outer disk in nearly all of the galaxies. The contamination is minor, typically less than Å for H and much lower for H and H. Several fibers beyond the truncation radius are combined for each galaxy to increase the signal to noise ratio; these composite spectra are used for all forthcoming spectral analysis.

For our data, which has intermediate spectral resolution and intermediate signal-to-noise ratio, we have chosen to use the Lick/IDS spectral indices (Faber et al., 1985). These indices are extracted from data by defining a spectral bandpass and two pseudo-continuum bandpasses on either side of the feature of interest.
We chose to extract Lick indices as opposed to directly measuring absorption lines because of the objectivity of the Lick system; while fitting absorption lines is appealing for very strong features, the Lick system allows us to objectively extract spectral features without subjectively choosing which features of a line to fit. It should be noted that the indices that we extracted are not on the Lick/IDS system, since that would require smoothing our data to even lower spectral resolution. Instead, we leave our data at its native spectral resolution and just use the Lick index definitions (Worthey et al., 1994; Worthey & Ottaviani, 1997) to compare our data with models.
In practice, the spectra are analyzed using the the LECTOR task, which has been made publicly available by A. Vazdekis222See http://www.iac.es/galeria/vazdekis/vazdekis_software.html. This Fortran code numerically integrates an input spectrum for several indices using Lick index definitions. Additionally, using S/N estimates of the spectrum, LECTOR measures the uncertainty in an index. The uncertainty in spectral indices that we quote throughout this work are the errors due to variations in the S/N and do not take into account any potential (unknown) calibration errors.
2.2. GALEX UV Imaging
For nine of our ten galaxies, we have also utilized GALEX imaging, from the 100s exposure All-Sky Imaging Survey (AIS) and from the 1000s exposure Nearby Galaxy Survey (NGS) (Martin et al., 2005). Moreover, we also have included, where possible, data from our medium-depth ( s) Virgo GALEX survey, which gives complete medium-depth coverage to the galaxies in the VIVA sample (Chung et al 2008, in prep). The data include both far-UV (FUV; Å) and near-UV (NUV; Å) images and, in all cases, the galaxy was detected in the NUV.
From this GALEX imaging, we extract fluxes in circular apertures that match the size and location of the optical spectroscopy fibers. The appropriate apertures are then summed to determine the UV flux from the region of the composite spectrum. The FUV/NUV flux ratio for each galaxy is a further constraint on the stellar population; because of how fast the FUV luminosity fades (see Figure 5), this measurement is extraordinarily sensitive to recent star formation for those galaxies where we are able to detect FUV emission. For the galaxies where FUV emission is undetected, the ratio of the FUV upper limits (Morrissey et al., 2005) to the NUV flux gives an upper limit to the stellar population age. We have corrected all GALEX fluxes for Galactic absorption, using the Schlegel et al. (1998) reddening maps and the extinction law of Li & Draine (2001).
Due to uncertainties with pointing of ground-based spectroscopy we have gone to some care to make certain that we are sampling the same region with GALEX photometry as we are with SparsePak spectroscopy. We have verified that the highest optical flux is present in the fiber centered at the nucleus of the galaxy in the SparsePak observations. Moreover, we have verified that strong H emission is not present in fibers that appear to be beyond the star-forming region in our images (Figures 1 - 3). In addition, we have verified that even sizable positional offsets do not significantly impact the color ratios. We have found that the flux ratios typically change by less than (0.05 in the log) for offsets up to (the aperture radius). Moreover, in several cases, the colors are robust to significantly larger offsets.
| Galaxy | |||
|---|---|---|---|
| (erg/s/cm2/Å) | |||
| NGC 4388 | |||
| NGC 4402 | |||
| NGC 4405 | |||
| NGC 4419 | |||
| NGC 4424 | |||
| IC 3392 | |||
| NGC 4522 | |||
| NGC 4569 | |||
| NGC 4580 | |||
3. Optical Absorption Line Diagnostics
3.1. Age-Sensitive Indices
The optical spectra that we use for our analysis are representative of the luminosity-weighted mean population for the region of the galaxy they are extracted from. This means that the observed spectrum is dominated by the younger, more luminous stellar population. While the extremely massive stars are the most luminous, stars with spectral types O and B (with lifetimes of Myr and Myr, respectively) do not survive long. This means that, in a young population with no ongoing star formation, the stellar light is dominated by that from stars for the majority of the first 1 Gyr.
The Balmer absorption lines have become the diagnostic of choice for measuring the age of the stellar population. For A-type stars or later, the strength of Balmer absorption lines are good indicators of stellar temperatures of stars at the main sequence turnoff and, therefore, good indicators of the main sequence turn-off age. In addition, the Balmer lines are relatively insensitive to metallicity, allowing for a strong diagnostic not as confused by the age-metallicity degeneracy as some other indices.
While we were careful to avoid most of the star-forming disk, in many cases, our absorption line measurements of H are noticeably affected by nebular emission fill-in. Due to the superposition of absorption and emission features, it is difficult to quantify the degree of contamination from the emission regions. By comparing data to models, we are able to determine that the effect is small, in most cases Å for H, but it does noticeably affect the ages that one would infer from the H index. Moreover, in all cases but one (NGC 4402), we have good measurements of the higher order Balmer lines (H and H). In fact, it is the ages inferred from the measurements of these lines that tell us that the H line is contaminated; in most cases, the age that we would infer from the H line is older than the age inferred from the higher order lines. When comparing the observed spectrum to a modeled spectrum, we do see a small amount of residual emission in the H feature which, assuming a Balmer decrement of H/H = 2.86 (Osterbrock, 1989), is enough to account for the age discrepancy between H and the higher order lines. Moreover, the age determined from H is much more sensitive to errors in the measurements than the age estimates from H or H. Although the errors in H or H equivalent widths are higher than those in H by as much as a factor of 3-4, the H and H models cover times the range in their equivalent widths, compared to H. This makes the errors in the resulting ages somewhat smaller for the higher order lines. Additionally, because of the high ratio of H emission to H and H emission at (at typical HII region temperatures of K; Osterbrock, 1989), there is much less Balmer emission in the higher order lines. Therefore, while we present the H models for completeness, we use the average age concluded from the two higher order Balmer lines as our primary age diagnostic.
3.2. Metallicity-Sensitive Index
As our metallicity-sensitive index, we chose to use the hybrid index [MgFe]′. The index is a weighted average of the Mgb index and two Fe indices:
| (1) |
Thomas et al. (2003) specifically construct this index to be insensitive to variations in abundance ratios and element enhancements for their sample of early type galaxies. While non-solar abundance ratios typically are not a concern for spiral galaxies, this index is still useful as an indicator of total metallicity.
4. Stellar Population Models
Stellar population models describe how the light from a population of stars changes as they form and evolve. While models differ in their details, most share a common, basic method of modeling a stellar population. Individual stellar evolution is modeled via isochrones from a stellar evolution code, a chosen IMF dictates the relative number of stars, the star formation history parametrizes how those stars formed as a function of time (i.e. SFR(t)), and empirical libraries or theoretical stellar atmospheres are used to transform the theoretical quantities of the isochrones (i.e. and ) into observable quantities (i.e. broadband colors or spectra).
4.1. Starburst99
For this work, we have chosen to use the Starburst99 (SB99) stellar population synthesis code (Leitherer et al., 1999). Many stellar population synthesis codes use empirical stellar libraries to transform theoretical parameters into observable quantities (i.e. Worthey, 1994; Vazdekis, 1999; Bruzual & Charlot, 2003). A key shortcoming of many of these spectral libraries is that they lack young, metal-poor stars (due to the dearth of these stars in the Solar Neighborhood). The outer spiral disks of this study contain young stellar populations. This is one of the primary reasons that we have selected the SB99 models to compare to the data: the most recent update of the SB99 models utilizes the synthetic stellar spectra of Martins et al. (2005), as opposed to empirical spectral libraries. These models include metallicities from Z=0.001 (i.e. 1/20 solar) to Z=0.04 (i.e. twice solar), allowing more complete metallicity coverage. This means that we avoid the problems of the incomplete libraries and are able to define a uniform grid of models, from which we can extract ages and metallicities.
4.2. Transformation to Observables
As its output, SB99 produces spectra created by summing several theoretical spectra of Martins et al. (2005). These spectra are then smoothed to the instrumental resolution of the observed spectra. While the resolution of the spectra will not affect the equivalent width measurements, the Lick index measurements can be affected by spectral resolution mis-match since some line flux can be smoothed into the pseudo-continuum bandpasses. While this is not ideal as some of the line flux is shifted out of the line passband, as long as there is consistency between the observations and models, our conclusions will be robust. Unlike many stellar population analyses of earlier-type galaxies, we do not correct our galaxies for stellar velocity broadening of absorption lines. Since we are studying the disks of spirals, the velocity dispersion is very low. In the case where the effect should be most extreme (NGC 4388, a massive edge-on galaxy), we find no meaningful difference in results from the corrected and uncorrected spectra.
SB99 additionally generates lower resolution SEDs (Leitherer et al., 1999) that extend far into the UV. These SEDs are used, together with the detector bandpasses for GALEX to create a grid of colors that depends critically on age. Specifically, because the FUV flux changes so quickly at young ages (Figure 5), the FUV to NUV flux ratio is a powerful indicator of population age.
4.3. Modeled Star Formation History
Much of the stellar population synthesis work in the literature relies on the “Simple Stellar Population” (SSP) assumption; that is, the assumption that all stars formed at one time and then passively evolved. While this may be a good approximation of star clusters, it is clearly not a good description of the star formation history in a spiral galaxy; one of the fundamental characteristics of a spiral is ongoing star formation. Therefore, we have chosen to model the stars in the outer disks of these Virgo galaxies as quenched star formation histories. That is, we assume that there was constant star formation from a formation time (set to be 12 Gyr ago), followed by rapid quenching of star star formation. We define the time since star formation ceased as the quenching time (). Note that is different from the “age” of the stellar population, which is the value usually quoted when comparing observations to models. The luminosity-weighted mean age of our quenched stellar population is significantly larger than .
Practically, the quenched star formation models are constructed by summing spectra from several bursts. Constant star formation is approximated as a star forming burst every 50 Myr from the population’s formation time (12 Gyr) to the time of quenching (). In addition, we have considered the effect of adding a small starburst at the time of quenching, in which 2% of the stellar mass is formed in a burst at the time of quenching (equivalent to a times increase in SFR for 50 Myr).
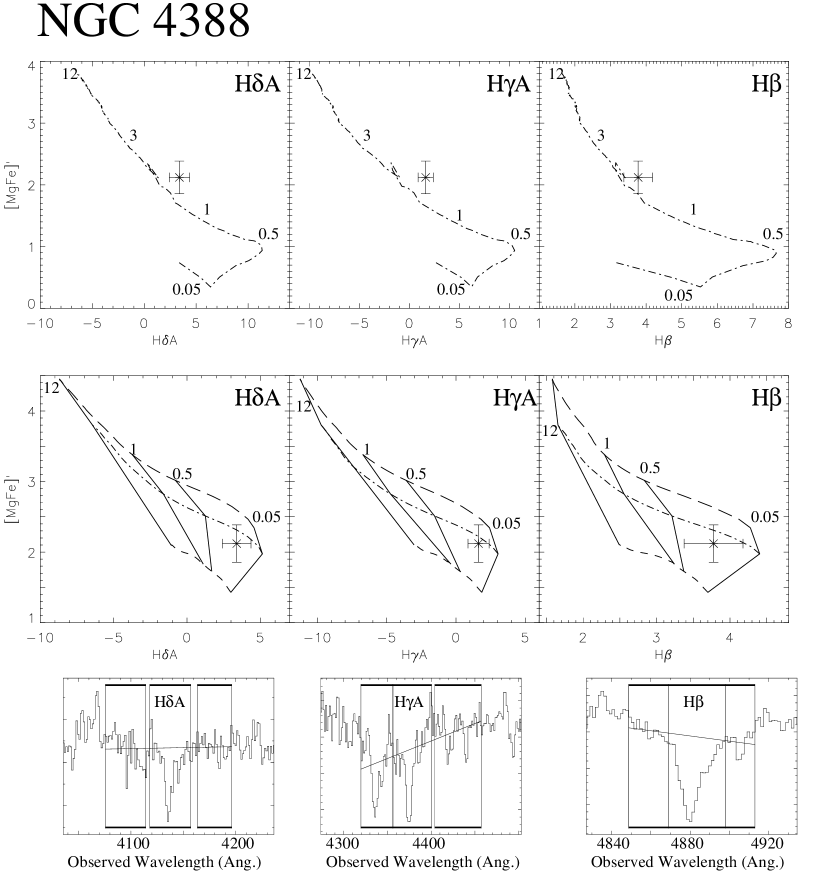
The composite theoretical spectra are analyzed in the same manner as the observed spectra. LECTOR is used to measure the absorption line values of each model, and the absorption line strengths extracted from these spectra allow us to form a line index grid (Figures 6 - 15) from which we can extract a value of for any given galaxy by determining the line of constant age that passes through the absorption line measurement. The errors in are then calculated by determining the line of constant age that pass through the absorption line index the error in the index.

5. The Galaxies
When we introduce three groups of galaxies in the following section, we will quote the luminosities and galaxy morphological types (Table 3), in addition to discussing the star-forming properties. The luminosities (in terms of ) refer to the band luminosities of each galaxy (as determined by 2MASS and assuming a distance of 16 Mpc). While we list the morphological types, it has been pointed out that these types do not work well in the Virgo cluster (Koopmann & Kenney, 1998). In particular, nearly all of the galaxies that we have studied have truncated H disks. The star formation properties are drawn from Koopmann & Kenney (2004), which discusses the star forming properties for 55 Virgo Cluster spirals. Nearly all of our galaxies fall into their “Truncated/Normal” or “Truncated/Compact” categories. Galaxies classified as “Truncated/Normal” have no star formation beyond a “truncation radius” (varies by galaxy between 0.3 - 0.8), but normal star formation interior to that radius. Galaxies classified as “Truncated/Compact” also have an outer disk free from star formation, but have less regular inner disks, with non-axisymmetric star formation confined to the inner kpc. We also report the HI deficiency (DefHI), as defined by Giovanelli & Haynes (1983) and as measured by Chung et al. (2008). This quantity is the logarithmic ratio of the HI mass expected for an isolated spiral galaxy to the HI mass measured in each spiral galaxy. A DefHI=0 indicates an HI-normal galaxy, DefHI=1 indicates a galaxy that has 10 times less HI than expected, and so on. In Table 3, we also quote the projected distance of the galaxies from M87 (), both in terms of measured angular separation and computed linear distance (assuming a distance of 16 Mpc).
For all of the galaxies in our sample, we present a timescale that represents the time since quenching, assuming a quenched star formation model– . The value of quoted is the average of the values determined from HA and HA measurements; the age determined from H measurements tends to be unreliable due to some nebular emission fill-in.
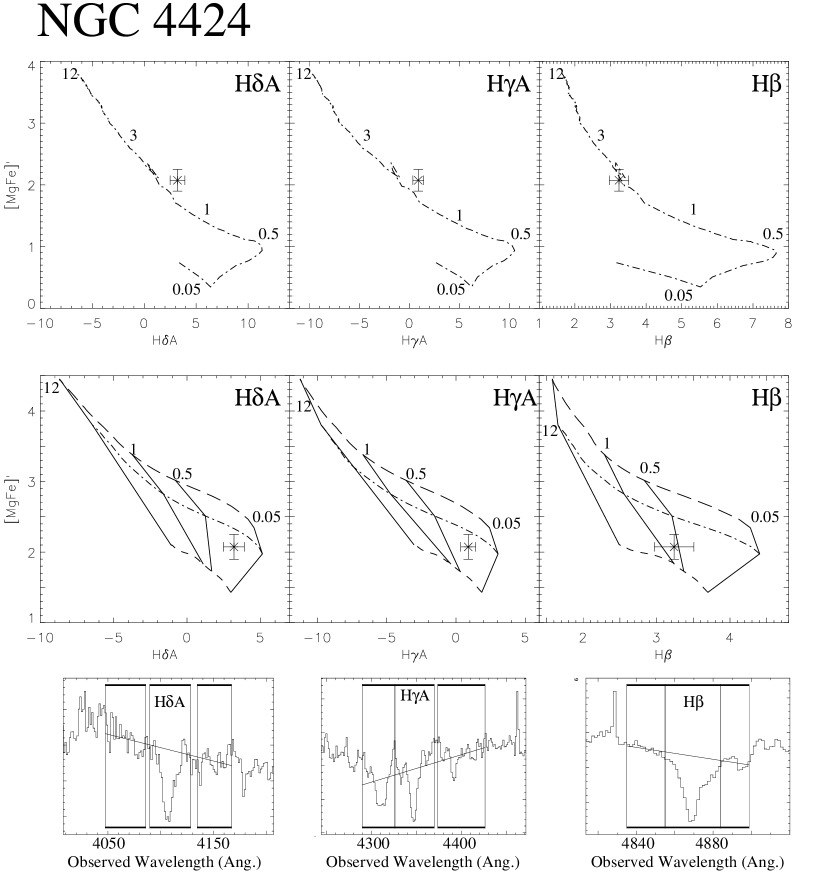
In Figures 6 - 15, we present the optical spectrum results for our sample of Virgo galaxies. Each figure presents the Balmer line strengths (HA, HA, and H) plotted against the [MgFe]’ strength (these line strengths are also listed in Table 4 and the full spectra can be seen in Figures 1 - 3). We compare these line strengths to Starburst99 models for two different star formation histories. The top row of the figures shows an evolutionary track for a SSP model with solar metallicity, with some sample ages (in Gyr) marked along the line. While the star formation history of spiral galaxies is likely markedly different from an SSP, these models are shown here for comparison. Models are displayed in the middle rows for galaxies with a constant star formation rate to the quenching time, then no star formation for a range of metallicities: Z=0.008, Z=0.02 (solar), and Z=0.04. Finally, in the bottom row, we show the region of the spectra with Balmer line absorption. In each case, we determine the time since star formation was quenched by comparing the measured line strengths to SB99 models (also see Tables 5 & 6).
| Galaxy | (deg) | (Mpc) | (km/s) | Type | SF Class††Star Formation Class, as defined by Koopmann & Kenney (2004): (A) anemic, (T/A) truncated/anemic, (T/C) truncated/compact, (T/N) truncated/normal, (T/N [s]) truncated/normal (severe) | L (L∗,K) | DefHI‡‡HI Deficiency from Chung et al. (2008), as defined by Giovanelli & Haynes (1983). | |
|---|---|---|---|---|---|---|---|---|
| NGC 4064 | 8.8 | 2.45 | 913 | SBc(s) | T/C | 0.6 | 75 | 1.75 |
| NGC 4388 | 1.3 | 0.35 | 2524 | Sb | T/N | 0.9 | 82 | 1.18 |
| NGC 4402 | 1.4 | 0.40 | 239 | Sb | T/N | 0.6 | 80 | 0.74 |
| NGC 4405 | 4.0 | 1.11 | 1747 | Sc/S0 | T/N [s] | 0.3 | 53 | 0.98 |
| NGC 4419 | 2.8 | 0.78 | -196 | Sa | T/A | 0.5 | 82 | 1.23 |
| NGC 4424 | 3.1 | 0.87 | 440 | Sa pec | T/C | 0.3 | 63 | 0.75 |
| IC 3392 | 2.7 | 0.75 | 1683 | Sc/Sa | T/N [s] | 0.3 | 70 | 1.16 |
| NGC 4522 | 3.3 | 0.92 | 2328 | Sc/Sb | T/N [s] | 0.5 | 78 | 0.86 |
| NGC 4569 | 1.7 | 0.47 | -220 | Sab(s)I-II | T/N [s] | 3.4 | 66 | 1.52 |
| NGC 4580 | 7.2 | 2.0 | 1033 | Sc/Sa | T/N [s] | 0.5 | 42 | 1.44 |
| Galaxy | HA (Å) | HA (Å) | H (Å) | Mgb (Å) | Fe5270 (Å) | Fe5335 (Å) | [MgFe]′ (Å) |
|---|---|---|---|---|---|---|---|
| NGC 4064 | |||||||
| NGC 4388 | |||||||
| NGC 4402 | |||||||
| NGC 4405 | |||||||
| NGC 4419 | |||||||
| NGC 4424 | |||||||
| IC 3392 | |||||||
| NGC 4522 | |||||||
| NGC 4569 | |||||||
| NGC 4580 |
5.1. Truncated “Normal” Galaxies
A majority of the galaxies in our sample have normal stellar disks and H disks that are truncated at – . The stellar disks, as traced by the band light are generally well-fit by elliptical isophotes and do not show any apparent stellar asymmetries.
5.1.1 Old Outer Stellar Disks
A subset of the Truncated “Normal” Galaxies are those with old outer stellar disks. The H morphology for NGC 4405 (Figure 6), IC 3392 (Figure 7), and NGC 4580 (Figure 8) are virtually identical; all three galaxies have H disks that are small compared to their optical disks and dramatically truncated at a small fraction of their optical radius. NGC 4419 (Figure 9) also has a truncated H disk, but the existing H emission is much more anemic than the other three galaxies. All four of the galaxies have undisturbed outer stellar disks. The outer disk of NGC 4580 is somewhat unusual because, despite a lack of ongoing star formation, there are stellar spiral arms in the outer disk.
For all four galaxies, the optical spectrum is relatively flat, but shows a significant break in the blue region, leading to an overall “red” color. Comparison of the spectra to models tells us that the star formation in all of these galaxies was quenched Myr ago or longer. None show any evidence for extraplanar HI or asymmetric star formation and all are highly HI deficient, with, at most, 10% of their “expected” HI content (Chung et al., 2008; Giovanelli & Haynes, 1983). All of these galaxies have been observed with GALEX and none of them have significant FUV emission in the outer disk, as would be expected for regions of galaxies with no star formation within the last Myr.


5.1.2 Young Outer Stellar Disks
A second subset of those galaxies with undisturbed stellar disks are those that have young outer stellar disks. These include NGC 4388 (Figure 10), NGC 4522 (Figure 11), and NGC 4569 (Figure 12). These galaxies all have disturbed HI spatial distributions (Oosterloo & van Gorkom, 2005; Kenney et al., 2004, 2008). The star formation in all of these disks is highly truncated. NGC 4388 has a small, relatively symmetric H disk, although there is a known H (Yoshida et al., 2002) and HI (Oosterloo & van Gorkom, 2005) tail extending to the northeast. The star formation in the disk of NGC 4522 is strongly truncated, although there is significant extraplanar H and HI emission to the northwest of this galaxy (Kenney et al., 2004). NGC 4569 also has strongly truncated H emission, but has an HI and H arm that extends out from the NE edge of the truncated gas disk (see the H image in Figure 3) (Vollmer et al., 2004; Kenney et al., 2008).
The spectra of the outer disks of these galaxies are either moderately (NGC 4388, NGC 4569) or extremely (NGC 4522) blue, indicating young stellar populations. All of the galaxies show strong Balmer line absorption in the outer disk, with NGC 4522 having extremely strong absorption lines. In addition, all of these galaxies have moderately weak metal lines when compared to galaxies with older stellar populations; this is expected in a population with a higher fraction of A-type stars. In addition, all of these galaxies have significant GALEX emission, both in the FUV and NUV. NGC 4522 is the extreme case once again, as the only galaxy outer disk with stronger FUV emission than NUV emission. By combining UV data and optical spectroscopy, we conclude that star formation persisted in the stripped disk of NGC 4522 up to 50-100 Myr ago (Crowl & Kenney, 2006).


Star formation extends out to in the disk in NGC 4402 (Figure 13), so the stellar surface brightness is relatively low beyond the H truncation radius. Therefore, the stellar population results are somewhat inconclusive. The H index seems to indicate a older population, but other evidence evidence is in conflict with this, perhaps because the H line is partially filled in with emission. First, the GALEX photometry suggest that there is a young stellar population in the outer disk of this galaxy. Secondly, the H line is much stronger than would be expected for an old population (Figure 13). In addition, there is abundant evidence from optical imaging and radio mapping that this galaxy is currently undergoing stripping (Crowl et al., 2005; Vollmer et al., 2007; Murphy et al., 2008). Unfortunately, we are unable to accurately measure the H line in the outer disk of this galaxy because the surface brightness of the stellar disk at this location is too low.

5.2. Galaxies with Complex Interaction Histories
Finally, there are two galaxies in the sample that appear to not have been simply stripped. In the case of NGC 4064, Cortés et al. (2006) note that outer isophotes appear undisturbed, but that there is intense circumnucular star formation in a bar-like feature and disturbed central dust morphology. Cortés et al. (2006) interpret the broadband morphology, H morphology, and disturbed gas distribution as a signature that this galaxy experienced a gravitational interaction, in addition to possibly being stripped of its gas through an interaction with the ICM. NGC 4424 also has compact central star formation in a bar-like feature. In contrast to NGC 4064, the broadband optical appearance of NGC 4424 is also peculiar, with shell-like features and banana-shaped isophotes, suggesting a major gravitational disturbance or a merger (Kenney et al., 1996). Additionally, the central 2-3 kpc show disturbed dust lanes and infalling molecular gas (Cortés et al., 2006).
The spectrum of NGC 4064 shows characteristics of an intermediate-aged population (Figure 14). The spectrum is fairly red and shows strong line blanketing in the blue part of the spectrum. The metal lines (Mgb and NaD) are strong, indicative of a population dominated by giant stars. If we consider the quenching time as extracted from the H and H lines, we find Myr. This age strongly suggests that NGC 4064 was stripped in the cluster outskirts and not in the core. See further discussion in Section 6.3.
The stellar population in NGC 4424 is one of the younger in our sample (Figure 15). This fact is obvious by looking at the composite spectrum, which has a moderately blue color, sloping downward to the red part of the spectrum. Additionally, the Balmer features are quite strong, with all three major lines easily distinguishable. When comparing these data to models, we obtain a quenching time of Myr for the higher order line indices. From the H measurements, we infer that there is some modest residual ionized gas emission in the outer disk, but H and H give a consistent age, and the effect appears to be minor.
GALEX observations of NGC 4424 indicate a moderately young disk and agree with the results from the stellar spectroscopy. The relatively blue GALEX colors indicate that star formation in this galaxy was quenched Myr ago. The timescales from UV imaging and optical spectroscopy only agree for a quenched star formation history; therefore, these data are consistent with constant star formation, followed by an instantaneous quenching.

| Galaxy | (Gyr) | (Gyr) | (Gyr) |
|---|---|---|---|
| NGC 4064 | |||
| NGC 4388 | |||
| NGC 4402 | |||
| NGC 4405 | |||
| NGC 4419 | |||
| NGC 4424 | |||
| IC 3392 | |||
| NGC 4522 | |||
| NGC 4569 | |||
| NGC 4580 |
| Galaxy | d87 (Mpc) | (Myr) |
|---|---|---|
| NGC 4064 | 2.45 | |
| NGC 4388 | 0.35 | |
| NGC 4402 | 0.40 | |
| NGC 4405 | 1.11 | |
| NGC 4419 | 0.78 | |
| NGC 4424 | 0.87 | |
| IC 3392 | 0.75 | |
| NGC 4522 | 0.92 | |
| NGC 4569 | 0.47 | |
| NGC 4580 | 2.01 |
6. Discussion
6.1. Ages and Star Formation Histories from GALEX Observations

Because of the extraordinary sensitivity of GALEX UV observations to the presence of young populations, we can potentially distinguish between different star formation histories using our GALEX observations. In particular, we can extract information about a galaxy’s star formation history by combining analyses of UV emission, which traces a very young stellar population and stellar absorption lines, which give us information about star formation over a longer timescale. There is moderately good agreement between the ages determined by spectral analysis of the outer disk and the GALEX UV observations (Figure 16) when assuming a quenching model. There is a clear sequence from NGC 4522, which has strong Balmer lines (young ages) as determined by spectral measurements and a very hard UV color, to NGC 4580 and IC 3392, which have comparatively weak Balmer lines (older ages) and significantly softer UV colors. While there is a clear sequence, the galaxy measurements are clearly offset from the solar-metallicity models (top panel of Figure 16). As can be seen when comparing to the Z=0.008 models (bottom panel of Figure 16), this is apparently a metallicity effect, showing that there is some degeneracy between star formation histories (i.e. quenching, quenching plus a burst, SSP) and metallicities. Metallicity estimates from the [MgFe]’ index indicate that most of the galaxies have a luminosity-weighted mean metallicity that is intermediate between Z=0.008 and Z=0.02, suggesting that all of the galaxies are consistent with simple quenching of star formation, with the exception of NGC 4522 (See Crowl & Kenney, 2006).
As discussed in Crowl & Kenney (2006), the outer disk of NGC 4522 is most consistent with a small starburst at the end of its outer-disk star formation, such that 2% of the total stellar mass is formed in a very short interval at the time of quenching. As shown in Figure 11, the absorption line indices can not be explained with a quenched star formation history; the Balmer lines in the outer disk are too strong. It is through GALEX observations (shown in Figure 16 and in Crowl & Kenney, 2006) that we are able to obtain a stripping timescale without making an assumption about the star formation history.
6.2. Comparison of Stellar Population Ages to Gas Stripping Simulations

6.2.1 Timescale Comparisons
For three of the galaxies in our sample, we can compare our timescale estimates to estimates from a completely independent analysis. While we observe and model the stellar properties of the stars left behind after ISM-ICM stripping, it is also possible to measure and model the gas that has been stripped from these galaxies. For most galaxies in our sample, the lack of high column density gas near the disk of the galaxy means it is difficult to constrain the interaction parameters from gas modeling. However, for three galaxies, NGC 4522, NGC 4388, and NGC 4569, we are able to compare our results to those from gas stripping models.
We find a very young star formation quenching age for NGC 4522, Myr. This implies that star formation has ended very recently and, indeed, we do see large amounts of extraplanar gas near the disk midplane indicating that stripping is ongoing. A comparison of HI distribution and kinematics with ram-pressure stripping simulations of this galaxy (Vollmer et al., 2006) imply that peak pressure was Myr ago, in excellent agreement with our results.
For NGC 4388, the stellar population analysis indicates that this galaxy was stripped longer ago, Myr. A comparison of the HI distribution and kinematics with a ram pressure simulation of this galaxy (Vollmer & Huchtmeier, 2003) originally suggested that it was stripped Myr ago. This is in reasonable agreement with our data, but shows some difference between the HI simulations and the stellar population ages. However, recent discoveries of more HI much further from the galactic plane (Oosterloo & van Gorkom, 2005) imply that the stripping must have happened longer ago. Specifically, considering how far the HI is from the galactic plane, the time since peak pressure should be revised upward to 200-250 Myr (B. Vollmer, private communication). While these models are based on much less complete HI data than the models for NGC 4522 and NGC 4569, the stripping ages are still in agreement with our estimates from the stellar population analysis.
For NGC 4569, we find the oldest stripping age of the three: Myr. This is precisely the age that Vollmer et al. (2004) derive from simulations of their HI observations of this galaxy. In fact, Vollmer et al. (2004) conclude that the HI features can only be explained if this galaxy is significantly past the peak pressure phase and much of the observed HI is falling back onto the disk. Additionally, Boselli et al. (2006) model the broadband color profile of NGC 4569 and find that the time since interaction is constrained to be less than 400 Myr ago.
6.2.2 Implications of Timescale Comparisons
The agreement of our results with those from stripping simulations (Vollmer & Huchtmeier, 2003; Vollmer et al., 2004, 2006) is remarkable for several reasons. First, the agreement of our estimates for quenching timescales with their stripping timescales is encouraging. While both our stellar population analysis and HI morphology and kinematic analysis are built on a large set of assumptions, the assumptions are generally different for the two methods. While the stellar population analysis relies on assumptions about star formation history and stellar evolution models, the HI simulations rely on how the ICM interacts with the ISM, how gas is transported away from the disk and the ram pressure profile that a galaxy experiences while interacting with the ICM. In the case of these three galaxies, the agreement between the timescales from HI models and the timescales from our stellar population analysis suggests that our timescales are probably correct.
Secondly, the agreement between the ages derived from HI data and stellar population data suggest that the star formation history we’ve assumed is basically correct. While the stellar population models are largely insensitive to how stars formed early on, if there is a large burst at the end of star formation, it would lead to artificially young estimates if modeled with a quenched star formation history. In fact, this can be seen for NGC 4522, where 2% of the stellar mass has to have formed in a burst at the end of star formation in order to match the stellar population data. The overall agreement of ages (even including NGC 4522) indicates that these galaxies only experience, at most, modest bursts at the end of their star formation epoch.
Finally, the agreement of our quenching time and the timescales predicted by gas simulations imply that star formation is cut off when the HI is stripped. The value of tells us how long it’s been since star formation has ended at the location where we measure the stellar populations. In the case of our sample of H truncated galaxies, we have measured just beyond the spatial truncation radius. Because of its relative proximity to the galaxy center, the region just beyond the truncation radius was the most difficult to strip of any region already stripped by the ICM interaction. This implies that this region was stripped by the strongest pressure the galaxy had yet experienced. In the case of galaxies that are past peak pressure (as we believe to be the case for all of our sample), the region just beyond the truncation radius was stripped when the galaxy was experiencing peak or near-peak ICM pressure. The agreement between the time elapsed since peak pressure (from the ram pressure simulations) and the quenching time of star formation ( from our work) means that star formation stops near the time of peak pressure. This agreement implies that gas stripping happens quickly and the stripping of the neutral gas (HI) is roughly coincident with the end of star formation.
6.3. Locations of Stripping in Virgo
In a study of nearby clusters, Solanes et al. (2001) find that, while HI deficiency extends out to 2, the proportion of gas-poor spirals increases toward the center of the clusters. Additionally, Giovanelli & Haynes (1985) find that the HI deficient galactic fraction correlates with cluster X-ray luminosity in the sense that those clusters with higher X-ray luminosities (and presumably higher mass) have more HI-deficient galaxies.
It appears, therefore, that cluster processes are driving HI deficiency and pushing gas out of galaxies. If it is the case that galaxies are only (or primarily) stripped in the core, this implies that there should be a relationship between galaxies’ location in the cluster (Figure 18) and time since star formation quenching. While projection effects limit our understanding of the true distance between a galaxy and M87 (at the core of Virgo), we can set lower limits to the clustercentric distance by using the projected distance from M87 (). These are only lower limits because the galaxies are also displaced from M87 by an unknown amount along the line of sight.


In Figure 19, we show the distance of the galaxies from M87 plotted against for each galaxy. The dashed line in Figure 19 shows the distance a galaxy could travel in a given time if its velocity was 1500 km/s in the plane of the sky. The average line-of-sight velocity of a galaxy in Virgo relative to the cluster is km/s, so 1500 km/s is a generous estimate for most galaxies. Any galaxies to the right of the line in the figure are either too far out to have been stripped in the cluster core or have unusually large velocities in the cluster. This is simply a matter of travel time. Assuming some reasonable velocity, it is impossible for the galaxies to the right of the line to have reached their current location in the time since star formation ended. Therefore, they can not have been stripped in the core. While several galaxies are consistent with being stripped in the core, there are three galaxies clearly to the right of the line and one galaxy marginally to the right of the line; we will take them case by case.
6.3.1 NGC 4522
NGC 4522, despite being far from the cluster core, has an exceedingly young population that precludes it from being stripped in the core. In addition to its young population, the large amounts of extraplanar HI and H, and enhanced polarized radio continuum emission and flat radio spectral index along the leading edge all point to ongoing strong ram pressure. Simple estimates of ram pressure are too low by a factor of 10 to adequately explain the observed stripping (Kenney et al., 2004). However, the “simple” estimates of ram pressure assume a smooth, static ICM. The existence of galaxies like NGC 4522 suggest that the ICM is either dynamic or “lumpy.” Observed ICM shocks (Shibata et al., 2001) suggest that the ICM may be moving with significant velocity in the region of NGC 4522. In Crowl & Kenney (2006), we include a more complete discussion of the stellar populations of this stripped spiral galaxy.
6.3.2 NGC 4580
NGC 4580 is quite far from the cluster core but has an intermediate-aged outer stellar disk ( Myr). In many ways, NGC 4580 is a prototypical stripped spiral, with normal star formation within a well-defined radius and no star formation beyond, but with an undisturbed stellar disk. One slightly peculiar aspect of this galaxy is the presence of stellar spiral arms beyond the truncation radius. These stellar spiral arms in the outer disk are stronger than in any of the other sample galaxies with comparable quenching times. Without gas, the spiral arms should dissipate relatively quickly, perhaps within a few galaxy rotation periods, but it appears these arms have persisted.
6.3.3 NGC 4064
NGC 4064 is very far out in the cluster, the furthest from M87 of any galaxy in our sample. Despite this, its stellar population points to star formation quenching only 425 Myr ago. It is possible that this galaxy was stripped of its star forming gas by an interaction with the ICM, but if that is the case, it did not happen in the core of Virgo. Optical imaging, kinematics, and CO interferometry (Cortés et al., 2006) suggest that this galaxy has recently undergone a minor gravitational interaction. However, this by itself is likely to not be enough to remove the large amount of gas that this galaxy has apparently lost. The HI is truncated well within the stellar disk of NGC 4064, demonstrating that the gas was removed without significantly disrupting the stars.
6.3.4 NGC 4424
NGC 4424 is modestly below the 1500 km/s line and has a relatively young stripping age. This, coupled with the large HI tail observed in this galaxy (Chung et al., 2007), suggests that this galaxy recently underwent an interaction. Optical morphology and stellar kinematics (Cortés et al., 2006) demonstrate that NGC 4424 has recently experienced a significant gravitational interaction. Such interactions are typically more common in the cluster outskirts, where the relative velocities of galaxies are lower. However, the large HI tail pointing toward M49 (Chung et al., 2007) suggests that a collision with that galaxy may have played a role in the stripping of the HI from NGC 4424. While this is clearly not the only environmental effect this galaxy has experienced, it appears that a ram pressure interaction did play a role in quenching the star formation in NGC 4424.
6.3.5 Galaxies Stripped in the Core
The remaining galaxies fall near the km/s line. This implies that, within the regions probed by our spectroscopic observations, star formation was interrupted on a recent core passage. If the galaxies had been stripped on a previous passage through the Virgo core, they would fall to the left of the line shown in the figure; that is, they would be closer to the cluster core than their stripping age and a travel speed of 1500 km/s would imply. The observation that these galaxies are at the minimum age that their distances allow suggests that the current appearance of these galaxies, with truncated HI and H disks, may be a short-lived state. One possibility is that these galaxies are stripped further on a subsequent core passage. Note that because has only been determined just beyond the truncation radius, we cannot comment on how much of the outer disk was recently stripped; it’s possible that only a narrow annulus of gas was stripped ago. As a galaxy enters a cluster, much of its gas is likely stripped on its first core passage but models suggest that, in a moderate-sized cluster like Virgo, it’s unlikely that all of the gas will be stripped from an 0.5 or 1.0 galaxy on that first passage (e.g. Vollmer et al., 2001). However, on subsequent orbits, gas at smaller and smaller radii may be stripped. This is particularly likely if cluster conditions and galaxy orbits change, which are both likely in an unrelaxed cluster. However, our results appear to show that some fraction of star-forming gas was truncated on these galaxies’ last passage through the cluster core.
6.4. Are Stripped Spirals “Failed” Passive Spirals?
With the exception of small star-forming disks in their centers, the observed stripped spirals in our sample are similar to the “passive spirals” observed at higher redshift (Dressler et al., 1999). It may be that Virgo is not massive enough to entirely strip the ISM from the spiral galaxies we have observed. However, in the largest clusters, the ICM density is higher by a factor of and the relative velocities are higher by a factor of ; this means that ram pressure is higher by a factor of in these clusters. Therefore, it may be that the true passive spirals are only found in higher mass clusters such as those of Dressler et al. (1999) and that only truncated spirals are found in more modest clusters like Virgo. While our sample is not a complete sample of truncated spirals in Virgo, it is still interesting that none of the stripped spirals in our sample were stripped more than 500 Myr ago. If this observed state (truncated star-forming disk) were long-lived, we might expect to see stellar populations with a range of ages; from very newly stripped disks (i.e. NGC 4522 or NGC 4388) to disks that had been stripped several gigayears ago. Those galaxies with the most regular, symmetric H disks tend to have the oldest values of (i.e. NGC 4405, IC 3392, NGC 4580), but those values are all less than or equal to 500 Myr, a relatively short time compared to the orbital time in the cluster. We do not know whether the star formation in these galaxies will fade or the star forming gas will be completely stripped on a subsequent core passage, but from the stellar populations of the outer disk, it appears that their current state is not long-lived.
6.5. Metallicities of Galaxy Populations
It is generally understood that galaxies create metals through stellar evolution processes. This means that, broadly, there is an age-metallicity relationship: in a given galaxy, the stars that form later tend to be more metal rich than the stars that formed first. While this is broadly true, the properties of any one region of a galaxy can be largely determined by the local star formation history. In order to avoid adding free parameters to the SB99 models, we summed stellar models at a constant metallicity; all stars in a given model (regardless of the age) have a fixed metallicity. This is, of course, a gross over-simplification of the stellar population of the galaxy, but due to the relative insensitivity of the Balmer indices to metallicity (particularly at the young ages that are most relevant for our study), we have chosen not to model any sort of enrichment history. As a result, the metallicities implied by the [MgFe]′ index are the luminosity-weighted average metallicity for the entire galaxy and not the metallicity of the current generation of stars. It should be noted that the luminosity-weighted average metallicity is slightly sub-solar for most of our sample of spiral galaxies. This is expected, as galaxies with solar-metallicity current generation stars likely have a luminosity-weighted mean luminosity that is slightly sub-solar; in galaxies with realistic enrichment histories, the older stellar generations have fewer metals than the current stellar generation.
7. Summary
We have presented observations of several gas-stripped spiral galaxies in the Virgo cluster. These are galaxies that have apparently been partially stripped of their gas by interactions with the ICM, but all still have ongoing star formation in their centers. We present optical spectroscopy that demonstrates that the outer disks were stripped of their star-forming gas within the last 500 Myr. We find that, while some galaxies are consistent with being stripped in the cluster core, others appear to have been stripped outside the core. There is evidence that some outer cluster galaxies have undergone gravitational interactions, but others appear consistent with ram pressure stripping. These galaxies provide evidence that the ICM is not static and smooth. In at least one case (NGC 4522), there is independent evidence that the ICM pressure is stronger than simple estimates would predict. If the effects of ram pressure are important well outside the cluster core, the HI deficiencies observed at large radii in clusters (Solanes et al., 2001) can be explained by ISM-ICM interactions. These interpretations imply that the “reach” of the ICM extends well beyond the cluster core and that ISM-ICM interactions may have a greater impact on morphologically-driven galaxy evolution than simple ICM models would suggest.
Furthermore, for three galaxies that have been modeled by gas dynamics simulations, we find agreement between our determined quenching times and those simulations. These results imply that our galaxies experienced essentially constant star formation prior to being quenched and that there was, at most, a modest starburst at the time of quenching. It also suggests that star formation is effectively halted by these strong ICM interactions and molecular gas is effectively stripped quickly by ICM pressure.
Taken together, our observations show that gas stripping is an important process in environmentally-driven galaxy evolution. As ISM-ICM interactions are capable of rapidly halting star formation, it is reasonable to suppose that a significant passive galaxy population may evolve from spiral galaxies in clusters. While there may be multiple paths to S0 galaxies, it appears that, in Virgo, we are observing a process that can efficiently halt star formation in cluster spiral galaxies.
We gratefully acknowledge the advice and assistance of Jim Rose, which were critical at an early stage of this project. Discussions with Jacqueline van Gorkom, Aeree Chung, Bernd Vollmer, and Bob Zinn were also crucial in advancing the science case of our paper. Additionally, we are grateful to David Schiminovich for providing assistance and support with the GALEX data, as well as comments on the project and paper. We gratefully acknowledge NASA’s support for construction, operation, and science analysis for the GALEX mission, developed in cooperation with CNES of France and the Korean Ministry of Science and Technology. Finally, we thank the anonymous referee for comments that improved this paper. This research is supported by NSF Grant AST-0071251.
References
- Bershady et al (2004) Bershady, M. A., Andersen, D. R., Harker, J., Ramsey, L. W., & Verheijen, M. A. W. 2004, PASP, 116, 565
- Böhringer et al. (1994) Böhringer, H., Briel, U. G., Schwarz, R. A., Voges, W., Hartner, G.,& Trumper, J. 1994, Nature, 368, 828
- Boselli et al. (2006) Boselli, A., Boissier, S., Cortese, L., Gil de Paz, A., Seibert, M., Madore, B. F., Buat, V., & Martin, D. C. 2006, ApJ, 651, 811
- Bruzual & Charlot (2003) Bruzual, G., & Charlot, S. 2003, MNRAS, 344, 1000
- Christlein & Zabludoff (2004) Christlein, D., & Zabludoff, A. I. 2004, ApJ, 616, 192
- Chung et al. (2007) Chung, A., van Gorkom, J. H., Kenney, J. D. P., & Vollmer, B. 2007, ApJ, 659, L115
- Chung et al. (2008) Chung, A. et al. 2008, in prep
- Cortés et al. (2006) Cortés, J. R., Kenney, J. D. P., & Hardy, E. 2006, AJ, 131, 747
- Crowl et al. (2005) Crowl, H. H., Kenney, J. D. P., van Gorkom, J. H., & Vollmer, B. 2005, AJ, 130, 65
- Crowl & Kenney (2006) Crowl, H. H. & Kenney, J. D. P. 2006, ApJ, 649, L75
- Dressler (1980) Dressler, A. 1980, ApJ, 236, 351
- Dressler et al. (1999) Dressler, A., Smail, I., Poggianti, B. M., Butcher, H., Couch, W. J., Ellis, R. S., & Oemler, A. J. 1999, ApJS, 122, 51
- Faber et al. (1985) Faber, S. M., Friel, E. D., Burstein, D., & Gaskell, C. M. 1985, ApJS, 57, 711
- Giovanelli & Haynes (1983) Giovanelli, R. & Haynes, M.P. 1983, AJ, 88, 881
- Giovanelli & Haynes (1985) Giovanelli, R., & Haynes, M. P. 1985, ApJ, 292, 404
- Kauffmann et al. (2004) Kauffmann, G., White, S. D. M., Heckman, T. M., Ménard, B., Brinchmann, J., Charlot, S., Tremonti, C., & Brinkmann, J. 2004, MNRAS, 353, 713
- Kenney et al. (1996) Kenney, J. D. P., Koopmann, R. A., Rubin, V. C., & Young, J. S. 1996, AJ, 111, 152
- Kenney et al. (2004) Kenney, J. D. P., van Gorkom, J. H., & Vollmer, B. 2004, AJ, 127, 3361
- Kenney et al. (2008) Kenney, J. D. P. et al. 2008, in prep.
- Koopmann & Kenney (1998) Koopmann, R. A., & Kenney, J. D. P. 1998, ApJ, 497, L75
- Koopmann, Kenney, & Young (2001) Koopmann, R. A., Kenney, J. D. P., & Young, J. 2001, ApJS, 135, 125
- Koopmann & Kenney (2004) Koopmann, R. A., & Kenney, J. D. P. 2004, ApJ, 613, 866
- Leitherer et al. (1999) Leitherer, C., et al. 1999, ApJS, 123, 3
- Li & Draine (2001) Li, A., & Draine, B. T. 2001, ApJ, 554, 778
- Martin et al. (2005) Martin, D. C., et al. 2005, ApJ, 619, L1
- Martins et al. (2005) Martins, L. P., Delgado, R. M. G., Leitherer, C., Cerviño, M., & Hauschildt, P. 2005, MNRAS, 358, 49
- Moran et al. (2006) Moran, S. M., Ellis, R. S., Treu, T., Salim, S., Rich, R. M., Smith, G. P., & Kneib, J.-P. 2006, ApJ, 641, L97
- Morrissey et al. (2005) Morrissey, P., et al. 2005, ApJ, 619, L7
- Murphy et al. (2008) Murphy, E., Kenney, J.D.P., Helou, G., Chung, A., & Howell, J.H. 2008, ApJ, submitted
- Oosterloo & van Gorkom (2005) Oosterloo, T., & van Gorkom, J. 2005, A&A, 437, L19
- Osterbrock (1989) Osterbrock, D.E. Astrophysics of Planetary Nebulae and Active Galactic Nuclei, University Science Books, 1989
- Poggianti et al. (2006) Poggianti, B. M., et al. 2006, ApJ, 642, 188
- Schlegel et al. (1998) Schlegel, D. J., Finkbeiner, D. P., & Davis, M. 1998, ApJ, 500, 525
- Shibata et al. (2001) Shibata, R., Matsushita, K., Yamasaki, N. Y., Ohashi, T., Ishida, M., Kikuchi, K., Böhringer, H., & Matsumoto, H. 2001, ApJ, 549, 228
- Shioya et al. (2004) Shioya, Y., Bekki, K., & Couch, W. J. 2004, ApJ, 601, 654
- Solanes et al. (2001) Solanes, J. M., Manrique, A., Garcia-Gómez, C., González-Casado, G., Giovanelli, R., & Haynes, M. P. 2001, ApJ, 548, 97
- Thomas et al. (2003) Thomas, D., Maraston, C., & Bender, R. 2003, MNRAS, 339, 897
- Vazdekis (1999) Vazdekis, A. 1999, ApJ, 513, 224
- Vollmer et al. (2001) Vollmer, B., Cayatte, V., Balkowski, C., & Duschl, W. J. 2001, ApJ, 561, 708
- Vollmer & Huchtmeier (2003) Vollmer, B., & Huchtmeier, W. 2003, A&A, 406, 427
- Vollmer et al. (2004) Vollmer, B., Balkowski, C., Cayatte, V., van Driel, W., & Huchtmeier, W. 2004, A&A, 419, 35
- Vollmer et al. (2006) Vollmer, B., Soida, M., Otmianowska-Mazur, K., Kenney, J. D. P., van Gorkom, J. H., & Beck, R. 2006, A&A, 453, 883
- Vollmer et al. (2007) Vollmer, B., Soida, M., Beck, R., Urbanik, M., Chyży, K. T., Otmianowska-Mazur, K., Kenney, J. D. P., & van Gorkom, J. H. 2007, A&A, 464, L37
- Worthey (1994) Worthey, G. 1994, ApJS, 95, 107
- Worthey et al. (1994) Worthey, G., Faber, S. M., Gonzalez, J. J., & Burstein, D. 1994, ApJS, 94, 687
- Worthey & Ottaviani (1997) Worthey, G., & Ottaviani, D. L. 1997, ApJS, 111, 377
- Yoshida et al. (2002) Yoshida, M., et al. 2002, ApJ, 567, 118