T-Lyr1-17236: A Long-Period Low-Mass Eclipsing Binary
Abstract
We describe the discovery of a 0.68+0.52 eclipsing binary (EB) with an 8.4-day orbital period, found through a systematic search of ten fields of the Trans-atlantic Exoplanet Survey (TrES). Such long-period low-mass EBs constitute critical test cases for resolving the long standing discrepancy between the theoretical and observational mass-radius relations at the bottom of the main sequence. It has been suggested that this discrepancy may be related to strong stellar magnetic fields, which are not properly accounted for in current theoretical models. All previously well-characterized low-mass main sequence EBs have periods of a few days or less, and their components are therefore expected to be rotating rapidly as a result of tidal synchronization, thus generating strong magnetic fields. In contrast, the binary system described here has a period that is over three times longer than previously characterized low-mass main sequence EBs, and its components rotate relatively slowly. It is therefore expected to have a weaker magnetic field and to better match the assumptions of theoretical stellar models. Our follow-up observations of this EB yield preliminary stellar properties that suggest it is indeed consistent with current models. If further observations confirm a low level of activity in this system, these determinations would provide support for the hypothesis that the mass-radius discrepancy is at least partly due to magnetic activity.
1 Introduction
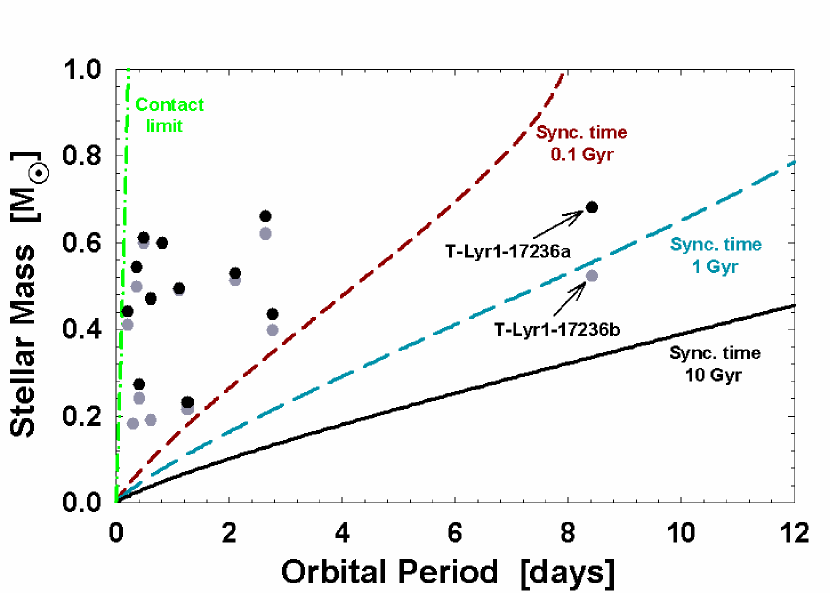
Despite a great deal of work that has been done to understand the structure of low-mass ( 0.8 ) main sequence stars (e.g., Chabrier & Baraffe, 2000), models continue to underestimate their radii by as much as 15% (Lacy, 1977a; Torres & Ribas, 2002; Ribas, 2006). This is a significant discrepancy, considering that for solar-type stars the agreement with the observations is typically within 1–2% (Andersen, 1991, 1998). In recent years an intriguing hypothesis has been put forward, suggesting that strong magnetic fields may have bloated these stars, either through chromospheric activity (e.g., Ribas, 2006; Torres et al., 2006; López-Morales, 2007; Chabrier et al., 2007) or through magnetically induced convective disruption (Torres et al., 2006). Such strong magnetic fields are expected to be formed by the dynamo mechanism of rapidly rotating stars.111Dynamo theory predicts that this mechanism operates only in partially convective stars. However, the strong magnetic activity observed in fully convective low-mass stars indicates that they also possess a mechanism for generating strong magnetic fields (see Browning & Basri, 2007, and references therein). To test this hypothesis, one needs to measure both the masses and radii of low-mass stars, which thus far can be done most accurately with eclipsing binary (EB) systems. However, all well characterized low-mass main sequence EBs have orbital periods shorter than three days (see Table 1) and are therefore expected to have synchronization timescales shorter than 100 Myr (Zahn, 1977, 1994, see Figure 1 and further description in § 6). As a result of these short periods and short synchronization timescales, the rotations of these binary components are expected to have accelerated to the point that they now match the rapid angular velocity of their orbits. With such rapid rotations, these binary components could have a wide range of dynamo-induced magnetic field strengths. To better constrain current stellar models, we set out to find systems with slowly rotating components. Such systems would presumably have comparably weak magnetic fields, thus being more consistent with the model assumptions. Furthermore, by comparing the mass-radius relations of binary components with well determined levels of magnetic activity, one could test various magnetic disruption models.
We note here that in addition to EB analysis, long-baseline optical interferometry has also been used recently to measure the radii of nearby low-mass stars (Lane et al., 2001; Ségransan et al., 2003; Berger et al., 2006). While these stars are single and are therefore expected to rotate slowly, their masses can only be estimated through empirical mass-luminosity relations or other indirect methods. Those determinations are thus less fundamental, in a sense, and arguably of lesser value for accurately constraining stellar models and testing the magnetic disruption hypothesis.
2 Initial Photometric Observations
T-Lyr1-17236 was first identified as a likely low-mass EB candidate in the Devor et al. (2008) catalog, following a systematic analysis of the light curves (LCs) within ten fields of the Trans-atlantic Exoplanet Survey (TrES; Alonso et al., 2004). TrES employs a network of three automated telescopes to survey fields of view. To avoid potential systematic noise, we performed our initial search using data from only one telescope, Sleuth, located at the Palomar Observatory in Southern California (O’Donovan et al., 2004), and we combined additional data at subsequent follow-up stages. Sleuth has a 10-cm physical aperture and a photometric aperture radius of 30″. The number of LCs in each field ranges from 10,405 to 26,495, for a total of 185,445 LCs. The LCs consist of 2000 Sloan -band photometric measurements binned to a 9-minute cadence. The calibration of the TrES images, identification of stars therein, and the extraction and decorrelation of the LCs are described elsewhere (Dunham et al., 2004; Mandushev et al., 2005; O’Donovan et al., 2006, 2007).
An automated pipeline was used to identify and characterize the
EBs among the TrES LCs. This pipeline has been described in detail
in a previous paper (Devor et al., 2008). At the heart of this analysis
lie two computational tools: the Detached Eclipsing Binary Light
curve fitter222The DEBiL source code, utilities, and
example files are available online at:
http://www.cfa.harvard.edu/jdevor/DEBiL.html
(DEBiL; Devor, 2005), and the Method for Eclipsing Component
Identification333The MECI source code and running examples
are available online at:
http://www.cfa.harvard.edu/jdevor/MECI.html
(MECI; Devor & Charbonneau, 2006a, b). DEBiL fits each LC to a
model of a detached EB that consists of two
luminous, limb-darkened spheres that describe a Newtonian two-body
orbit. MECI then incorporated some of the DEBiL results, and
together with 2MASS color information (Skrutskie et al., 2006), refit
each LC to a model that is constrained by the
solar metallicity Yonsei-Yale theoretical isochrones (Yi et al., 2001; Kim et al., 2002). Thus, using only photometric data, the DEBiL/MECI pipeline
provided initial estimates of the absolute physical properties of
each EB. These estimates were then used to locate promising
candidates for follow-up.
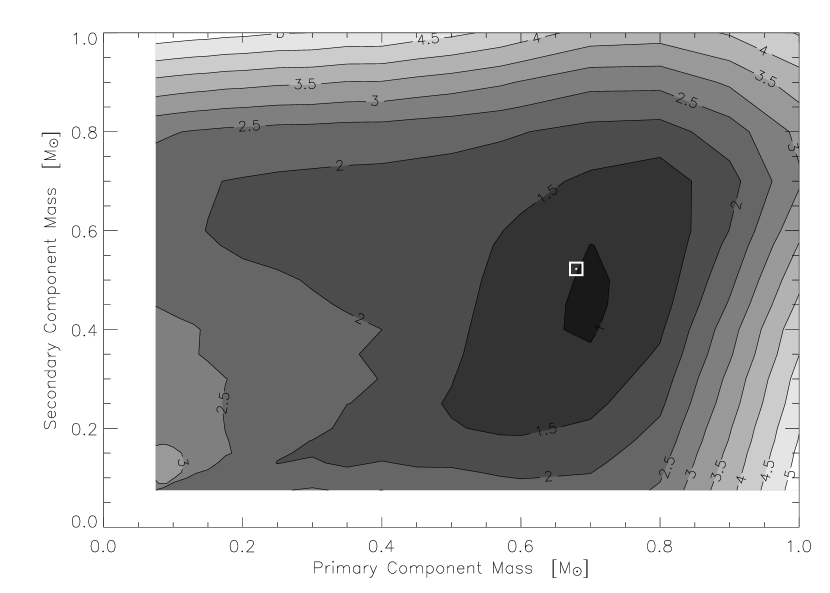
Using this pipeline a total of 773 EBs were identified within the TrES dataset. Of these, 427 EBs were both detached and had small out-of-eclipse distortions, thereby enabling the DEBiL/MECI pipeline to estimate their component masses. These results, together with many other properties, are listed for each EB in an online catalog444http://www.cfa.harvard.edu/jdevor/Catalog.html (Devor et al., 2008). Of these characterized EBs, we then identified a handful of promising long-period low-mass candidates and chose one, T-Lyr1-17236 ( days ; see Table 2 for additional information), for further follow-up and analysis. As with all of our low-mass candidates, we repeated the MECI analysis using the Baraffe et al. (1998) solar-metallicity isochrones (with a mixing length parameter of ), which are more accurate than the Yonsei-Yale isochrones in this regime. The resulting MECI mass-mass likelihood contour plot of T-Lyr1-17236 is shown in Figure 2. Since the MECI analysis incorporates data from theoretical stellar models, we cannot use it to constrain stellar models. Rather, once we identified the candidate, we followed it up photometrically and spectroscopically, and used only these follow-up data to derive the binary’s absolute properties.
3 Follow-up Photometric Observations
In order to characterize T-Lyr1-17236 we combined photometric data from four telescopes: (1) Sleuth and (2) PSST (Dunham et al., 2004) of the TrES network, (3) the Instituto de Astrofísica de Canarias telescope (IAC80; Galan & Cobos, 1987), and (4) the Hungarian Automated Telescope Network (HATNet; Bakos et al., 2004). With the exception of the IAC80, we obtained our photometric data from archived survey datasets that were intended for locating exoplanets.
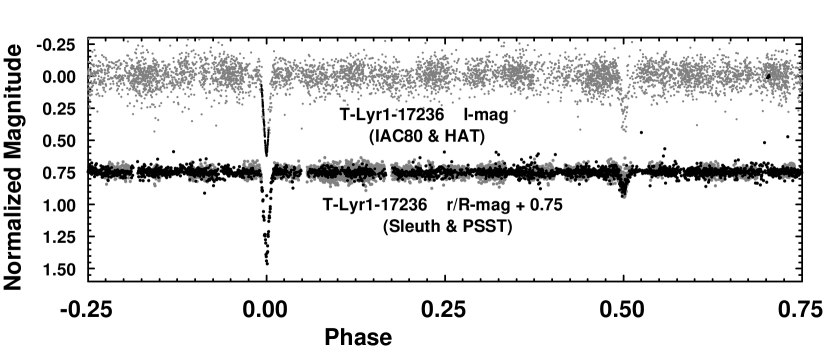
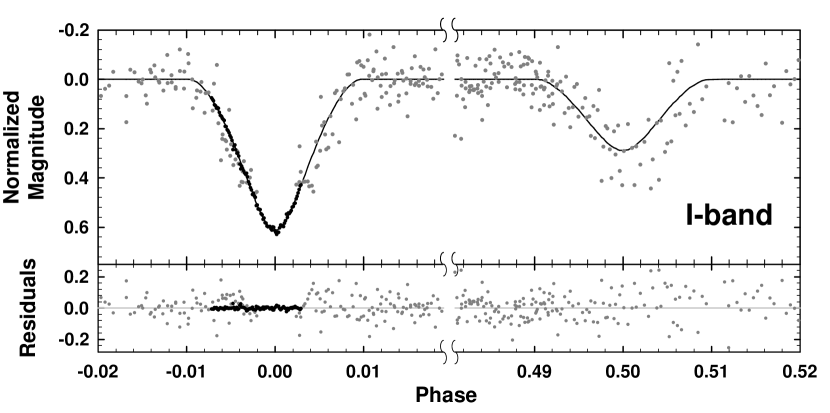
As part of the TrES network (see § 2), Sleuth and PSST are operated similarly. However, PSST, which is located at the Lowell Observatory in Arizona, observes in the Johnson -band whereas Sleuth observes in the Sloan -band (see Figures 3 and 4). Furthermore, PSST has a 20″ photometric aperture radius compared to Sleuth’s 30″ radius, which provides PSST with a higher resolving power than Sleuth. However, the smaller aperture of PSST also causes it to have noisier photometry, with an RMS of 0.031 mag for T-Lyr1-17236, compared to the Sleuth photometry that has an RMS of 0.028 mag. Though these differences are small, they would have affected our analysis. We therefore chose not to use the PSST data for fitting the photometric model, though we did use them to improve the determination of the orbital period and the epoch of eclipse (see § 5).
In an effort to better constrain the eclipses of T-Lyr1-17236, we obtained data from the IAC80, an 82-cm aperture telescope with a field of view, located at the Observatorio del Teide in the Canary Islands. We produced an -band LC at a 1.3-minute cadence using the 10241024-pixel Tromso CCD Photometer (TCP), resulting in 0.008 mag RMS photometry for T-Lyr1-17236. Unfortunately, we were only able to observe a primary eclipse with the IAC80. We therefore incorporated archival HATNet observations so as to provide coverage of the secondary eclipse in a similar bandpass (see Figures 3 and 5).
HATNet is a network of six 11-cm aperture, fully-automated telescopes (HATs) located at the F. L. Whipple Observatory in Arizona and at the Submillimeter Array site atop Mauna Kea, Hawaii. The HATs have an field of view, a response that peaks in the -band, and operate at a 5.5-minute cadence. To reduce the photometric noise, the HAT point spread function (PSF) is broadened to a 15″ aperture radius through microstepping (Bakos et al., 2002). Even so, the HATNet photometric RMS for T-Lyr1-17236 was comparably large, at 0.084 mag. Nevertheless, to provide more complete coverage of the primary and secondary eclipses in the -band, we combined the IAC80 observations with data from HAT-7 (Whipple Observatory) and from HAT-8 (Mauna Kea). Due to the very different characteristics of these two systems, however, we chose not to adopt any of the model parameters derived from these data, and only used these results as an independent confirmation of the Sleuth -band LC analysis.
4 Spectroscopic Observations
T-Lyr1-17236 was observed spectroscopically with two instruments: The Near-Infrared Spectrometer (NIRSPEC; McLean et al., 1998, 2000) at the W. M. Keck Observatory in Hawaii, and the Tillinghast Reflector Echelle Spectrograph (TRES; Szentgyorgyi & Fűrész, 2007), installed on the 1.5-meter Tillinghast telescope at the F. L. Whipple Observatory in Arizona.
NIRSPEC was operated using a 3-pixel slit (0.432″) and an N7 blocking filter, thus producing a spectral resolving power of R . The duration of the exposures, which ranged from 420 to 900 seconds, was adjusted according to observing conditions. The spectra were gathered in two consecutive nods, producing a total of five NIRSPEC nod pairs. The nods of each pair were then subtracted one from the other, removing much of the sky emission. We extracted the spectra of both nods using the optimal extraction procedure outlined in Horne (1986), and then co-added the two resulting one-dimensional spectra. We calibrated the wavelengths of the resulting spectrum using its atmospheric telluric features, and then corrected for both the telluric absorption and the blaze of the spectrograph by dividing this spectrum by the spectrum of an A0V-type star (HR 5511). Finally, we cross-correlated each spectrum with the spectrum of an M0.5V template star (GJ 182). To this end, we used a single NIRSPEC order (2290–2320 nm), which is within the -band, and has a scale of nm pixel-1 at its center. This order covers the CO 2-0 bandhead, which includes a rich forest of R-branch transition lines, as well as many telluric absorption features due to methane in the Earth’s atmosphere. The advantages offered by this spectral region and the details of the instrument setup are described in Blake et al. (2008).
TRES is a high-resolution fiber-fed optical echelle spectrograph designed to cover a large range of wavelengths (390–934 nm) in 51 orders. We employed the medium-size fiber (2.3″) so as to cover the full stellar PSF, while providing a spectral resolving power of R . Following each of our three 900–1000 second exposures, the TRES data were read from a 46381090-pixel CCD, which we set to a 22 binning mode for a more rapid read-out. We then used a dedicated IRAF toolset to process and extract 51 spectral orders simultaneously, ultimately producing 2319 data points along each order. The IRAF processing of the TRES data involved merging the mosaic FITS files, removing cosmic ray hits, flattening fringing effects, and then extracting the orders. We wavelength-calibrated the TRES spectra using Thorium-Argon (ThAr) exposures, and then corrected the telluric absorption and spectroscopic blazing by dividing each spectrum by a TRES spectrum of a rapidly-rotating B0IV-type star (HR 264). Though TRES produces 51 spectral orders, we used only four of them, covering wavelengths of 665–720 nm (similar to the -band), and having a post-binning scale of 0.0065 nm pixel-1. These orders contain a diverse array of absorption features, including those of TiO, Fe I, Ca I, Ni I, and Cr I. We limited ourselves to these orders because at shorter wavelengths there was insufficient flux from our red target, while at longer wavelengths the spectra were dominated by telluric absorption features, produced largely by terrestrial O2 and H2O. We cross-correlated these four orders with the corresponding orders of an M1.5V template star (GJ 15A, also known as GX And A) and averaged their cross-correlation functions. We repeated this final calculation using the Zucker (2003) maximum-likelihood method, which reproduced our results to within a fraction of their uncertainties, although with slightly larger errors.555The Zucker (2003) method is more accurate than simple cross-correlation averaging for large N. However, because it takes the absolute value of the correlation, it loses some information and effectively increases the noise baseline. This increased noise will negate its advantage when combining a small number of correlations, as is the case in our TRES analysis ().
In total, we produced five RV measurements of each component with NIRSPEC and three with TRES. In all cases we were able to measure the RVs of both binary components by employing a cross-correlation method that transforms the spectra to Fourier-space using the Lomb-Scargle algorithm (Press et al., 1992). This method allowed us to cross-correlate spectra with arbitrary sampling, without having to interpolate or resample them onto an equidistant grid. We then multiplied the Fourier-transformed target and template spectra, inverse-Fourier-transformed the product, and normalized it. Since the resulting two peaks in the cross-correlation functions were always well separated, we were able to fit each with a parabola, and thus measure their offsets and widths. The uncertainties of these RVs are somewhat difficult to determine with our procedures, but tests indicate that they are approximately 1.0 km s-1 and 1.4 km s-1 for the primary and secondary in our NIRSPEC spectra, and about 0.5 km s-1 and 1.2 km s-1 in our TRES spectra. These internal errors are adopted below in the spectroscopic analysis, but have relatively little effect on the results. Finally, the RVs were transformed to the barycentric frame, and the TRES RV measurements were further offset by 2.82 km s-1 in order to place them on the same reference frame as the NIRSPEC measurements, which were obtained with a different template (GJ 182). This offset was determined by including it as an additional free parameter in the Keplerian RV model (see § 5). Once the offset was determined, we held its value fixed in all subsequent analyses. The final velocities are listed in Table 3 and include this offset. Note that these listed RVs are all relative to GJ 182, for which Montes et al. (2001) have measured the value km s-1.
5 Orbital Analysis
We began our analysis by determining the orbital period () and the epoch of primary eclipse (), and constraining the eccentricity () of T-Lyr1-17236 through eclipse timing. The times of eclipse determined from our photometric observations listed in Table 4. Since our data span 3.5 years, we were able to determine the period to an accuracy of 3 seconds (see Table 5). To estimate the binary’s eccentricity, we first measured the observed minus calculated () timing difference between the primary and secondary eclipses in all available LCs, which provided an upper bound of , where is the argument of periastron (see Figure 6). Though and cannot be determined separately in this way, this result indicates that the orbit of T-Lyr1-17236 is likely to be circular or very nearly so. This conclusion is further supported by a weaker upper limit of , obtained through preliminary LC model fitting (see below). Theoretical estimates (Zahn, 1977, 1978, 1994) of this binary suggest a circularization timescale of Gyr (see also Devor et al., 2008). Being many times the age of the binary, this long timescale suggests that T-Lyr1-17236 formed in a circular orbit. However, this timescale value is an instantaneous estimate for the current epoch, and is likely to have been significantly different in the past (see Zahn & Bouchet, 1989; Mazeh, 2008, and references therein). Therefore, it is quite possible that the binary circularized while it was in the pre-main sequence, however, to the extent that this theory is correct, it is unlikely to have circularized once settling on the main sequence.
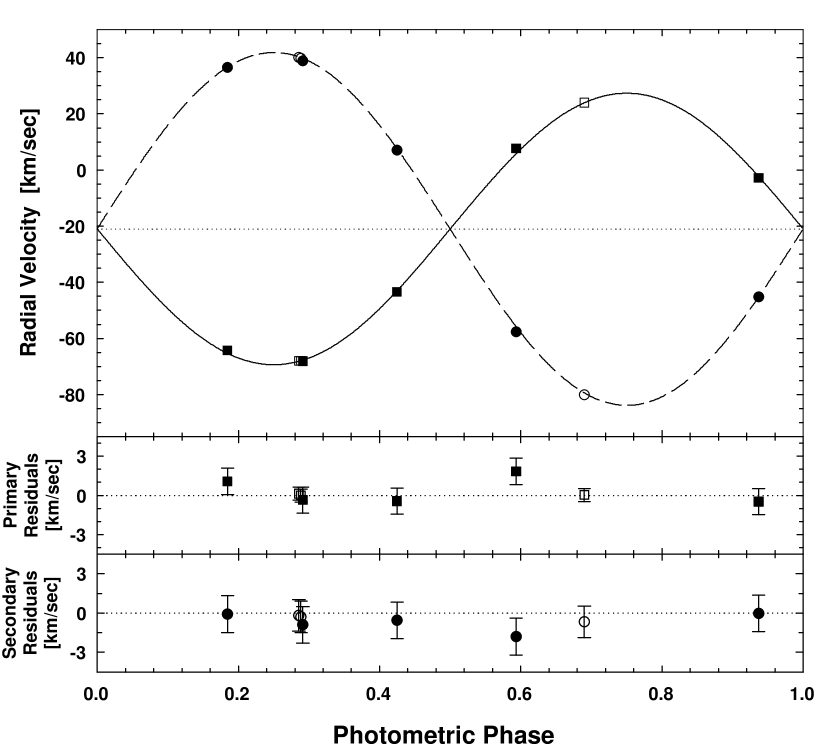
A Keplerian model was fitted to the radial velocities to determine the elements of the spectroscopic orbit of T-Lyr1-17236. We assumed the eccentricity to be zero based on the evidence above and the lack of any indications to the contrary from preliminary spectroscopic solutions. The period and were held fixed at the values determined above. We solved simultaneously for the velocity semi-amplitudes of the components () and the RV of their center of mass (). The results are shown graphically in Figure 7, and the elements are listed in Table 6. The minimum masses are formally determined to better than 2%. However, because of the small number of observations (), the possibility of systematic errors cannot be ruled out and further observations are encouraged to confirm the accuracy of these results.
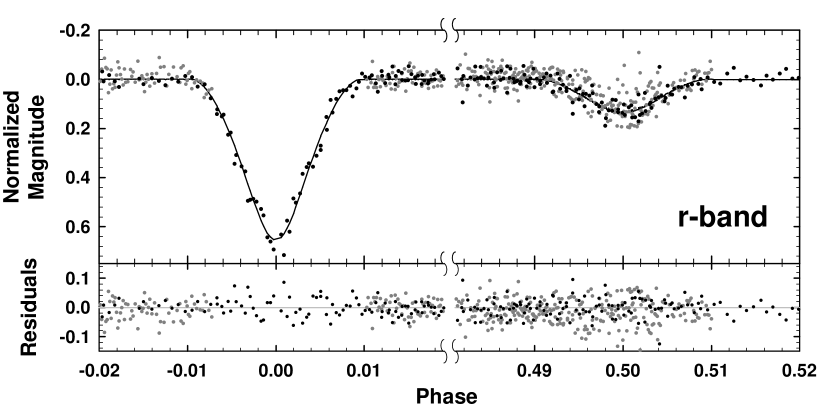
We then proceeded to find the remaining photometric parameters of T-Lyr1-17236. To this end, we analyzed the Sleuth -band LC using JKT-EBOP (Southworth et al., 2004a, b), a LC modeling program based on the EPOB light curve generator (Nelson & Davis, 1972; Etzel, 1981; Popper & Etzel, 1981). We assumed a circular orbit, as before, a mass ratio of from the spectroscopic model, and the period determined above. We solved simultaneously for the orbital inclination (), the fractional radii (), the central surface brightness ratio of the secondary in units of the primary (), the time of primary eclipse (), and the out-of-eclipse magnitude (zero point). We estimated the uncertainties of the fitted parameters by evaluating the distribution generated by 1000 Monte Carlo simulations (Southworth et al., 2005).
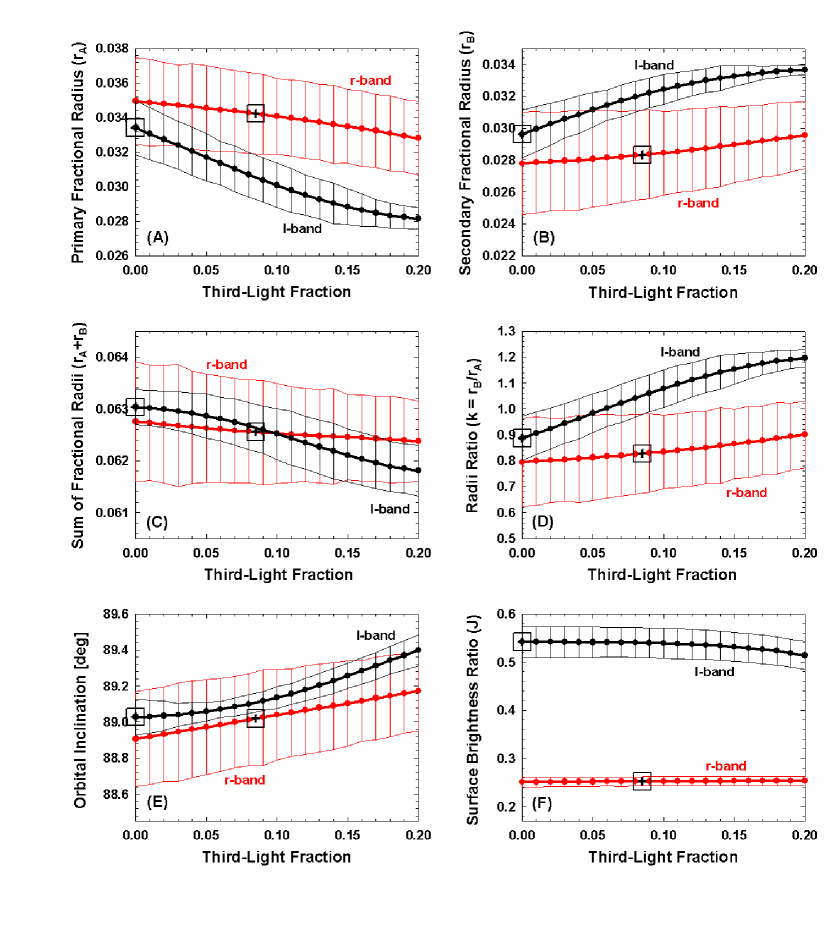
Because of the large photometric aperture of Sleuth, the presence of significant contamination from the light of additional stars is a distinct possibility. Unfortunately, due to its degeneracy with the orbital inclination and the fractional radii, we were not able to simultaneously determine the fractional third light of the system (). We therefore sequentially refit the LC model parameters with fixed fractional third-light values ranging from 0 to 0.2 (see Figure 8). We repeated this routine with the -band IAC80/HATNet LC as well, although these results were not used because of their larger uncertainties. We obtained an external estimate of the third-light fraction affecting the Sleuth observations using the USNO-B catalog (Monet et al., 2003), which lists two dim objects within 30″ of T-Lyr1-17236 (USNO-B1.0 1366-0314297 and 1366-0314302). Assuming that these objects are completely blended into T-Lyr1-17236, we expect an -band third-light fraction of , and we adopted this value for the -band LC. Fortunately, the fitted parameters are quite insensitive to third light, so that the uncertainty in only moderately increases their uncertainties. No objects were listed within the smaller photometric apertures of either IAC80 or HATNet, so we conclude that the -band LC should have little or no third-light contamination. It is important to note that these third-light estimates assume that there are no further unresolved luminous objects that are blended with T-Lyr1-17236 (e.g., a hierarchical tertiary component). However, the divergence of the -band and -band solutions at higher third-light fractions (see Figure 8), and the deep primary eclipse in both the - and -bands (0.649 mag and 0.604 mag, respectively), suggest that if such unresolved objects exist, they are unlikely to account for more than 0.1 of the total flux, and therefore would not bias the fitted results beyond the current estimated uncertainties. The final results of our LC fits are given in Table 5.
6 Physical Parameters
The fundamental parameters of T-Lyr1-17236, such as their absolute masses and radii, were derived by combining the results of the spectroscopic analysis (Table 6) with those from the photometric analysis (Table 5). These and other physical properties are listed in Table 7. Our estimates of the primary and secondary component masses, = 0.6795 0.0107 and = 0.5226 0.0061 , lead us to infer spectral types of K5V and M0V, respectively, according to empirical tables (Cox, 2000). We are not able to make independent estimates of the effective temperatures of the stars from the data in hand. This could be done, for example, if we had individual color indices based on combined light values and light ratios in two different bands, but we can only derive a reliable estimate of the light ratio in the -band. The comparison with stellar evolution models by Baraffe et al. (1998) in § 8 suggests primary and secondary component temperatures of approximately 4150 K and 3700 K, respectively, although the accuracy of these values is difficult to assess.
No trigonometric parallax is available for T-Lyr1-17236. A rough distance estimate to the system may be made using the brightness measurements in the 2MASS Catalog, collected in Table 2, along with estimates of the absolute magnitudes. For these we must rely once again on models. The Galactic latitude of suggests the possibility of some interstellar extinction. From the reddening maps of Schlegel et al. (1998) we infer in the direction of the object (total reddening), which corresponds to extinctions of , , and , assuming (Cox, 2000). Under the further assumption that this extinction applies to T-Lyr1-17236, we derive a mean distance of pc, after conversion of the near-infrared magnitudes in the CIT system from the Baraffe et al. (1998) models to the 2MASS system, following Carpenter (2001). With the proper motion components from the USNO-B Catalog listed in Table 2, the center-of-mass velocity from the spectroscopic solution corrected for the velocity of GJ 182 (Montes et al., 2001), and the distance above, we infer space velocity components in the Galactic frame of (,,) (,,) km s-1, where points in the direction of the Galactic center.
Because of the relevance of the rotational velocities of the stars for the interpretation of the chromospheric activity results of § 7, we have made an effort here to measure the rotational broadening of both components from the widths of the cross-correlation functions derived from our TRES spectra. We rely on the fact that to first order, the width of a cross-correlation peak is approximately equal to the quadrature sum of the line broadening of the two spectra. We began our estimation procedure by finding the effective resolution of the instrument () in the four TRES orders we used. This was done by auto-correlating a TRES ThAr spectrum that was taken just before the second T-Lyr1-17236 observation. We found that the four orders produced peaks with an average FWHM of km s-1. Thus, assuming that the intrinsic widths of the ThAr emission lines are negligible compared to the instrumental resolution, we found that km s-1. This value corresponds to a spectral resolving power of R , which is consistent with the TRES specifications. Next, we determined the intrinsic spectral line broadening of the template star, GJ 15A (). We auto-correlated the template spectrum and found that it produced peaks with an average FWHM of km s-1. This value should be equal to , from which we infer that km s-1. Note that this result is well within the upper bound provided by Delfosse et al. (1998), following their non-detection of any rotational broadening in GJ 15A. Using this information, we can now find the intrinsic spectral line broadening of the T-Lyr1-17236 components (). The average FWHM of the primary and secondary peaks, resulting from the cross-correlation of each observed spectrum of T-Lyr1-17236 against the template, were measured to be km s-1 and km s-1, respectively. These widths are expected to be equal to , from which we calculate that km s-1 and km s-1.
The rotational profile FWHM expected for a homogeneous stellar disk is , where is the star’s equatorial rotational velocity, and is the inclination of its rotational axis. Stellar limb darkening, however, will narrow the rotational profile, thus decreasing the observed FWHM (Gray, 1992). Adopting the -band PHOENIX linear limb darkening coefficients from Claret (1998), we find that the expected FWHM values for the primary and secondary components of T-Lyr1-17236 are, respectively, and . Using these results we can set upper bounds to the components’ . These upper bounds represent the limiting case whereby the spectral line broadening is due entirely to stellar rotation, and we neglect all other line broadening mechanisms, such as microturbulence and the Zeeman effect. We thus determine the maximum rotational velocities of the T-Lyr1-17236 primary and secondary components to be km s-1 and km s-1, respectively.
An estimate of the timescale for tidal synchronization of the stars’ rotation with their orbital motion may be obtained from theory following Zahn (1977), and assuming simple power-law mass-radius-luminosity relations (Cox, 2000). Thus, for stars less massive than 1.3 ,
| (1) |
where is determined by the structure and dynamics of the star and can be obtained by interpolating published theoretical tables (Zahn, 1994). This calculation leads to timescales of Gyr and 1.02 Gyr for the primary and secondary components of T-Lyr1-17236, respectively, which are much shorter than the circularization timescale determined in § 5. We note that similar to the circularization timescale, the synchronization timescales estimated above are the current instantaneous values, and are likely to have changed over time. The age of the system is undetermined (see § 8), but assuming its age is at least a few Gyr, as is typical for field stars, it would not be surprising if tidal forces between the components had already synchronized their rotations. This is illustrated in Figure 1, where T-Lyr1-17236 is shown along with the other systems in Table 1 and with curves representing theoretical estimates of the synchronization timescale as a function of orbital period.
If we assume that the components are indeed rotationally synchronized, we can compute their rotational velocities more accurately using . We thus derive synchronized velocities of km s-1 and km s-1 for the primary and secondary components, respectively. These values are slightly below but still consistent with the maximum rotational velocities measured above. Thus, observational evidence suggests that the stars’ rotations may well be synchronized with their orbital motion, although more precise measurements would be needed to confirm this. Our conclusion from this calculation is that regardless of whether we assume that the components of T-Lyr1-17236 are synchronized, their rotational velocities do not appear to be large.
7 Chromospheric Activity
Our absolute mass and radius determinations for T-Lyr1-17236 offer the possibility of testing stellar evolution models in the lower main sequence, and in particular testing the idea that the discrepancies noted in § 1 are related to chromospheric activity and the associated magnetic fields in systems where the components are rotating relatively rapidly. Thus, establishing the level of the activity in the system presented here is of considerable importance. We have shown in § 6 that the relatively long period of T-Lyr1-17236 ( days) implies that even if the components are synchronized, their rotational velocities are slow, and therefore are not expected to induce a great deal of chromospheric activity. However, demonstrating that the stars are indeed inactive requires more direct evidence, given that some stars of similar masses as these are still found to be quite active at rotation periods as long as 8 days (see, e.g., Pizzolato et al., 2003). We present here the constraints available on the surface activity of T-Lyr1-17236 from its X-ray emission, optical variations, and spectroscopic indicators.
The present system has no entry in the ROSAT Faint Source Catalog (Voges et al., 1999), suggesting the X-ray luminosity, usually associated with activity, is not strong. Examination of the original ROSAT archive images leads to a conservative upper limit to the X-ray flux of erg cms-1 in the energy range 0.1–2.4 keV, and together with information from Table 7, we infer an upper limit for the ratio of the X-ray to bolometric luminosity of . Values for the four best studied cases of CM Dra, YY Gem, CU Cnc, and GU Boo, which are all very active, are respectively , , , and (see López-Morales, 2007). These are at the level of our limit or higher, although we do not consider this evidence conclusive.
There are no detectable variations in the -band light curve out of eclipse, within the uncertainties. Such variations would be expected from activity-related surface features showing significant contrast with the photospheres. We estimate an upper limit of 0.01 mag in for the night-to-night variations (see Figure 3). Because the secondary components is significantly dimmer, it has a weaker variability upper limit of 0.09 mag. We note, however, that this evidence for inactivity is not conclusive either, since the observed photometric variations can depend significantly on the distribution of spots on the surface.
A number of spectroscopic activity indicators (the Ca II H and K lines, H, etc.) should in principle allow a more direct assessment of the activity level in T-Lyr1-17236. Unfortunately, however, the quality of our spectroscopic material in the optical makes this difficult. The flux in the blue for this very red system is too low to distinguish the Ca II H and K lines, and even at H the noise is considerable (typical signal-to-noise ratios at this wavelength are 12 pixel-1). Two of the three TRES spectra show the H line in absorption, and the other appears to show H in emission. This suggests some degree of chromospheric activity, although perhaps not at such a high level as to sustain the emission at all times, as is seen in other stars. H appears to be in absorption in all three TRES spectra.
Clearly more spectra with higher signal-to-noise ratios are needed to better characterize the level of activity, but from the sum of the evidence above it would not appear that the activity in T-Lyr1-17236 is as high as in other low-mass eclipsing binaries studied previously, thus more closely aligning it with the assumptions of current standard stellar models. The system may therefore constitute a useful test case for confirming or refuting the magnetic disruption hypothesis (see § 1), which predicts that the absolute properties of its slowly rotating components should match the theoretical models of convective stars.
8 Comparison with Models and Conclusions
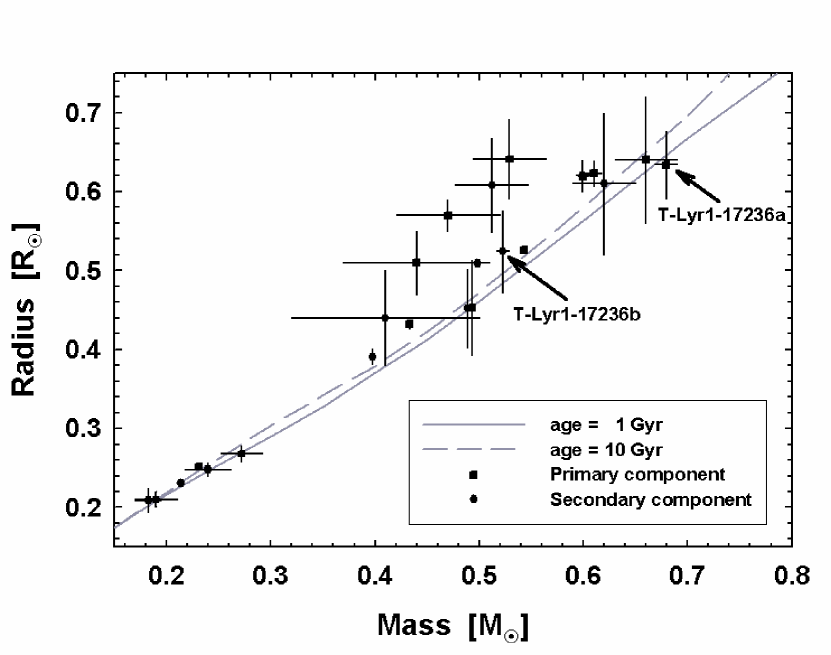
A comparison with solar-metallicity models by Baraffe et al. (1998) for a mixing length parameter of is presented in Figure 9. Our mass and radius determinations for T-Lyr1-17236 (see Table 7) are shown along with those of the low-mass systems listed in Table 1. The location of the models in this diagram depends only slightly on age because these stars evolve very slowly. The age of T-Lyr1-17236 is difficult to establish independently. The space motions derived in § 6 do not associate the system with any known moving group, and are quite typical of the thin disk. Thus, all we can say is that it is not likely to be very old. We display in Figure 9 two models for ages of Gyr and Gyr, which likely bracket the true age of T-Lyr1-17236. Within the errors, our measurements for the two components are consistent with the models, which would in principle support the magnetic disruption hypothesis. Unfortunately, however, the uncertainties in the radius measurements (7% and 10%) are still large enough that our statement cannot be made more conclusive. Further follow-up observations, especially rapid-cadence and precise photometric measurements during multiple eclipses, should significantly reduce the uncertainties in the radii and thus provide far stronger constraints on the theoretical models of low-mass stars. Additionally, higher-quality spectroscopic observations than ours are needed to confirm that the level of chromospheric activity in the system is relatively low. If after such observations, the masses and radii of the T-Lyr1-17236 components remain consistent with the stellar models, then the magnetic disruption hypothesis will be strengthened. However, if further observations find that the components of T-Lyr1-17236 are larger than predicted by current stellar models, as is the case with most other similar systems investigated in sufficient detail, then this will provide evidence that additional mechanisms need to be included in the models of the structure of low-mass main sequence stars (see, e.g., Chabrier et al., 2007).
It is important to note here that T-Lyr1-17236 falls within the field of view of the upcoming NASA Kepler Mission (Borucki et al., 2003). The Kepler Mission will not return data for all stars within its field of view; rather, the targets will be selected by the Kepler team. We see at least two reasons why such monitoring of T-Lyr1-17236 would be of significant value. First, the data would greatly refine the estimates of the physical parameters of the component stars and may permit a search for their asteroseismological modes. Second, the data would enable a search for transits of exoplanets, which are expected to orbit in the same plane as that defined by the stellar orbits.
Finally, we note that our findings in this paper confirm the accuracy of the MECI algorithm (see Figure 2), which can be further used to find additional long-period low-mass EBs, and indeed a variety of other interesting targets. We have shown in a recent paper (Devor et al., 2008) how this can be done with comparable ease by systematically searching the ever-growing body of LC survey datasets. We hope that this new approach for locating rare EBs will motivate additional studies of these vast, largely untapped datasets, which likely harbor a wealth of information on the formation, structure, dynamics, and evolution of stars.
References
- Alonso et al. (2004) Alonso, R., et al. 2004, ApJ, 613, L153
- Andersen (1991) Andersen, J. 1991, A&A Rev., 3, 91
- Andersen (1998) Andersen, J. 1998, IAU Symp. 189: Fundamental Stellar Properties, 189, 99
- Bakos et al. (2002) Bakos, G. Á., Lázár, J., Papp, I., Sári, P., & Green, E. M. 2002, PASP, 114, 974
- Bakos et al. (2004) Bakos, G., Noyes, R. W., Kovács, G., Stanek, K. Z., Sasselov, D. D., & Domsa, I. 2004, PASP, 116, 266
- Baraffe et al. (1998) Baraffe, I., Chabrier, G., Allard, F., & Hauschildt, P. H. 1998, A&A, 337, 403
- Becker et al. (2008) Becker, A. C., et al. 2008, MNRAS, 386, 416
- Berger et al. (2006) Berger, D. H., et al. 2006, ApJ, 644, 475
- Blake et al. (2007) Blake, C. H., Torres, G., Bloom, J. S., & Gaudi, B. S. 2007, ArXiv e-prints, arXiv:0707.3604
- Blake et al. (2008) Blake, C. H., Charbonneau, D., White, R. J., Torres, G., Marley, M. S., & Saumon, D. 2008, ApJ, 678, L125
- Borucki et al. (2003) Borucki, W. J., et al. 2003, Proc. SPIE, 4854, 129
- Browning & Basri (2007) Browning, M. K., & Basri, G. 2007, American Institute of Physics Conference Series, 948, 157
- Carpenter (2001) Carpenter, J. M. 2001, AJ, 121, 2851
- Chabrier & Baraffe (2000) Chabrier, G., & Baraffe, I. 2000, ARA&A, 38, 337
- Chabrier et al. (2007) Chabrier, G., Gallardo, J., & Baraffe, I. 2007, A&A, 472, L17
- Claret (1998) Claret, A. 1998, A&A, 335, 647
- Cox (2000) Cox, A. N. 2000, Allen’s astrophysical quantities (New York: AIP Press; Springer)
- Creevey et al. (2005) Creevey, O. L., et al. 2005, ApJ, 625, L127
- Delfosse et al. (1998) Delfosse, X., Forveille, T., Perrier, C., & Mayor, M. 1998, A&A, 331, 581
- Delfosse et al. (1999) Delfosse, X., Forveille, T., Mayor, M., Burnet, M., & Perrier, C. 1999, A&A, 341, L63
- Devor (2005) Devor, J. 2005, ApJ, 628, 411
- Devor & Charbonneau (2006a) Devor, J., & Charbonneau, D. 2006a, Ap&SS, 304, 351
- Devor & Charbonneau (2006b) Devor, J., & Charbonneau, D. 2006b, ApJ, 653, 648
- Devor et al. (2008) Devor, J., Charbonneau, D., O’Donovan, F. T., Mandushev, G., & Torres G. 2008, AJ, 135, 850
- Dunham et al. (2004) Dunham, E. W., Mandushev, G. I., Taylor, B. W., & Oetiker, B. 2004, PASP, 116, 1072
- Etzel (1981) Etzel, P. B. 1981, Photometric and Spectroscopic Binary Systems, 111
- Evans et al. (2002) Evans, D. W., Irwin, M. J., & Helmer, L. 2002, A&A, 395, 347
- Galan & Cobos (1987) Galan, M. J., & Cobos, F. J. 1987, Revista Mexicana de Astronomia y Astrofisica, 14, 767
- Gray (1992) Gray, D. F. 1992, The Observation and Analysis of Stellar Photospheres (Cambridge, UK: Cambridge Univ. Press), 368
- Hebb et al. (2006) Hebb, L., Wyse, R. F. G., Gilmore, G., & Holtzman, J. 2006, AJ, 131, 555
- Horne (1986) Horne, K. 1986, PASP, 98, 609
- Kim et al. (2002) Kim, Y., Demarque, P., Yi, S. K., & Alexander, D. R. 2002, ApJS, 143, 499
- Kron (1952) Kron, G. E. 1952, ApJ, 115, 301
- Lacy (1977a) Lacy, C. H. 1977a, ApJS, 34, 479
- Lacy (1977b) Lacy, C. H. 1977b, ApJ, 218, 444
- Lane et al. (2001) Lane, B. F., Boden, A. F., & Kulkarni, S. R. 2001, ApJ, 551, L81
- López-Morales & Ribas (2005) López-Morales, M., & Ribas, I. 2005, ApJ, 631, 1120
- López-Morales et al. (2006) López-Morales, M., Orosz, J. A., Shaw, J. S., Havelka, L., Arevalo, M. J., McIntyre, T., & Lazaro, C. 2006, ArXiv e-prints, arXiv:astro-ph/0610225
- López-Morales (2007) López-Morales, M. 2007, ApJ, 660, 732
- Maceroni & Montalbán (2004) Maceroni, C., & Montalbán, J. 2004, A&A, 426, 577
- Mandushev et al. (2005) Mandushev, G., et al. 2005, ApJ, 621, 1061
- Maxted et al. (2007) Maxted, P. F. L., O’Donoghue, D., Morales-Rueda, L., Napiwotzki, R., & Smalley, B. 2007, MNRAS, 376, 919
- Mazeh (2008) Mazeh, T. 2008, EAS Publications Series, 29, 1
- McLean et al. (1998) McLean, I. S., et al. 1998, Proc. SPIE, 3354, 566
- McLean et al. (2000) McLean, I. S., Graham, J. R., Becklin, E. E., Figer, D. F., Larkin, J. E., Levenson, N. A., & Teplitz, H. I. 2000, Proc. SPIE, 4008, 1048
- Metcalfe et al. (1996) Metcalfe, T. S., Mathieu, R. D., Latham, D. W., & Torres, G. 1996, ApJ, 456, 356
- Monet et al. (2003) Monet, D. G., et al. 2003, AJ, 125, 984
- Montes et al. (2001) Montes, D., López-Santiago, J., Gálvez, M. C., Fernández-Figueroa, M. J., De Castro, E., & Cornide, M. 2001, MNRAS, 328, 45
- Morrison et al. (2001) Morrison, J. E., Röser, S., McLean, B., Bucciarelli, B., & Lasker, B. 2001, AJ, 121, 1752
- Nelson & Davis (1972) Nelson, B., & Davis, W. D. 1972, ApJ, 174, 617
- O’Donovan et al. (2004) O’Donovan, F. T., Charbonneau, D., & Kotredes, L. 2004, The Search for Other Worlds, AIP Conference Proceedings, 713, 169
- O’Donovan et al. (2006) O’Donovan, F. T., et al. 2006, ApJ, 644, 1237
- O’Donovan et al. (2007) O’Donovan, F. T., et al. 2007, ApJ, 662, 658
- Pizzolato et al. (2003) Pizzolato, N., Maggio, A., Micela, G., Sciortino, S., & Ventura, P. 2003, A&A, 397, 147
- Popper & Etzel (1981) Popper, D. M., & Etzel, P. B. 1981, AJ, 86, 102
- Press et al. (1992) Press, W. H., Teukolsky, S. A., Vetterling, W. T., & Flannery, B. P. 1992, Numerical Recipes in C. The Art of Scientific Computing (Cambridge, UK: Cambridge Univ. Press)
- Ribas (2003) Ribas, I. 2003, A&A, 398, 239
- Ribas (2006) Ribas, I. 2006, Ap&SS, 304, 87
- Schlegel et al. (1998) Schlegel, D. J., Finkbeiner, D. P., & Davis, M. 1998, ApJ, 500, 525
- Ségransan et al. (2003) Ségransan, D., Kervella, P., Forveille, T., & Queloz, D. 2003, A&A, 397, L5
- Skrutskie et al. (2006) Skrutskie, M. F., et al. 2006, AJ, 131, 1163
- Southworth et al. (2004a) Southworth, J., Maxted, P. F. L., & Smalley, B. 2004a, MNRAS, 351, 1277
- Southworth et al. (2004b) Southworth, J., Zucker, S., Maxted, P. F. L., & Smalley, B. 2004b, MNRAS, 355, 986
- Southworth et al. (2005) Southworth, J., Smalley, B., Maxted, P. F. L., Claret, A., & Etzel, P. B. 2005, MNRAS, 363, 529
- Szentgyorgyi & Fűrész (2007) Szentgyorgyi, A. H., & Fűrész, G. 2007, Revista Mexicana de Astronomia y Astrofisica Conference Series, 28, 129
- Torres & Ribas (2002) Torres, G., & Ribas, I. 2002, ApJ, 567, 1140
- Torres et al. (2006) Torres, G., Lacy, C. H., Marschall, L. A., Sheets, H. A., & Mader, J. A. 2006, ApJ, 640, 1018
- Voges et al. (1999) Voges et al. 1999, A&AS, 349, 389
- Yi et al. (2001) Yi, S., Demarque, P., Kim, Y.-C., Lee, Y.-W., Ree, C. H., Lejeune, T., & Barnes, S. 2001, ApJS, 136, 417
- Young et al. (2006) Young, T. B., Hidas, M. G., Webb, J. K., Ashley, M. C. B., Christiansen, J. L., Derekas, A., & Nutto, C. 2006, MNRAS, 370, 1529
- Zahn (1977) Zahn, J.-P. 1977, A&A, 57, 383
- Zahn (1978) Zahn, J.-P. 1978, A&A, 67, 162
- Zahn & Bouchet (1989) Zahn, J.-P., & Bouchet, L. 1989, A&A, 223, 112
- Zahn (1994) Zahn, J.-P. 1994, A&A, 288, 829
- Zucker (2003) Zucker, S. 2003, MNRAS, 342, 1291
| Name | Period [days] | Citation |
|---|---|---|
| OGLE BW5 V38aaThis binary might not be detached, as its components seem to be undergoing significant mutual heating and tidal interactions due to their proximity (). | 0.198 | Maceroni & Montalbán (2004) |
| RR CaelibbThis is an unusual case of an EB containing a white-dwarf (primary) and an M-dwarf (secondary). As such, the primary component is likely to have transferred mass to the secondary component, and perhaps even enveloped it during the red-giant phase of its evolution. | 0.304 | Maxted et al. (2007) |
| NSVS01031772 | 0.368 | López-Morales et al. (2006) |
| SDSS-MEB-1 | 0.407 | Blake et al. (2007) |
| GU Boo | 0.489 | López-Morales & Ribas (2005) |
| 2MASS J04463285+1901432 | 0.619 | Hebb et al. (2006) |
| YY Gem | 0.814 | Kron (1952); Torres & Ribas (2002) |
| T-Her0-07621 | 1.121 | Creevey et al. (2005) |
| CM Dra | 1.268 | Lacy (1977b); Metcalfe et al. (1996) |
| UNSW-TR-2 | 2.117 | Young et al. (2006) |
| 2MASS J01542930+0053266 | 2.639 | Becker et al. (2008) |
| CU Cnc | 2.771 | Delfosse et al. (1999); Ribas (2003) |
| Source Catalog | Parameter | Value |
|---|---|---|
| 2MASSaaTwo Micron All Sky Survey catalog (Skrutskie et al., 2006). | (J2000) | 19:07:16.621 |
| 2MASS | (J2000) | +46:39:53.21 |
| USNO-BbbU.S. Naval Observatory photographic sky survey (Monet et al., 2003). | mag | 16.11 0.2 |
| GSC2.3ccGuide Star Catalog, version 2.3.2 (Morrison et al., 2001). | mag | 14.37 0.28 |
| USNO-B | mag | 14.41 0.2 |
| CMC14ddCarlsberg Meridian Catalog 14 (Evans et al., 2002). | mag | 14.073 0.029 |
| 2MASS | mag | 12.019 0.015 |
| 2MASS | mag | 11.399 0.015 |
| 2MASS | mag | 11.235 0.015 |
| USNO-B | () | 2 3 |
| USNO-B | () | 28 2 |
| 2MASS | identification | 19071662+4639532 |
| CMC14 | identification | 190716.6+463953 |
| GSC2.3 | identification | N2EH033540 |
| USNO-B | identification | 1366-0314305 |
| Epoch (BJD) |
|
|
|
Template | Instrument | ||||||
|---|---|---|---|---|---|---|---|---|---|---|---|
| 2453927.9400 | 2.87 | 45.24 | 480 | GJ 182 | NIRSPEC | ||||||
| 2453930.9258 | 68.09 | 38.85 | 900 | GJ 182 | NIRSPEC | ||||||
| 2453946.8846 | 64.26 | 36.53 | 600 | GJ 182 | NIRSPEC | ||||||
| 2453948.9100 | 43.45 | 7.03 | 420 | GJ 182 | NIRSPEC | ||||||
| 2454312.7985 | 7.66 | 57.68 | 480 | GJ 182 | NIRSPEC | ||||||
| 2454372.6179 | 23.99 | 80.14 | 900 | GJ 15A | TRES | ||||||
| 2454377.6382 | 68.03 | 40.10 | 1000 | GJ 15A | TRES | ||||||
| 2454377.6624 | 67.97 | 39.73 | 1000 | GJ 15A | TRES |
| Eclipse Type | Epoch (HJD) | O-C [sec] | Data Source |
|---|---|---|---|
| Primary | 2453152.96121 | HATNet | |
| Secondary | 2453157.17593 | HATNet | |
| Primary | 2453169.82009 | HATNet | |
| Primary | 2453186.67897 | HATNet | |
| Secondary | 2453190.89369 | HATNet | |
| Primary | 2453195.10841 | HATNet | |
| Secondary | 2453207.75258 | HATNet | |
| Secondary | 2453544.93022 | Sleuth | |
| Secondary | 2453561.78910 | Sleuth + PSST | |
| Secondary | 2453578.64798 | Sleuth | |
| Primary | 2453582.86270 | Sleuth | |
| Primary | 2453599.72158 | Sleuth | |
| Secondary | 2453603.93630 | Sleuth + PSST | |
| Primary | 2453616.58046 | Sleuth | |
| Primary | 2453861.03425 | PSST | |
| Primary | 2454417.37736 | IAC80 |
| Parameter | Symbol | Value |
|---|---|---|
| Period (days) | 8.429441 0.000033 | |
| Epoch of eclipse (HJD) | 2453700.87725 0.00041 | |
| Primary fractional radius | 0.0342 0.0023 | |
| Secondary fractional radius | 0.0283 0.0028 | |
| Orbital inclination [deg] | 89.02 0.26 | |
| Eccentricity | 0.0 (fixed) | |
| Sum of fractional radii | 0.06256 0.00095 | |
| Ratio of radii () | 0.83 0.15 | |
| Light ratio (-band) | 0.173 0.073 | |
| Surface brightness ratio (-band) | 0.2525 0.0099 |
| Parameter | Symbol | Value |
|---|---|---|
| Primary radial velocity semi-amplitude () | 48.36 0.23 | |
| Secondary radial velocity semi-amplitude () | 62.86 0.46 | |
| Barycentric radial velocity, relative to GJ 182aaMontes et al. (2001) list the radial velocity of GJ 182 as km s-1. () | 21.01 0.18 | |
| Binary separation with projection factor () | 18.526 0.083 | |
| Primary mass with projection factor () | 0.6792 0.0107 | |
| Secondary mass with projection factor () | 0.5224 0.0061 | |
| Mass ratio () | 0.7692 0.0069 |
| Parameter | Symbol | Component A | Component B |
|---|---|---|---|
| Mass () | 0.6795 0.0107 | 0.5226 0.0061 | |
| Radius () | 0.634 0.043 | 0.525 0.052 | |
| Log surface gravity (cgs) | 4.666 0.059 | 4.718 0.086 | |
| Semimajor axis ( km) | 5.606 0.027 | 7.288 0.053 | |
| Maximum rotational velocityaaSee description in §6. (km s-1) | |||
| Synchronized rotational velocityaaSee description in §6. (km s-1) | |||
| Absolute visual magnitudebbInferred using stellar evolution models by Baraffe et al. (1998) assuming solar metallicity and an age of Gyr. (mag) | 8.03 | 9.67 | |
| Bolometric luminositybbInferred using stellar evolution models by Baraffe et al. (1998) assuming solar metallicity and an age of Gyr. () | 0.110 | 0.039 | |
| Effective temperaturebbInferred using stellar evolution models by Baraffe et al. (1998) assuming solar metallicity and an age of Gyr. (K) | 4150 | 3700 | |
| DistancebbInferred using stellar evolution models by Baraffe et al. (1998) assuming solar metallicity and an age of Gyr. (pc) | 230 20 | ||