Mid-Infrared Spectroscopic Properties of Ultra-Luminous Infrared Quasars
Abstract
We analyse mid-infrared (MIR) spectroscopic properties for 19 ultra-luminous infrared quasars (IR QSOs) in the local universe based on the spectra from the Infrared Spectrograph on board the Spitzer Space Telescope. The MIR properties of IR QSOs are compared with those of optically-selected Palomar-Green QSOs (PG QSOs) and ultra-luminous infrared galaxies (ULIRGs). The average MIR spectral features from 5 to 30m, including the spectral slopes, 6.2m PAH emission strengths and [NeII] 12.81m luminosities of IR QSOs, differ from those of PG QSOs. In contrast, IR QSOs and ULIRGs have comparable PAH and [NeII] luminosities. These results are consistent with IR QSOs being at a transitional stage from ULIRGs to classical QSOs. We also find that the colour index (30, 15) is a good indicator of the relative contribution of starbursts to AGNs for all QSOs. Correlations between the [NeII] 12.81m and PAH 6.2m luminosities and those between the [NeII], PAH with 60m luminosities for ULIRGs and IR QSOs indicate that both [NeII] and PAH luminosities are approximate star formation rate indicators for IR QSOs and starburst-dominated galaxies; the scatters are, however, quite large ( 0.7 to 0.8 dex). Finally the correlation between the EW (PAH 6.2m) and outflow velocities suggests that star formation activities are suppressed by feedback from AGNs and/or supernovae.
keywords:
galaxies: active – galaxies: evolution – galaxies: interactions – quasars: general — infrared: galaxies1 Introduction
Since the discovery of ultra-luminous infrared galaxies (ULIRGs, LIR10) by the Infrared Astronomical Satellite (IRAS) in the 1980’s (e.g., Houck et al., 1985), it is widely accepted that ULIRGs result from strong interactions/mergers between gas-rich disk galaxies. These mergers form elliptical galaxies and ULIRGs are an important intermediate stage in the process during which at least a fraction of ULIRGs manifest as dust-enshrouded QSOs (see, e.g., Sanders & Mirabel, 1996; Lonsdale et al., 2006). In addition, active galactic nuclei (AGNs) triggered by mergers tend to appear at the final merging stages (e.g., Sanders et al. 1988, Zheng et al. 1999, Cui et al. 2001, Veilleux et al. 2002 and reference therein).
There is mounting evidence that QSOs with far-infrared (FIR) excess have massive starbursts in their host galaxies. For example, Canalizo & Stockton (2001) investigated 9 QSOs with FIR excess and found that their host galaxies are tidally interacting or major merger systems with obvious recent star-forming activities. From the detections of mid-infrared (MIR)/FIR111In this paper, MIR refers to 5-35 m, FIR 35-350 m, and IR 8-1000m. emissions for FeLoBALs (Broad Absorption Line QSOs with low-ionisation and iron absorption lines) by Multiband Imaging Photometer on Spitzer (MIPS; Rieke et al., 2004) on board the Spitzer Space Telescope (Werner et al., 2004), Farrah et al. (2007a) find that all their 9 FeLoBALs are extremely infrared (IR) bright, and concluded that these QSOs are in transition from ULIRGs to classical QSOs with ongoing or recent starbursts, because the iron absorption may be from iron ejected during starbursts. Hao et al. (2005a) studied 31 QSOs/Seyfert’1s selected from the local ULIRG samples (termed as IR QSOs for simplicity). By comparing the FIR spectral index of IR QSOs with those of optically selected Palomar-Green QSOs (PG QSOs; Schmidt & Green 1983), they argued that the FIR excess of IR QSOs relative to PG QSOs is from massive starbursts and inferred star formation rate (SFR) in the host galaxies of IR QSOs. Recently, from studies of z6 QSOs with strong sub-mm emissions, Carilli et al. (2007), Wang et al. (2007) and Wang et al. (2008) concluded that massive starbursts also exist in their host galaxies. The conclusion is consistent with the results of Hao et al. (2008) that high redshift (sub)mm-loud QSOs follow the same trend for FIR to bolometric luminosities established by low redshift IR QSOs (Hao et al., 2005a). All these studies suggest that there exists a transitional stage, during which both the central black hole and the spheroidal component of QSO hosts grow rapidly in a coeval fashion.
However, there is still a debate about the origin of FIR emission from QSOs, because one cannot firmly exclude the possibility that FIR emissions are from dust tori heated by central AGNs (for detailed discussions see Haas et al., 2003). Moreover, from the molecular gas properties of PG QSOs with IR excess and comparisons with ULIRGs, Evans et al. (2006) find that the and ratios for PG QSOs are higher than those of ULIRGs, implying that AGNs contribute significantly to the dust heating and hence to the FIR emission. Therefore, other SFR indicators besides the FIR emission for QSOs are important for further understanding the coeval growth of supermassive black holes and their host galaxies.
Recently, the QUEST (Quasar and ULIRG Evolution Study) group (see Schweitzer et al., 2006; Netzer et al., 2007) reported the detection of polycyclic aromatic hydrocarbon (PAH) emission features in PG QSOs using the Infrared Spectrograph (IRS) on Spitzer (Houck et al., 2004). For 11 out of 26 PG QSOs PAHs have been clearly detected. Furthermore, the average spectrum of the undetected 15 PG QSOs also shows PAH features. Since the PAH emissions are closely related to star formation, not to AGNs (see, e.g., Shi et al., 2007), such detections strongly suggest that star formation occurs widely in QSOs. Their analysis shows that 30% or more FIR emission in these PG QSOs is from starbursts. Furthermore, given that the low-excitation fine-structure emission line [NeII] 12.81m is one of the dominant emission lines of HII regions and that the PAH molecules are easily destroyed by high energy photons from AGNs (e.g., Wu et al., 2007), [NeII] emission may be an alternative, perhaps even better, tracer of star formation for QSOs (see §4).
In this paper we study the MIR spectroscopic properties of IR QSOs based on Spitzer IRS observations, and examine their connections and evolutionary relations to ULIRGs and PG QSOs. The sample selection, data acquisition and reduction are described in Sect. 2 and 3. The major results and discussions are given in Sect. 4 and 5. Finally we summarise our results in Sect. 6. We adopt cosmological parameters H0=70 km s-1 Mpc-1, m=0.3, and Λ=0.7 throughout this paper.
2 Sample Selection
IR QSOs are defined as type 1 AGN with LIR(m) 1012 L⊙ (Zheng et al., 2002). Our basic IR QSO samples are compiled from ULIRG samples with spectroscopic information, plus the IR QSOs obtained directly from the cross-correlation of the IRAS Point-Source catalog with the ROSAT All-Sky Survey Catalog. The ULIRG samples consist of 118 ULIRGs from 1 Jy ULIRGs survey (Kim & Sanders, 1998) and 97 ULIRGs from the QDOT redshift survey (Lawrence et al., 1999). The total number of IR QSOs is 31, about one third of all the IR QSOs found in a complete redshift survey with 15,411 IRAS galaxies and about 900 ULIRGs (PSCz; Saunders et al. 2000). Thus it should be a representative sample of IR QSOs (see Zheng et al. 2002 and Hao et al. 2005a for more detailed descriptions).
We searched the Spitzer archival data and found that 18 out of 31 IR QSOs have been observed by IRS and the data are available (see Table 1). Notice that 9 of the 10 IR QSOs (out of a total of 118 ULIRGs) from the 1 Jy ULIRG sample are included in our sample. The other 9 IR QSOs are from QDOT (4) and other QSO samples. In addition we include the object IRAS F14026+4341, which is classified as a hyper-luminous infrared galaxy (with LFIR 1013L⊙, Rowan-Robinson 2000) and a broad absorption line quasar (Low et al., 1989). Our sample includes 90% (50%) IR QSOs out of 1 Jy (QDOT) ULIRGs, and thus should be an overall representative sample. We checked that our results are essentially unchanged if we focus only on the 9 IR QSOs from the 1 Jy ULIRG samples, and thus our compiled sample has no significant biases.
14 of the 19 objects have both low- and high-resolution IRS observations, while four (3C 48, IRAS F02054+0835, PG 1543+489, and IRAS F200361547) have only low-resolution observations, and one (IRAS F212191757) has no Long-Low (LL) mode (see 3.1) observation (see Table 3).
The IRS low-resolution spectra of a sample of Palomar-Green QSOs (PG QSOs) are retrieved from Spitzer GTO and GO archival data (programs 14, 3187, 3421, and 20142; see Table 4). We remove objects whose MIR spectra have a low S/N ratio or redshift larger than 0.27 to guarantee reliable measurements of rest-frame 30m fluxes. The number of PG QSOs is 19 (see Table 1), the same as the number of IR QSOs. This PG QSO sample is mainly used for studying the MIR spectral slopes benefiting from the full wavelength coverage from 5-30m of their low-resolution spectra. We also collected another PG QSO sample with 22 objects studied by Schweitzer et al. (2006) (after excluding four objects that have been classified as IR QSOs and grouped into IR QSO sample). This second PG QSO sample has deep SL mode observations (5.2-14.5m) and is thus suitable for studying weak PAH emission features in continuum-dominated QSOs, and for analysing properties of the MIR fine-structure lines (especially [NeII]12.81m line in this work) from high-resolution observations.
The sample of Ultra-Luminous Infrared Galaxies (ULIRGs) is selected based on the IRAS 1 Jy sample of ULIRGs (Kim & Sanders, 1998), which have optical spectroscopic observations by Veilleux et al. (1999) and Wu et al. (1998). Their IRS low-resolution spectra are retrieved from Spitzer GTO archival data (program ID 105; see Table 4). The number in our ULIRG sample is 35 (see Table 2), including all spectral types except type 1 AGNs, namely Seyfert 2’s, LINERs, and HIIs as classified by Veilleux et al. (1999) and Wu et al. (1998) from diagnostic diagrams of optical lines.
3 Data Acquisition and Reduction


3.1 Mid-infrared spectra from Spitzer IRS
The MIR spectra are acquired from the Spitzer archival data using the Leopard software (see Table 3 for the integrated exposure times and program IDs for IR QSOs). The data (versions 13.2 to 15.3 of Spitzer pipeline reduction) include low-resolution (Short-Low [SL] & Long-Low [LL] modes, R60-120 and wavelength range: 5.2-38.0m) IRS spectra for IR QSOs, PG QSOs, and ULIRGs, and high-resolution (Short-High [SH] & Long-High [LH] modes, R600 and wavelength range: 9.9-37.2m) IRS spectra for most of the IR QSOs. We use the SMART software (Higdon et al., 2004) for data reduction, including the removal of rogue pixels, sky subtraction, and spectral extraction and analysis. The sky backgrounds for low-resolution (SL & LL modes) spectra are subtracted by differencing the adjacent sub-slit positions (1st & 2nd nods). No background subtraction is performed for the high-resolution (SH & LH modes) spectra, but this does not affect MIR fine-structure line measurements (see, e.g., Farrah et al., 2007b). The slit widths of 3′′.6 to 11′′.1 include most of the emission from the QSO and its host galaxy, so no aperture corrections are performed. For the low-resolution spectra we use the 12m and 25m flux densities from IRAS (or ISO if the IRAS fluxes are upper limits or not available) to scale the spectra by multiplying by a small factor, which is more suitable for the comparison between MIR and FIR properties in our statistics. The scaling factors for IR QSOs and ULIRGs are often close to unity, typically less than 1.1222One exception is 3C 273 for which no scaling was performed since it exhibits large variabilities in the MIR (Neugebauer & Matthews, 1999; Hao et al., 2005b).. However, for PG QSOs the scaling factors are larger, typically 1.5. This may be caused by variabilities of quasars in MIR (e.g., Neugebauer & Matthews, 1999) and/or contamination of companions (environments) for IRAS (or ISO) measurements.
3.2 Measurements of PAH and mid-infrared fine-structure lines
The fluxes of PAH emission at 6.2m are measured by integrating the flux above a local continuum from 6.0-6.5m approximated by a second-order polynomial (e.g., Spoon et al., 2007; Desai et al., 2007). The uncertainties (1) in the measurements are 20 on average (varying from 5 for PAH strong objects to about 50 for those with only marginally detectable PAH features). The equivalent widths (EW) of 6.2m PAH feature are obtained from dividing the integrated PAH flux by the continuum flux density below the peak of the feature. Upper limits (3) are given by adopting typical widths of 0.2m for the 6.2m PAH feature (Smith et al., 2007), which is similar to the value, 0.6m, used for the 7.7m feature by Schweitzer et al. (2006).
Note that we do not fit Gaussian or Lorentzian profiles to measure PAH emissions (e.g., Schweitzer et al., 2006; Imanishi et al., 2007) due to the relative weakness of PAH features in QSOs compared to their strong dust continuum. Since the three IR QSOs in the QUEST sample (I Zw 1, Mrk 1014, PG 1613+518) have 7.7/6.2 flux ratios of 4.2, 4.6, 4.9, respectively, similar to that of NGC 6240 (4.7, Armus et al. 2006), we estimate the 6.2m PAH fluxes for PG QSOs in the Schweitzer et al. (2006) sample (which has only 7.7m measurements) by taking a 7.7/6.2 flux ratio of 4.7.
The fluxes of the ionised neon fine-structure lines in the MIR ([NeII], [NeV], [NeIII] at 12.81, 14.32, and 15.56m) for IR QSOs are measured based on the high-resolution IRS spectra, using the IDEA spectral analysis tool of the SMART software. The fluxes are measured by fitting a single Gaussian superposed on a local continuum approximated by a second-order polynomial. Flux upper limits (3) are derived adopting typical line widths of 600 km s-1 (Schweitzer et al., 2006). The fluxes of the [NeII]12.81m line for some ULIRGs in our sample are from Farrah et al. (2007b).
4 Results
4.1 Mid-infrared spectral characteristics of IR QSOs
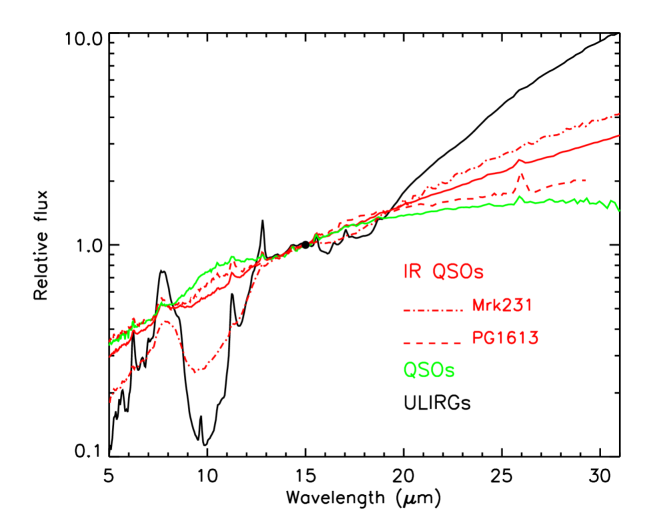
Fig. 1 shows the low-resolution Spitzer IRS MIR spectra of 18 IR QSOs in our sample (except IRAS F212191757 which has no LL mode observation). The dotted and dashed lines show the PAH features and the MIR fine-structure neon, sulphur, and oxygen lines. The shaded bar denotes the silicate emission/absorption feature centred at 9.7m. One can see from these spectra that the PAH features at 6.2, 7.7, 8.6, 11.2 & 12.7 m and the MIR fine-structure emission lines, such as [NeII] 12.81m, [NeV] 14.32m, [NeIII] 15.56m, [NeV] 24.32m & [OIV] 25.89m are present in most IR QSOs, although some emissions are weak for most of them. One can also see the silicate absorption feature at 9.7m for several IR QSOs (F00275, F13218, Mrk 231, F11119 and F15462), which are rarely seen in PG QSOs. For comparison, we show the average MIR spectra of IR QSOs, PG QSOs and ULIRGs in Fig. 2. The average spectra of ULIRGs and PG QSOs are from Hao et al. (2007). It is clear from Fig. 2 that the slope of MIR continua from 15m to 30m of IR QSOs is intermediate between that of ULIRGs and QSOs. We also show in the same figure the spectra of two representative IR QSOs (PG 1613+658 and Mrk 231). Their MIR spectra are intermediate between the average spectra of ULIRGs and PG QSOs. However, from the infrared, optical and X-ray observations, PG 1613+658 has the characteristics of classical QSOs (Zheng et al., 2002), while Mrk 231 is an on-going merger with high SFR from its hundred-pc scale molecular disk (Downes & Solomon, 1998).
In order to clarify more quantitatively the differences in the spectral properties, we study the properties of 6.2m PAH, [NeII] 12.81m luminosities, and MIR colour indices (30, 15), for IR QSOs, PG QSOs, and ULIRGs. The infrared colour index is defined as
| (1) |
The central wavelengths (30 and 15m) are selected in order to avoid the contamination by most strong spectral features (e.g., MIR fine-structure lines, PAH emissions, silicate emission/absorption features etc., see also Brandl et al. 2006; Schweitzer et al. 2006).


The histograms for these quantities are shown in Fig. 3. The mean values of (30, 15), EW (PAH 6.2m), PAH 6.2m and [NeII] 12.81m luminosities are labelled at the top of each panel of Fig. 3. From the left panels of Fig. 3, the MIR spectral slopes for IR QSOs are much flatter than those of ULIRGs, but are significantly steeper than those of PG QSOs. Since classical QSOs have much lower FIR emissions than IR QSOs at a given bolometric luminosity (Hao et al., 2005a), and (30, 15) is correlated with (60, 25) (see Fig. 5 and §4.2), it is easy to understand why the (30, 15) slopes are steeper for IR QSOs than those of classical QSOs (for details see §4.2). On the other hand, the emissions from hot dust heated by central AGN are mainly in the MIR band. Furthermore, Spitzer observations reveal that star formation regions in star-forming galaxies also contribute significantly to the MIR continuum emission (e.g., Wu et al., 2005; Calzetti et al., 2007). Therefore, for IR QSOs, both starburst and central AGN contribute to the MIR continuum emission, leading to the MIR continuum of IR QSOs being stronger than those of ULIRGs. Thus the slopes of MIR to FIR continuum of IR QSOs are flatter than those of ULIRGs.
The histograms of EW (PAH 6.2m) show that the mean value of EW (PAH 6.2m) of IR QSOs (0.0310.024m) is between those of ULIRGs (0.3210.235m) and PG QSOs (0.0170.008m) and close to that of warm ULIRGs (0.040.05m; Desai et al. 2007). Considering the fraction of PAH detections for IR QSOs and PG QSOs being 70% (13/19) and 40% (11/27 in QUEST QSO sample) respectively, while the EW (PAH 6.2m) for pure AGN is less than 0.005-0.02m (Armus et al., 2007), the mean value of EW (PAH 6.2m) of IR QSOs is significantly larger than that of classical QSOs.
From the middle and right panels of Fig. 3 we see that the mean values of 6.2m PAH and [NeII]12.81m luminosities of IR QSOs are similar to those of ULIRGs, but one order of magnitude higher than those of PG QSOs. Apparently the PAH molecules in IR QSOs can survive the FUV and X-ray photons emitted by central AGN, suggesting that they are shielded by a large amount of gas and dust from radiation (see Schweitzer et al., 2006).
Since the bolometric luminosities (Lbol) of PG QSOs observed by IRS of Spitzer are systematically smaller than those of IR QSOs, where Lbol is calculated from the optical continuum emission (, Hao et al. 2005a), the differences in their IR continuum shapes may simply arise because more optically luminous QSOs have more extended dust tori. To check this possibility, we investigated the 6.2m PAH and [NeII]12.81m luminosities normalised by Lbol. Fig. 4 shows the distributions of L[PAH]/Lbol and L[NeII]/Lbol for IR QSOs and PG QSOs, respectively. It is clear from Fig. 4 that the mean values of L[PAH]/Lbol and L[NeII]/Lbol for IR QSOs are also about one order of magnitude higher than those of PG QSOs. Therefore, the different properties of 6.2m PAH and [NeII]12.81 emissions between IR QSOs and PG QSOs are unlikely from different dust tori, instead the differences arise because of different star formation properties (see section 4.2).
In summary, the mid-IR spectroscopic properties, including the continuum slope and emission line strengths, of IR QSOs, PG QSOs and ULIRGs are consistent with that IR QSOs are in a transitional phase from ULIRGs to classical QSOs, confirming the results from previous studies (Canalizo & Stockton, 2001; Hao et al., 2005a).
4.2 Statistics on spectral parameters
In this subsection, we will use the MIR spectroscopic features, including the MIR continuum slope (30, 15), 6.2m PAH and fine-structure emission lines, to investigate the origin of MIR emissions of IR QSOs. We will also use these properties, combined with FIR and optical properties, to disentangle the starburst and AGN contributions in these objects.
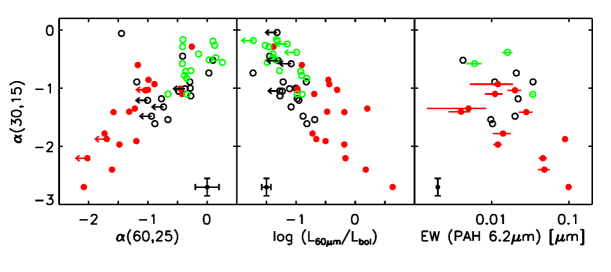
Fig. 5 shows the relations of (30, 15) vs. (60, 25) (left panel), (30, 15) vs. the FIR excess L60μm/Lbol (middle panel), and (30, 15) vs. the EW (PAH 6.2m) (right panel) for both IR QSOs and PG QSOs. It is clear from Fig. 5 that the colour indices of (30, 15) and (60, 25) are closely correlated, indicating that (30, 15) can express the relative strength of FIR to MIR emission for QSOs. The middle and right panels of Fig. 5 show the correlations between (30, 15) with FIR excess L60μm/Lbol, and between (30, 15) with the EW (PAH 6.2m). The EW (PAH 6.2m) is the ratio of PAH 6.2m emission line to 6m continuum. Since the 6.2m PAH emission is from star formation regions, and the 6m continuum traces the AGN contribution (e.g., Gallagher et al., 2007), thus the EW (PAH 6.2m) expresses the relative contribution of star formation to AGN (Schweitzer et al., 2006; Armus et al., 2007). In fact, Desai et al. (2007) also found the strong correlation between infrared spectral slope and the EW (PAH 6.2m) for ULIRGs, especially for ULIRGs with Seyfert 1 and Seyfert 2 optical spectra, while our results extend such relation to infrared luminous QSOs and PAH detected PG QSOs. We conclude that (30, 15), FIR excess and EW (PAH 6.2m) can serve as indicators of the relative contributions of starbursts to AGNs (Hao et al. 2005a and see below).
Ho & Keto (2007) suggest that the ionised neon fine-structure lines [NeII]12.81m and [NeIII]15.56m can be used as a SFR indicator for star-forming galaxies. Farrah et al. (2007b) extend this relation to ULIRGs. In addition, Schweitzer et al. (2006) found a strong correlation between the far-infrared continuum (L60μm) and low-ionisation [NeII] line emission for both PG QSOs and ULIRGs, and argued that the [NeII] line can also be used to estimate the SFR in QSO host galaxies. One advantage to use [NeII] 12.81m as a SFR estimator is that it suffers much less extinction than optical lines, such as and [OII]3727Å. However, there is still a debate about the origin of [NeII] emission, because the narrow line region of QSOs may also contribute substantially (e.g., Ho & Keto, 2007). Therefore, it is worth investigating the origin of [NeII]12.81m emission for IR QSOs by comparing the multi-wavelength properties of PG QSOs, IR QSOs and ULIRGs.
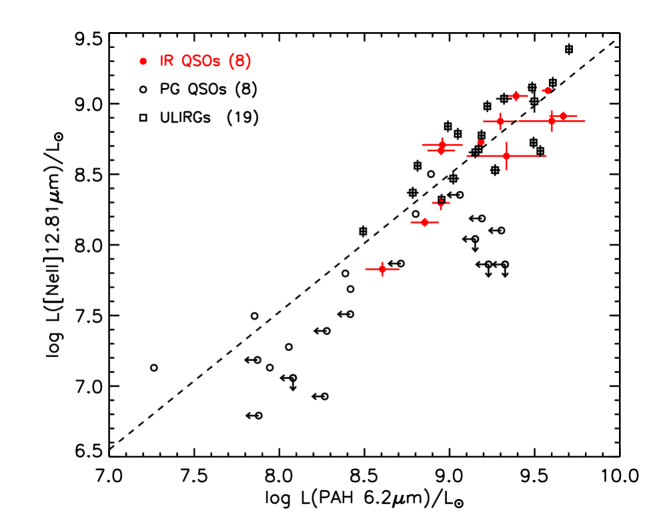
Fig. 6 shows the relation between PAH 6.2m and [NeII]12.81m luminosities for IR QSOs, ULIRGs and PG QSOs with firmly detected [NeII]12.81m and PAH 6.2m emissions. Because the PAH emissions are purely from star formation regions (Shi et al., 2007), the tight correlation between 6.2m PAH and [NeII]12.81m luminosities (at a statistical level of 99.99 with the Spearman Rank-order test) demonstrates that (at least part of) the [NeII] 12.81m emission is also from star formation regions. Note that for the PG QSOs shown in Fig. 6, their [NeII] 12.81m luminosities normalised by the bolometric luminosities of AGNs (L[NeII]/Lbol ratios, see below) are about three times higher than that of PAH undetected PG QSOs (see also Schweitzer et al. 2006). Therefore, it is likely that the star formation contributes significantly to the [NeII] emission not only for IR QSOs, but also for PG QSOs with detectable PAH emissions (Netzer et al., 2007).
The mean values of L[NeII]12.81μm/Lbol ratios are , , and for IR QSOs, PG QSOs, PAH-detected and PAH-undetected PG QSOs, respectively. Thus for the same bolometric luminosity of a central AGN, the mean [NeII]12.81m luminosity of IR QSOs is about one order of magnitude higher than that of classical QSOs. Taken together with the tight correlation between [NeII] and PAH luminosities (see above), we conclude that the [NeII]12.81m emission of IR QSOs is mainly from star formation, while the contribution from the narrow line region of AGNs is not significant ().
5 Discussion
By comparing the MIR spectroscopic properties of IR QSOs, ULIRGs and PG QSOs, we found that the indicators of relative contributions of starbursts to AGNs (such as colour index (30, 15) and EW [PAH 6.2m]) for IR QSOs are between those of ULIRGs and PG QSOs. These results are consistent with the findings of Canalizo & Stockton (2001) and Hao et al. (2005a) that (at least some) infrared luminous QSOs (IR QSOs) are at a transitional stage from ULIRGs to classical QSOs. Below we consider the star formation rates and AGN/star formation feedback in more detail.
5.1 SFR determined by the [NeII]12.81m and PAH luminosities
As we argued, the AGN contribution to [NeII] emission for ULIRGs and IR QSOs is probably very small, and there is a tight correlation between [NeII]12.81m and PAH 6.2m luminosities (see §4.2). We examine in more detail how they can be used as approximate SFR indicators for ULIRGs and IR QSOs.
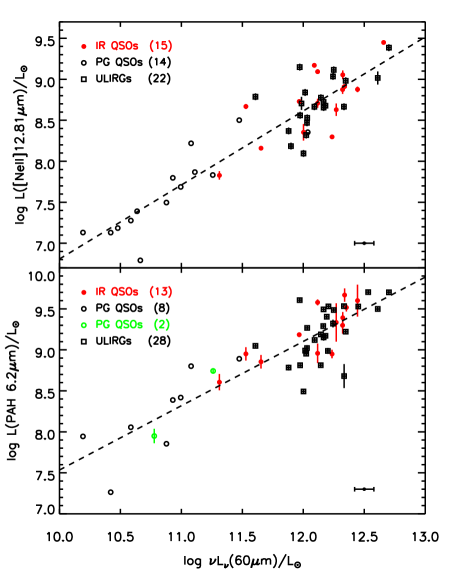
Fig. 7 shows the [NeII]12.81m (top panel) and PAH 6.2m (bottom panel) luminosities versus the 60m luminosity for IR QSOs, PG QSOs and ULIRGs with firmly detected [NeII]12.81m and PAH 6.2m emissions. A Spearman Rank-order analysis show that both correlations are significant at 99.99 level. The dashed lines in Fig. 7 represent the least-squares regression fits:
| (2) |
| (3) |
The fitting formula (2) is consistent with that of Ho & Keto (2007) for star-forming galaxies (within the large errors). Note that our sample objects have much higher and [NeII] luminosities than their star-forming galaxies. Thus both [NeII] 12.81m and PAH 6.2m luminosities can be used as approximate SFR indicators not only for normal star-forming galaxies, but also for galaxies with high infrared luminosities, such as ULIRGs and IR QSOs (see Brandl et al. 2006 and Farrah et al. 2007b).
However, the mean scatters (about 0.7 to 0.8 dex) in the relation of [NeII]12.81m, PAH 6.2m with luminosities are larger than that (about 0.6 dex) of star-forming galaxies with lower infrared luminosity (Ho & Keto 2007). Comparing Fig. 7 with Fig. 6, one can see that the scatter in the relation of [NeII]12.81m vs. PAH 6.2m luminosities (about 0.6 dex) is smaller than that in the relations of [NeII]12.81m, PAH 6.2m luminosities with L(60m). It is also clear that most large scatters are from ULIRGs. This is perhaps not surprising since the range in the 9.7m silicate absorption depth among ULIRGs is quite large (see Armus et al. 2007, Spoon et al. 2007). In short, the large scatters for ULIRGs seen in the relations may be due to complicated, patchy extinctions among these galaxies in the MIR band. A detailed discussion on extinction for ULIRGs can be found in Farrah et al. (2007b).
5.2 AGN/Star formation feedback in the transitional stage

One explanation for the observed correlation between spheroidal and black hole mass (e.g., Magorrian et al., 1998; Ferrarese & Ford, 2005) is that star formation and the growth of central black holes may be self-regulated: AGNs/star formation can drive nuclear outflows which in turn suppress further cooling and star formation (Silk & Rees 1998). While the detailed processes are still to be understood, it is now increasingly clear that feedback and outflows play an important role in galaxy formation and evolution.
So far most observational evidence for AGN feedback is from radio observations at the centre of clusters or groups of galaxies (Batcheldor et al., 2007). On the galaxy scale, evidence is still limited. As discussed above, IR QSOs have high SFRs and accretion rates (Hao et al., 2005a), outflow properties in these objects may thus provide hints on the feedback processes on galaxy or group scale.
It is well known that low-ionisation broad absorption line QSOs (loBAL QSOs) comprise about 15% of BAL QSO population. They are defined as a subclass of BAL QSOs with an obvious blueshifted absorption in Mg II 2795,2802 and other low-ionisation species (Weymann et al., 1991). Such absorption troughs arise from resonance absorption by outflowing gas and dust (Voit et al., 1993). In addition, there is a rare class of loBAL QSOs, showing absorption features from excited iron (termed as FeLoBAL QSOs). The outflow velocities for most BAL QSOs span a large range, up to a few times km s-1, which may be formed on a scale of and directly associated with the wind from an accretion disk or molecular torus (Weymann et al., 1985). However, recent spectral analyses based on Keck observations for LoBAL QSOs or FeLoBAL QSOs reveal that the outflow velocities of some LoBAL QSOs range from several hundred to several thousand km s-1 and the wind is from regions of a few hundred pc (e.g., Ganguly & Brotherton, 2008; Hamann et al., 2000; de Kool et al., 2002), which is much larger than the central engine of AGNs, but similar to the size of the nuclear starburst region of ULIRGs (Downes & Solomon, 1998).
On the other hand, Canalizo & Stockton (2002) studied four loBAL QSOs at z0.4 (Mrk 231, IRAS 140264341, IRAS F07599+6508, PG 1700+518; all four are in our sample) and found that all are ULIRGs with merging signatures. They argued that loBAL QSOs cannot simply be explained by orientation effects, rather, they are directly related to young systems, still surrounded by gas and dust. It represents a short stage in the early life of a large fraction of QSOs. Moreover, Farrah et al. (2007a) reported the detections of mid/far-infrared emission from 9 FeLoBAL QSOs by MIPS. They found that all of their objects are IR bright with infrared luminosities as high as ULIRGs. Thus all loBAL QSOs and FeLoBAL QSOs with MIR to FIR information are infrared ultra-luminous, suggesting a link among loBAL QSOs, FeLoBAL QSOs and IR QSOs.
For loBAL QSOs or FeLoBAL QSOs, the velocities of outflows can be measured from blueshifted absorption lines. Unfortunately it is still unclear whether most IR QSOs are loBAL QSOs or FeLoBAL QSOs, because not many IR QSOs have been observed in the UV. However, there are measurements for the blueshifts in the permitted optical emission lines for our IR QSO sample (Zheng et al., 2002). The line profiles often contain two Gaussian components, one broad and one narrow. The outflow velocities are determined by the blueshift of the broad Gaussian component relative to the narrow component of permitted emission lines (H) for IR QSOs (see Zheng et al., 2002). We assume the blueshifted broad Gaussian component is related to the outflow of clouds (Leighly, 2001; Batcheldor et al., 2007).
Fig. 8 shows the correlation between EW (PAH 6.2m) and outflow velocities for IR QSOs. As the outflow velocity increases, the EW (PAH 6.2m) decreases. Since the EW (PAH 6.2m) expresses the relative contribution of star formation to AGN in QSOs (see 4.2), the correlation shown in Fig. 8 implies that QSOs with higher outflow velocities have a lower ratio of SFR to accretion rate. It may be because more energetic AGNs and central massive starbursts can drive faster outflows which then suppress or even quench star formation by heating up or expelling the cold gas and dust in the QSO hosts, leading to a lower ratio of SFR to accretion rate. Another possibility is that the higher velocity outflows are more efficient in ejecting dust cocoons of AGNs, leading to AGNs becoming the dominant source compared with starbursts. We should caution, however, that the sample shown in Fig. 8 is small; a larger sample would allow us to better understand the relative importance of star formation and AGN in feedback and driving outflows.
6 Summary
In this work, we studied the MIR spectral properties of low-redshift IR QSOs based on spectroscopic observations with Spitzer IRS, and compared their properties with those of ULIRGs and optically-selected PG QSOs. The following are our main results:
1. The average MIR spectra, MIR spectral slopes, 6.2m PAH emission strengths and [NeII] 12.81m luminosities of IR QSOs are distinct from those of PG QSOs. The MIR properties of IR QSOs are intermediate between ULIRGs and optically-selected QSOs, indicating that IR QSOs are at a transitional stage from ULIRGs to classical QSOs.
2. From the correlations between (30, 15) with (60, 25), FIR excess L60μm/Lbol, and EW (PAH 6.2m) for both IR QSOs and PG QSOs, we find that the MIR colour index (30, 15) is a good indicator of the relative contribution of starbursts to AGNs for all QSOs.
3. Both PAH and [NeII]12.81m luminosities of IR QSOs are in the same range as those of ULIRGs, but are one order of magnitude higher than those of PG QSOs (see Fig. 3). From the tight correlation between PAH 6.2m and [NeII] 12.81m luminosities for IR QSOs, ULIRGs and PAH detected PG QSOs, and the fact that the L[NeII]/Lbol ratio for IR QSOs is about one order of magnitude higher than that of classical QSOs, we conclude that the [NeII] 12.81m emission of IR QSOs is dominated by star formation, thus their luminosity can be used as an approximate indicator of their SFRs.
4. Outflows in IR QSOs play an important role in suppressing star formation by heating and/or expelling cold gas surrounding nuclei of QSOs. Thus IR QSOs are an important observational sample to investigate AGN and star formation feedback processes.
Acknowledgements
We thank the anonymous referee for constructive comments and suggestions. We acknowledge Drs. J. Wang, D.-W. Xu, Y. Shi, S. Veilleux for advice and helpful discussions. We also thank Z.-H. Shang, Y.-L. Wu, K. Zhang for helpful discussion on the Spitzer IRS data reductions, and Sarah Bryan for a careful reading of the manuscript. CC acknowledges the support of the Tianjin Astrophysics Center (TAC) at Tianjin Normal University, and the full living and travel supports of the European Union Marie Curie Program for him to participate in the AGN/VLTI summer school held in Poland, 2007. SM acknowledges the travel support of the NSFC, the Chinese Academy of Sciences and the Tianjin municipal government. This work is based on observations made with the Spitzer Space Telescope, which is operated by the Jet Propulsion Laboratory, California Institute of Technology under a contract with NASA. The IRS was a collaborative venture between Cornell University and Ball Aerospace Corporation funded by NASA through the Jet Propulsion Laboratory and Ames Research Center. SMART was developed by the IRS Team at Cornell University and is available through the Spitzer Science Center at Caltech. This research has made use of the NASA/IPAC Extragalactic Database (NED) which is operated by the Jet Propulsion Laboratory, California Institute of Technology, under contract with the National Aeronautics and Space Administration. This project is supported by the NSF of China 10333060, 10778622 and 973 Program No.2007CB815405, 2007CB815406.
References
- Armus et al. (2006) Armus L., et al., 2006, ApJ, 640, 204
- Armus et al. (2007) Armus L., et al., 2007, ApJ, 656, 148
- Batcheldor et al. (2007) Batcheldor D., Tadhunter C., Holt J., Morganti R., O’Dea C. P., Axon D. J., & Koekemoer A., 2007, ApJ, 661, 70
- Boroson & Green (1992) Boroson T. A., & Green R. F., 1992, ApJS, 80, 109
- Brandl et al. (2006) Brandl B. R., et al., 2006, ApJ, 653, 1129
- Calzetti et al. (2007) Calzetti D., et al., 2007, ApJ, 666, 870
- Canalizo & Stockton (2001) Canalizo G., & Stockton A., 2001, ApJ, 555, 719
- Canalizo & Stockton (2002) Canalizo G., & Stockton A., 2002, ASP Conf. Ser. 255: Mass Outflow in Active Galactic Nuclei: New Perspectives, 255, 195
- Carilli et al. (2007) Carilli C. L., et al., 2007, ApJS, 172, 518
- Cui et al. (2001) Cui J., Xia X.-Y., Deng Z.-G., Mao S., & Zou Z.-L., 2001, AJ, 122, 63
- Desai et al. (2007) Desai V., et al., 2007, ApJ, 669, 810
- Downes & Solomon (1998) Downes D., & Solomon P. M., 1998, ApJ, 507, 615
- de Kool et al. (2002) de Kool M., Becker R. H., Arav N., Gregg M. D., & White R. L., 2002, ApJ, 570, 514
- Evans et al. (2006) Evans A. S., Solomon P. M., Tacconi L. J., Vavilkin T., & Downes D., 2006, AJ, 132, 2398
- Farrah et al. (2007a) Farrah D., Lacy M., Priddey R., Borys C., & Afonso J., 2007a, ApJ, 662, L59
- Farrah et al. (2007b) Farrah D., et al., 2007b, ApJ, 667, 149
- Ferrarese & Ford (2005) Ferrarese L., & Ford H., 2005, Space Science Reviews, 116, 523
- Gallagher et al. (2007) Gallagher S. C., Richards G. T., Lacy M., Hines D. C., Elitzur M., & Storrie-Lombardi L. J., 2007, ApJ, 661, 30
- Ganguly & Brotherton (2008) Ganguly R., & Brotherton M. S., 2008, ApJ, 672, 102
- Haas et al. (2003) Haas M., et al., 2003, A&A, 402, 87
- Hamann et al. (2000) Hamann F. W., Netzer H., & Shields J. C., 2000, ApJ, 536, 101
- Hao et al. (2005a) Hao C. N., Xia X. Y., Mao S., Wu H., & Deng Z. G., 2005a, ApJ, 625, 78
- Hao et al. (2008) Hao C. N., Xia X. Y., Mao S., Deng Z. G., & Wu H., 2008, Chinese Journal of Astronomy and Astrophysics, 8, 12
- Hao et al. (2005b) Hao L., et al., 2005b, ApJ, 625, L75
- Hao et al. (2007) Hao L., Weedman D. W., Spoon H. W. W., Marshall J. A., Levenson N. A., Elitzur M., & Houck J. R., 2007, ApJ, 655, L77
- Heckman et al. (2004) Heckman T. M., Kauffmann G., Brinchmann J., Charlot S., Tremonti C., & White S. D. M., 2004, ApJ, 613, 109
- Higdon et al. (2004) Higdon S. J. U., et al., 2004, PASP, 116, 975
- Ho (2005) Ho L. C., 2005, ApJ, 629, 680
- Ho & Keto (2007) Ho L. C., & Keto E., 2007, ApJ, 658, 314
- Houck et al. (1985) Houck, J. R., Schneider, D. P., Danielson, G. E., Neugebauer, G., Soifer, B. T., Beichman, C. A., & Lonsdale, C. J. 1985, ApJ, 290, L5
- Houck et al. (2004) Houck J. R., et al., 2004, ApJS, 154, 18
- Imanishi et al. (2007) Imanishi M., Dudley C. C., Maiolino R., Maloney P. R., Nakagawa T., & Risaliti G., 2007, ApJS, 171, 72
- Kim & Sanders (1998) Kim D.-C., & Sanders D. B., 1998, ApJS, 119, 41
- Lawrence et al. (1999) Lawrence, A., et al. 1999, MNRAS, 308, 897
- Leighly (2001) Leighly K. M., 2001, Probing the Physics of Active Galactic Nuclei, 224, 293
- Lípari et al. (2005) Lípari S., Terlevich R., Zheng W., Garcia-Lorenzo B., Sanchez S. F., & Bergmann M., 2005, MNRAS, 360, 416
- Lonsdale et al. (2006) Lonsdale C. J., Farrah D., & Smith H. E., 2006, Astrophysics Update 2, 285
- Low et al. (1989) Low F. J., Cutri R. M., Kleinmann S. G., & Huchra J. P., 1989, ApJ, 340, L1
- Magorrian et al. (1998) Magorrian J., et al., 1998, AJ, 115, 2285
- Netzer et al. (2007) Netzer H., et al., 2007, ApJ, 666, 806
- Neugebauer et al. (1987) Neugebauer G., Green R. F., Matthews K., Schmidt M., Soifer B. T., & Bennett J. 1987, ApJS, 63, 615
- Neugebauer & Matthews (1999) Neugebauer G., & Matthews K., 1999, AJ, 118, 35
- Rieke et al. (2004) Rieke G. H., et al., 2004, ApJS, 154, 25
- Rowan-Robinson (2000) Rowan-Robinson M., 2000, MNRAS, 316, 885
- Sanders et al. (1988) Sanders D. B., Soifer B. T., Elias J. H., Madore B. F., Matthews K., Neugebauer G., & Scoville N. Z., 1988, ApJ, 325, 74
- Sanders & Mirabel (1996) Sanders D. B., & Mirabel I. F., 1996, ARA&A, 34, 749
- Saunders et al. (2000) Saunders, W., et al. 2000, MNRAS, 317, 55
- Schmidt & Green (1983) Schmidt M., & Green R. F., 1983, ApJ, 269, 352
- Schweitzer et al. (2006) Schweitzer M., et al., 2006, ApJ, 649, 79
- Shi et al. (2007) Shi Y., et al., 2007, ApJ, 669, 841
- Silk & Rees (1998) Silk J., Rees M. J., 1998, A&A, 331, L1
- Smith et al. (2007) Smith J. D. T., et al., 2007, ApJ, 656, 770
- Spoon et al. (2002) Spoon H. W. W., Keane J. V., Tielens A. G. G. M., Lutz D., Moorwood A. F. M., & Laurent O., 2002, A&A, 385, 1022
- Spoon et al. (2007) Spoon H. W. W., Marshall J. A., Houck J. R., Elitzur M., Hao L., Armus L., Brandl B. R., & Charmandaris, V., 2007, ApJ, 654, L49
- Veilleux et al. (1999) Veilleux S., Kim D.-C., & Sanders D. B., 1999, ApJ, 522, 113
- Veilleux et al. (2002) Veilleux S., Kim D.-C., & Sanders D. B., 2002, ApJS, 143, 315
- Voit et al. (1993) Voit G. M., Weymann R. J., & Korista,K. T., 1993, ApJ, 413, 95
- Wang et al. (2006) Wang J., Wei J. Y., & He X. T., 2006, ApJ, 638, 106
- Wang et al. (2007) Wang R., et al., 2007, AJ, 134, 617
- Wang et al. (2008) Wang R., et al., 2008, ApJ, in press (arXiv:0806.3022)
- Werner et al. (2004) Werner M. W., et al., 2004, ApJS, 154, 1
- Weymann et al. (1985) Weymann R. J., Turnshek D. A., & Christiansen W. A., 1985, Astrophysics of Active Galaxies and Quasi-Stellar Objects, 333
- Weymann et al. (1991) Weymann R. J., Morris S. L., Foltz C. B., & Hewett P. C., 1991, ApJ, 373, 23
- Wu et al. (1998) Wu H., Zou Z. L., Xia X. Y., & Deng Z. G., 1998, A&AS, 127, 521
- Wu et al. (2005) Wu H., Cao C., Hao C.-N., Liu F.-S., Wang J.-L., Xia X.-Y., Deng Z.-G., & Young C. K.-S., 2005, ApJ, 632, L79
- Wu et al. (2007) Wu H., Zhu Y.-N., Cao C., & Qin B., 2007, ApJ, 668, 87
- Zheng et al. (1999) Zheng Z., Wu H., Mao S., Xia X.-Y., Deng Z.-G., & Zou Z.-L., 1999, A&A, 349, 735
- Zheng et al. (2002) Zheng X. Z., Xia X. Y., Mao S., Wu H., & Den, Z. G., 2002, AJ, 124, 18
| R.A. | Decl. | |||||
|---|---|---|---|---|---|---|
| Object | (J2000.0) | (J2000.0) | Redshift | log | log | SpecType |
| (1) | (2) | (3) | (4) | (5) | (6) | (7) |
| IR QSOs | ||||||
| I Zw 1 | 00 53 34.9 | 12 41 36 | 0.0611 | 11.310 | 11.050 | S1 |
| F002752859 | 00 30 04.2 | 28 42 25 | 0.2781 | 12.342 | 11.568 | QSO |
| 3C 48 | 01 37 41.3 | 33 09 35 | 0.3670 | 12.648 | 11.991 | QSO |
| Mrk 1014 | 01 59 50.2 | 00 23 41 | 0.1630 | 12.326 | 11.192 | QSO |
| F02054+0835 | 02 08 06.8 | 08 50 02 | 0.3450 | 12.466 | 11.819 | QSO |
| F07599+6508 | 08 04 33.1 | 64 59 49 | 0.1483 | 12.116 | 11.637 | QSO |
| F11119+3257 | 11 14 38.9 | 32 41 33 | 0.1890 | 12.322 | 12.089 | QSO |
| 3C 273 | 12 29 06.7 | 02 03 09 | 0.1583 | 12.263 | 12.427 | QSO |
| Mrk 231 | 12 56 14.2 | 56 52 25 | 0.0422 | 12.236 | 11.467 | QSO |
| F13218+0552 | 13 24 19.9 | 05 37 05 | 0.2051 | 12.270 | 11.467 | QSO |
| F13342+3932 | 13 36 24.1 | 39 17 31 | 0.1793 | 12.116 | 11.821 | QSO |
| F14026+4341 | 14 04 38.8 | 43 27 07 | 0.3233 | 12.445 | 11.930 | QSO |
| PG 1543+489 | 15 45 30.2 | 48 46 09 | 0.3996 | 12.344 | 11.843 | QSO |
| F154620450 | 15 48 56.8 | 04 59 34 | 0.0998 | 11.995 | 10.381 | S1 |
| PG 1613+658 | 16 13 57.2 | 65 43 10 | 0.1290 | 11.533 | 11.550 | QSO |
| PG 1700+518 | 17 01 24.8 | 51 49 20 | 0.2920 | 12.090 | 12.115 | QSO |
| F18216+6419 | 18 21 57.3 | 64 20 36 | 0.2970 | 12.659 | 12.607 | QSO |
| F200361547 | 20 06 31.7 | 15 39 08 | 0.1919 | 12.359 | 11.566 | QSO |
| F212191757 | 21 24 41.6 | 17 44 46 | 0.1120 | 11.661 | 10.952 | S1 |
| PG QSOs | ||||||
| PG 0804+761 | 08 10 58.6 | 76 02 42 | 0.1000 | 10.794 | 11.360 | QSO |
| PG 0838+770 | 08 44 45.2 | 76 53 09 | 0.1310 | 10.994 | 11.020 | S1 |
| PG 0844+349 | 08 47 42.4 | 34 45 04 | 0.0640 | 10.323 | 10.854 | S1 |
| PG 1004+130 | 10 07 26.1 | 12 48 56 | 0.2408 | 11.639 | 11.964 | QSO |
| PG 1119+120 | 11 21 47.1 | 11 44 18 | 0.0502 | 10.536 | 10.509 | S1 |
| PG 1149110 | 11 52 03.5 | 11 22 24 | 0.0490 | 10.435 | 10.299 | S1 |
| PG 1211+143 | 12 14 17.7 | 14 03 13 | 0.0809 | 11.084 | 11.414 | QSO |
| PG 1351+640 | 13 53 15.8 | 63 45 45 | 0.0882 | 11.248 | 11.203 | QSO |
| PG 1411+442 | 14 13 48.3 | 44 00 14 | 0.0896 | 10.579 | 10.945 | S1 |
| PG 1426+015 | 14 29 06.6 | 01 17 06 | 0.0865 | 10.753 | 11.194 | QSO |
| PG 1444+407 | 14 46 45.9 | 40 35 06 | 0.2673 | 11.556 | 11.636 | QSO |
| PG 1501+106 | 15 04 01.2 | 10 26 16 | 0.0364 | 10.468 | 10.649 | S1 |
| PG 1519+226 | 15 21 14.2 | 22 27 43 | 0.1370 | 10.963a | 11.001 | S1 |
| PG 1534+580 | 15 35 52.3 | 57 54 09 | 0.0296 | 9.663 | 10.069 | S1 |
| PG 1535+547 | 15 36 38.3 | 54 33 33 | 0.0389 | 9.742a | 10.530 | S1 |
| PG 1552+085 | 15 54 44.6 | 08 22 22 | 0.1190 | 10.782a | 10.974 | S1 |
| PG 1612+261 | 16 14 13.2 | 26 04 16 | 0.1309 | 11.053 | 11.019 | S1 |
| PG 1617+175 | 16 20 11.3 | 17 24 28 | 0.1124 | 10.637 | 11.140 | QSO |
| PG 2130+099 | 21 32 27.8 | 10 08 19 | 0.0630 | 10.748 | 10.876 | S1 |
Notes – Basic properties of IR QSOs and PG QSOs in our sample. Col.(1): source name; Col.(2)-(3): right ascension (hours, minutes, seconds) and declination (degrees, arcminutes, arcseconds), from NED; Col.(4): redshift, from NED; Col.(5): monochromatic luminosity at 60m; Col.(6): monochromatic luminosity at 5100Å, Lλ(5100Å). The values are derived from Hao et al. (2005a) except for F140264341 it is measured based on the SDSS spectrum, and for some PG QSOs not included in Hao et al. (2005a) their values were taken from Neugebauer et al. (1987) and calculated in the same manner as in Hao et al. (2005a); Col.(7): optical spectral classifications of IR QSOs (Seyfert 1 or QSO). The typical uncertainties of IR and optical luminosities are about 0.06 dex and 10-20%, respectively (Hao et al., 2005a).
aThe 60 m flux density is an upper limit.
| R.A. | Decl. | |||||
|---|---|---|---|---|---|---|
| Object | (J2000.0) | (J2000.0) | Redshift | log | (60, 25) | SpecType |
| (1) | (2) | (3) | (4) | (5) | (6) | (7) |
| F001880856 | 00 21 26.5 | 08 39 26 | 0.1284 | 12.166 | 2.22 | L |
| F003971312 | 00 42 15.5 | 12 56 03 | 0.2617 | 12.702 | 1.70a | H |
| F010042237 | 01 02 50.0 | 22 21 57 | 0.1177 | 12.031 | 1.42 | H |
| F011992307 | 01 22 20.9 | 22 52 07 | 0.1560 | 12.143 | 2.62a | H |
| F012980744 | 01 32 21.4 | 07 29 08 | 0.1362 | 12.201 | 2.49a | H |
| F013551814 | 01 37 57.4 | 17 59 21 | 0.1920 | 12.284 | 2.36a | H |
| Z03521+0028 | 03 54 42.2 | 00 37 03 | 0.1519 | 12.333 | 2.69 | L |
| F051892524 | 05 21 01.5 | 25 21 45 | 0.0426 | 11.880 | 1.57 | S2 |
| F08572+3915 | 09 00 25.4 | 39 03 54 | 0.0584 | 11.899 | 1.68 | L |
| F09463+8141 | 09 53 00.5 | 81 27 28 | 0.1560 | 12.093 | 3.38a | L |
| F10091+4704 | 10 12 16.7 | 46 49 43 | 0.2460 | 12.451 | 3.02a | L |
| F10378+1108 | 10 40 29.2 | 10 53 18 | 0.1362 | 12.167 | 2.60 | L |
| F110950238 | 11 12 03.4 | 02 54 22 | 0.1066 | 12.091 | 2.34 | L |
| F112231244 | 11 24 50.0 | 13 01 13 | 0.1990 | 12.354 | 2.61a | S2 |
| F11582+3020 | 12 00 46.8 | 30 04 15 | 0.2230 | 12.335 | 2.30a | L |
| F12032+1707 | 12 05 47.7 | 16 51 08 | 0.2170 | 12.389 | 2.01a | L |
| F120720444 | 12 09 45.1 | 05 01 14 | 0.1284 | 12.145 | 1.74 | S2 |
| F12112+0305 | 12 13 46.0 | 02 48 38 | 0.0733 | 12.164 | 3.22 | L |
| Mrk 273 | 13 44 42.1 | 55 53 13 | 0.0378 | 11.974 | 2.57 | S2 |
| F13451+1232 | 13 47 33.3 | 12 17 24 | 0.1217 | 11.985 | 1.20 | S2 |
| F14070+0525 | 14 09 31.2 | 05 11 32 | 0.2644 | 12.611 | 2.15a | S2 |
| F143481447 | 14 37 38.3 | 15 00 23 | 0.0827 | 12.182 | 3.00 | L |
| F15001+1433 | 15 02 31.9 | 14 21 35 | 0.1627 | 12.250 | 2.76 | S2 |
| F15206+3342 | 15 22 38.0 | 33 31 36 | 0.1244 | 11.971 | 1.86 | H |
| Arp 220 | 15 34 57.1 | 23 30 11 | 0.0181 | 12.002 | 2.94 | H |
| F160900139 | 16 11 40.5 | 01 47 06 | 0.1336 | 12.348 | 2.99 | L |
| F16300+1558 | 16 32 21.4 | 15 51 45 | 0.2417 | 12.532 | 2.83a | L |
| F16333+4630 | 16 34 52.6 | 46 24 53 | 0.1910 | 12.207 | 2.87a | L |
| NGC 6240 | 16 52 58.9 | 02 24 03 | 0.0245 | 11.608 | 2.16 | L |
| F17068+4027 | 17 08 32.1 | 40 23 28 | 0.1790 | 12.192 | 2.73 | H |
| F17179+5444 | 17 18 54.2 | 54 41 47 | 0.1470 | 12.015 | 2.18 | S2 |
| F204141651 | 20 44 18.2 | 16 40 16 | 0.0871 | 12.032 | 2.90 | H |
| F224911808 | 22 51 49.2 | 17 52 23 | 0.0778 | 12.024 | 2.62 | H |
| F23129+2548 | 23 15 21.4 | 26 04 32 | 0.1790 | 12.327 | 3.00a | L |
| F23498+2423 | 23 52 26.0 | 24 40 17 | 0.2120 | 12.244 | 1.82a | S2 |
Notes – Basic properties of non-Seyfert 1 ULIRGs in our sample. Col.(1): source name; Col.(2)-(3): right ascension (hours, minutes, seconds) and declination (degrees, arcminutes, arcseconds), from NED; Col.(4): redshift, from NED; Col.(5): monochromatic luminosity at 60m; Col.(6): infrared color index (60, 25); Col.(7): optical spectral type, derived from Veilleux et al. (1999) and Wu et al. (1998). The typical uncertainty of IR luminosities is about 0.06 dex (Hao et al., 2005a).
aThe 25 m flux density is an upper limit.
| Object | SL | LL | PID (L) | SH | LH | PID (H) |
|---|---|---|---|---|---|---|
| (1) | (2) | (3) | (4) | (5) | (6) | (7) |
| I Zw 1 | 214.68 | 214.68 | 14 | 431.46 | 260.95 | 14 |
| F002752859 | 260.95 | 231.46 | 105 | 3121.9 | 860.95 | 1096 |
| 3C 48 | 16.29 | 114.68 | 82 | … | … | … |
| Mrk 1014 | 314.68 | 231.46 | 105 | 631.46 | 460.95 | 105 |
| F02054+0835 | 260.95 | 231.46 | 105 | … | … | … |
| F07599+6508 | 314.68 | 231.46 | 105 | 631.46 | 460.95 | 105 |
| F11119+3257 | 160.95 | 331.46 | 105 | 3121.9 | 460.95 | 105 |
| 3C 273 | 314.68 | 314.68 | 105 | 631.46 | 460.95 | 105 |
| Mrk 231 | 214.68 | 56.29 | 105 | 631.46 | 460.95 | 105 |
| F13218+0552 | 160.95 | 331.46 | 105 | 3121.9 | 460.95 | 105 |
| F13342+3932 | 260.95 | 231.46 | 105 | 3121.9 | 2241.83 | 105 |
| F14026+4341 | 714.68 | 714.68 | 61 | 14121.9 | 2860.95 | 61 |
| PG 1543+489 | 260.95 | 2121.9 | 20142 | … | … | … |
| F154620450 | 160.95 | 331.46 | 105 | 3121.9 | 460.95 | 105 |
| PG 1613+658 | 260.95 | 2121.9 | 3187 & 20142 | 3121.9 | 10241.83 | 3187 |
| PG 1700+518 | 16.29 | 114.68 | 82 | 2121.9 | 7241.83 | 3187 |
| F18216+6419 | 114.68 | 131.46 | 82 | 3121.9 | 3241.83 | 3746 |
| F200361547 | 260.95 | 231.46 | 105 | … | … | … |
| F212191757 | 260.95 | … | 3187 | 2121.9 | 2241.83 | 3187 |
Notes – The integration times for each slit are given. The quantity is the number of DCEs “” ramp time (in sec) for a single nod. Col.(1): source name; Col.(2)-(4): integration times and program IDs for the low-resolution (short-low [SL] & long-low [LL] modes) observations; Col.(5)-(7): integration times and program IDs for the high-resolution (short-high [SH] & long-high [LH] modes) observations.
| Object | SL | PID (SL) | LL | PID (LL) |
|---|---|---|---|---|
| (1) | (2) | (3) | (4) | (5) |
| PG QSOs | ||||
| PG 0804+761 | 314.68 | 14 | 231.46 | 14 |
| PG 0838+770 | 2241.83 | 3187 | 2121.9 | 20142 |
| PG 0844+349 | 260.95 | 3187 | 2121.9 | 20142 |
| PG 1004+130 | 260.95 | 20142 | 2121.9 | 20142 |
| PG 1119+120 | 314.68 | 14 | 231.46 | 14 |
| PG 1149110 | 260.95 | 20142 | 2121.9 | 20142 |
| PG 1211+143 | 314.68 | 14 | 231.46 | 14 |
| PG 1351+640 | 314.68 | 14 | 231.46 | 14 |
| PG 1411+442 | 260.95 | 3187 | 1121.9 | 3421 |
| PG 1426+015 | 260.95 | 3187 | 2121.9 | 20142 |
| PG 1444+407 | 260.95 | 20142 | 2121.9 | 20142 |
| PG 1501+106 | 314.68 | 14 | 231.46 | 14 |
| PG 1519+226 | 260.95 | 20142 | 2121.9 | 20142 |
| PG 1534+580 | 260.95 | 20142 | 2121.9 | 20142 |
| PG 1535+547 | 360.95 | 3421 | 1121.9 | 3421 |
| PG 1552+085 | 260.95 | 20142 | 2121.9 | 20142 |
| PG 1612+261 | 260.95 | 20142 | 2121.9 | 20142 |
| PG 1617+175 | 360.95 | 3187 | 2121.9 | 20142 |
| PG 2130+099 | 314.68 | 14 | 231.46 | 14 |
| ULIRGs | ||||
| F001880856 | 260.95 | 105 | 331.46 | 105 |
| F003971312 | 260.95 | 105 | 331.46 | 105 |
| F010042237 | 160.95 | 105 | 231.46 | 105 |
| F011992307 | 260.95 | 105 | 331.46 | 105 |
| F012980744 | 260.95 | 105 | 231.46 | 105 |
| F013551814 | 260.95 | 105 | 231.46 | 105 |
| Z03521+0028 | 260.95 | 105 | 331.46 | 105 |
| F051892524 | 314.68 | 105 | 214.68 | 105 |
| F08572+3915 | 314.68 | 105 | 314.68 | 105 |
| F09463+8141 | 260.95 | 105 | 231.46 | 105 |
| F10091+4704 | 231.46 | 105 | 231.46 | 105 |
| F10378+1108 | 260.95 | 105 | 331.46 | 105 |
| F110950238 | 260.95 | 105 | 231.46 | 105 |
| F112231244 | 260.95 | 105 | 331.46 | 105 |
| F11582+3020 | 260.95 | 105 | 231.46 | 105 |
| F12032+1707 | 260.95 | 105 | 231.46 | 105 |
| F120720444 | 160.95 | 105 | 231.46 | 105 |
| F12112+0305 | 314.68 | 105 | 231.46 | 105 |
| Mrk 273 | 214.68 | 105 | 214.68 | 105 |
| F13451+1232 | 314.68 | 105 | 231.46 | 105 |
| F14070+0525 | 260.95 | 105 | 231.46 | 105 |
| F143481447 | 160.95 | 105 | 231.46 | 105 |
| F15001+1433 | 260.95 | 105 | 331.46 | 105 |
| F15206+3342 | 160.95 | 105 | 331.46 | 105 |
| Arp 220 | 314.68 | 105 | 56.29 | 105 |
| F160900139 | 160.95 | 105 | 331.46 | 105 |
| F16300+1558 | 260.95 | 105 | 531.46 | 105 |
| F16333+4630 | 260.95 | 105 | 231.46 | 105 |
| NGC 6240 | 214.68 | 105 | 214.68 | 105 |
| F17068+4027 | 260.95 | 105 | 331.46 | 105 |
| F17179+5444 | 260.95 | 105 | 331.46 | 105 |
| F204141651 | 160.95 | 105 | 231.46 | 105 |
| F224911808 | 160.95 | 105 | 231.46 | 105 |
| F23129+2548 | 360.95 | 105 | 531.46 | 105 |
| F23498+2423 | 260.95 | 105 | 231.46 | 105 |
Notes – The integration times for each slit are given. The quantity is the number of DCEs “” ramp time (in sec) for a single nod. Col.(1): source name; Col.(2)-(3): integration times and program IDs for the short-low (SL) mode observations; Col.(4)-(5): integration times and program IDs for the long-low (LL) mode observations.
| S15 | S30 | PAH 6.2m | EW(PAH) | [NeII]12.81m | |
|---|---|---|---|---|---|
| Object | (mJy) | (mJy) | (10-21W cm-2) | (m) | (10-21W cm-2) |
| (1) | (2) | (3) | (4) | (5) | (6) |
| I Zw 1 | 553.6 | 1186.0 | 17.2 | 0.011 | 2.87 |
| F002752859 | 93.9 | 249.7 | 7.36 | 0.028 | 1.29 |
| 3C 48 | 75.6 | 283.8a | 7.2 | 0.051 | … |
| Mrk 1014 | 225.9 | 1191.3 | 12.9 | 0.048 | 5.94 |
| F02054+0835 | 127.8 | 260.6a | 4.0 | 0.018 | … |
| F07599+6508 | 285.2 | 754.9 | 5.85 | 0.004 | 3.29 |
| F11119+3257 | 188.1 | 645.6 | 7.52 | 0.014 | 2.83 |
| 3C 273 | 336.7 | 410.4 | 9.4 | 0.004 | 1.26 |
| Mrk 231 | 3385.6 | 13241.2 | 81.8 | 0.012 | 18.24 |
| F13218+0552 | 288.1 | 734.2 | 6.80 | 0.005 | 1.34 |
| F13342+3932 | 101.7 | 373.1 | 16.1 | 0.089 | 5.26 |
| F14026+4341 | 140.0 | 267.0a | 4.45 | 0.012 | 0.84 |
| PG 1543+489 | 69.2 | 125.3a | 6.1 | 0.034 | … |
| F154620450 | 140.7 | 913.8 | 23.2 | 0.099 | 8.13 |
| PG 1613+658 | 127.1 | 261.0 | 7.80 | 0.020 | 4.07 |
| PG 1700+518 | 122.8 | 246.6a | 9.5 | 0.022 | 2.09 |
| F18216+6419 | 240.8 | 365.4a | 8.1 | 0.015 | 3.82 |
| F200361547 | 95.9 | 441.4 | 12.0 | 0.046 | … |
| F212191757 | … | … | 8.47 | 0.018 | 1.71 |
Notes – Mid-IR spectral properties of IR QSOs. Col.(1): source name; Col.(2)-(3): Continuum flux densities around 15 and 30m rest wavelength, the uncertainties of the measurements are typically 10; Col.(4)-(5): Flux and equivalent width (EW) of PAH emissions at 6.2m, upper limits (3) are derived adopting widths of 0.2m; Col.(6) fluxes of [NeII] 12.81m line.
aOutside the rest wavelength range available, the value given here was linearly extrapolated based on the logarithm of the 25m rest wavelength continuum level.
| S15 | S30 | PAH 6.2m | EW(PAH) | |
| Object | (mJy) | (mJy) | (10-21W cm-2) | (m) |
| (1) | (2) | (3) | (4) | (5) |
| PG QSOs | ||||
| PG 0804+761 | 125.5 | 150.8 | 7.4 | 0.012 |
| PG 0838+770 | 45.4 | 97.4 | 2.0 | 0.026 |
| PG 0844+349 | 105.5 | 155.1 | 6.5 | 0.018 |
| PG 1004+130 | 72.9 | 118.5 | 2.0 | 0.014 |
| PG 1119+120 | 176.9 | 303.9 | 2.1 | 0.008 |
| PG 1149110 | 140.3 | 249.6 | 2.1 | 0.019 |
| PG 1211+143 | 239.6 | 268.8 | 7.5 | 0.014 |
| PG 1351+640 | 249.4 | 536.2 | 10.9 | 0.034 |
| PG 1411+442 | 125.3 | 143.2 | 4.2 | 0.010 |
| PG 1426+015 | 136.1 | 181.2 | 5.2 | 0.013 |
| PG 1444+407 | 69.8 | 99.1 | 7.54 | 0.036 |
| PG 1501+106 | 297.6 | 424.9 | 3.4 | 0.008 |
| PG 1519+226 | 54.2 | 70.8 | 2.46 | 0.016 |
| PG 1534+580 | 107.2 | 149.1 | 2.08 | 0.008 |
| PG 1535+547 | 98.4 | 111.5 | 3.1 | 0.011 |
| PG 1552+085 | 79.7 | 94.2 | 1.3 | 0.017 |
| PG 1612+261 | 83.4 | 136.4 | 3.0 | 0.020 |
| PG 1617+175 | 53.8 | 65.7 | 3.2 | 0.020 |
| PG 2130+099 | 196.4 | 293.0 | 3.56 | 0.006 |
| ULIRGs | ||||
| F001880856 | 122.8 | 1052.7 | 27.5 | 0.187 |
| F003971312 | 90.1 | 523.5 | 9.14 | 0.018 |
| F010042237 | 306.4 | 1176.4 | 11.2 | 0.048 |
| F011992307 | 39.1 | 455.0 | 3.75 | 0.146 |
| F012980744 | 65.4 | 718.5 | 7.53 | 0.092 |
| F013551814 | 27.7 | 369.6 | 2.7 | 0.186 |
| Z03521+0028 | 50.6 | 980.1 | 20.9 | 1.086 |
| F051892524 | 1017.6 | 4994.1 | 54.8 | 0.034 |
| F08572+3915 | 657.6 | 3272.9 | 7.7 | 0.004 |
| F09463+8141 | 9.0 | 193.3 | 7.61 | 1.483 |
| F10091+4704 | 13.3 | 197.1 | 7.06 | 0.758 |
| F10378+1108 | 48.5 | 571.9 | 11.0 | 0.415 |
| F110950238 | 111.8 | 1112.0 | 3.7 | 0.025 |
| F112231244 | 19.0 | 214.3 | 2.2 | 0.065 |
| F11582+3020 | 32.5 | 352.8 | 1.25 | 0.022 |
| F12032+1707 | 45.5 | 428.8 | 7.1 | 0.161 |
| F120720444 | 197.3 | 878.6 | 13.6 | 0.106 |
| F12112+0305 | 106.4 | 1683.5 | 56.8 | 0.431 |
| Mrk 273 | 416.1 | 5068.8 | 74.8 | 0.129 |
| F13451+1232 | 286.5 | 996.7 | 3.0 | 0.013 |
| F14070+0525 | 21.6 | 304.0 | 5.59 | 0.187 |
| F143481447 | 82.7 | 1309.2 | 33.5 | 0.365 |
| F15001+1433 | 59.6 | 475.1 | 16.1 | 0.184 |
| F15206+3342 | 101.6 | 628.9 | 38.2 | 0.342 |
| Arp 220 | 1048.1 | 20907.7 | 161.0 | 0.272 |
| F160900139 | 76.5 | 808.3 | 13.5 | 0.107 |
| F16300+1558 | 25.7 | 490.4 | 11.0 | 0.282 |
| F16333+4630 | 20.2 | 260.9 | 12.5 | 0.529 |
| NGC 6240 | 752.1 | 5763.0 | 313.0 | 0.365 |
| F17068+4027 | 52.3 | 410.9 | 10.8 | 0.198 |
| F17179+5444 | 72.6 | 341.8 | 6.43 | 0.099 |
| F204141651 | 61.7 | 1397.4 | 37.5 | 0.587 |
| F224911808 | 82.9 | 1473.3 | 23.1 | 0.465 |
| F23129+2548 | 40.2 | 434.9 | 1.1 | 0.021 |
| F23498+2423 | 46.4 | 239.7 | 6.11 | 0.053 |
Notes – Mid-IR spectral properties of PG QSOs and ULIRGs in our sample. The definition of columns is the same as in Table 5.