11email: Karine.demyk@cesr.fr 22institutetext: Departamento de Fisica Aplicada, Facultad de Ciencias Experimentales, Universidad de Huelva, 21071 Huelva, Spain
Detection of vibrationally excited methyl formate in W51 e2
Abstract
Context. Hot cores in molecular clouds, such as Orion KL, Sgr B2, W51 e1/e2, are characterized by the presence of molecules at temperature high enough to significantly populate their low-frequency vibrationally excited states. For complex organic molecules, characterized by a dense spectrum both in the ground state and in the excited states, such as methyl formate, ethyl cyanide or dimethyl ether, lines from vibrationally excited states certainly participate to the spectral confusion.
Aims. Thanks to the recent laboratory study of the first torsional excited mode of methyl formate, we have searched for methyl formate, HCOOCH3, in its first torsionally excited state (=1) in the molecular cloud W51 e2.
Methods. We have performed observations of the molecular cloud W51 e2 in different spectral regions at 1.3, 2 and 3 mm with the IRAM 30 m single dish antenna.
Results. Methyl formate in its first torsionally excited state (=1 at 131 cm-1) is detected for the first time toward W51 e2. 82 transitions have been detected among which 46 are unblended with other species. For a total of 16 A-E pairs in the observed spectrum, 9 are unblended; these 9 pairs are all detected. All transitions from excited methyl formate within the observed spectral range are actually detected and no strong lines are missing. The column density of the excited state is comparable to that of the ground state. For a source size of 7″we find that = 104 14 K and N = 9.4 1016 cm-2 for the excited state and = 176 24 K and N = 1.7 1017 cm-2 for the ground state. Lines from ethyl cyanide in its two first excited states (=1, torsion mode at 212 cm-1) and (=1, CCN in-plane bending mode at 206 cm-1) are also present in the observed spectrum. However blending problems prevent a precise estimate of its abundance. However as for methyl formate it should be comparable with the ground state for which we find = 103 9 K and N = 3.7 1015 cm-2 for a 7″source size.
Conclusions. With regard to the number of lines of excited methyl formate and ethyl cyanide detected in W51 e2, it appears that excited states of large molecules certainly account for a large number of unidentified lines in spectral survey of molecular clouds.
Key Words.:
Line: identification – Methods: observational – ISM: molecules – ISM: abundances – ISM: individual objects: W51 e2 – Radio lines: ISM1 Introduction
W51 e2 is a hot core part of the W51 HII region located in the Sagittarius spiral arm at a distance of about 7-8 kpc. It is a region of high-mass star formation. W51 e2 and W51 e1 are thought to be important star-forming cores. They exhibit a rich chemistry, comparable to that observed in Orion or in Sagittarius. Numerous large organic molecules have been observed towards them. CH3CN and CS maps were studied by Zhang et al. (1998). Formic acid (HCOOH) was mapped by Liu et al. (2001). Methyl formate (HCOOCH3) and ethyl cyanide (CH3CH2CN) were observed in several studies (Liu et al. 2001; Ikeda et al. 2001; Remijan et al. 2002). Ikeda et al. (2001) studied ethylene oxide (c-C2H4O) and its isomer acetaldehyde (CH3CHO). Acetic acid (CH3COOH) was detected by Remijan et al. (2002) with a fractional abundance of (1-6) 10-2 relative to HCOOCH3. Glycine, whose presence may be suggested from the observations of acetic acid with which it shares common structural elements, was not detected in W51 e2 (Snyder et al. 2005). Recently, trans-ethyl methyl ether was detected in W51 e2 (Fuchs et al. 2005).
The rotational temperature of most of these large molecular species is high. Liu et al. (2001) estimated the rotational temperature in W51 e2 to be in the 200-300 K range. From high resolution observations of CH3CN analyzed with statistical equilibrium models, Remijan et al. (2004) derived the kinetic temperature in W51 e2 to be Tkin = 153(21) K. At such temperature, low-energy vibrational excited states can be significantly populated. Transitions from vibrationally excited states have indeed been observed in other sources such as in Sgr B2(N-LMH) for C2H3CN, CH3CH2OH (Nummelin et al. 1998) and CH3CH2CN (Mehringer et al. 2004). Recently, lines from torsionally excited methyl formate have been identified in Orion KL (Kobayashi et al. 2007).
In this study we present the first detection of excited methyl formate and ethyl cyanide in the molecular cloud W51 e2. The initial project was to look for methyl carbamate (NH2COOCH3), an isomer of glycine (NH2CH2COOH) which has a larger dipole moment, making its detection more favorable than glycine. It was not detected. However, few strong unidentified lines in the data attracted our attention and were possibly attributed to methyl formate in its first torsional excited state. Further observations confirmed this detection and also lead to the detection of excited ethyl cyanide in W51 e2. The first vibrationally excited state of methyl formate is the CH3 torsion mode, , hereafter called =1, at 131 cm-1 (188 K). The rotational spectrum in this excited state was measured and analyzed by Ogata et al. (2004). Ethyl cyanide has two close vibrationally excited states, the CCN in-plane bending mode, , hereafter called =1, at 206 cm-1 (296 K) and the CH3 torsion mode, , hereafter called =1, at 212 cm-1 (305 K). A preliminary analysis of the rotational spectrum in these two excited states is presented in the paper from Mehringer et al. (2004).
The observations and the methods used for the data analysis are described in Sect. 2 and Sect. 3, respectively. The study of methyl formate and ethyl cyanide in the ground and excited state is presented in Sect. 4 and Sect. 5, respectively. The search for methyl carbamate and glycine is presented in Sect. 6. The discussion is carried out in Sect. 7.
2 Observations
The observations were performed with the IRAM 30m antenna at Pico Veleta (Spain) in June 2003 and June 2006. W51 e2 was observed at the position (2000) = 19°23′43.9″and (2000) = 14°30′34.8″in position switching mode with the OFF position located at = 300 ″and = 0 ″.
Several spectral windows in the 80-250 GHz range were observed in order to include as many transitions as possible for the searched molecules (excited methyl formate and ethyl cyanide for the 2006 data and methyl carbamate and glycine for the 2003 data) and as few transitions as possible of other molecules having numerous strong lines (such as methyl formate and ethyl cyanide in the ground state, dimethyl ether, etc.).
All lines were observed with an array of 4 receivers (in single side band mode) set at the appropriate frequencies. The spectrometers used are a low resolution 1 MHz filter bank and an autocorrelator with a spectral resolution in the 40-320 kHz range, split between different receivers. Focus and pointing were regularly checked on the nearby ultra compact HII region K 3-50A. The rejection of the image band (USB) was of about 26 dB at 3 mm, 12 dB at 2 mm, 15 dB at 1.3 mm and 10 dB at 1.1 mm. The system temperature was typically 100-200 K, 200-700 K, 200-700 K and 400-1500 K at 3, 2, 1.3 and 1.1 mm, respectively. The total usable ON+OFF integration time varies from 30 to 50 minutes depending on the frequency range. The beam size is 22 ″, 17 ″and 10.5 ″at 3, 2 and 1.3 mm, respectively. The spectra are presented in main beam temperature unit which is calculated from the antenna temperature: Tmb = Feff/Beff . The data were reduced using the GILDAS package.
3 Analysis
For the data analysis we assume that local thermodynamic equilibrium (LTE) is reached, i.e. we assume that the excitation, rotational and vibrational temperatures are equal to the kinetic temperature in the emitting region and that the lines are thermalized, i.e. their level population is described by a Boltzmann distribution at that temperature. The validity of this assumption will be discussed later in Sect. 7.
The data were analyzed using the classical rotational diagram method to estimate the rotational temperature and the column density together with their uncertainties for the different identified species. We adopt the formulation from Turner (1991), corrected for beam dilution effects:
| (1) |
where W is the integrated line intensity in K.km.s-1, the line frequency, S the line strength in Debye2, the reduced nuclear spin statistical weight, the K-level degeneracy, Q is the partition function, the upper state energy, N is the total column density and T the excitation temperature. Assuming a gaussian beam, the beam dilution factor b is given by:
| (2) |
where and are, respectively, the source and telescope beam size in arcsecond.
Beam dilution effects were taken into account both in the rotational diagram analysis and in the emission modeling (see below). The emission region in W51 e2 is observed to be smaller than 10″for most organic molecules (Remijan et al. 2002; Liu et al. 2001). Consequently beam dilution effects are important at low frequency at which the IRAM 30m antenna beam size is significantly larger (29″at 86 GHz).
We have compared the observed spectrum with simulated spectra calculated using a simple emission model at local thermodynamic equilibrium (LTE). The expression for the simulated main beam temperature for one molecule is thus:
| (3) |
where J is the source function:
| (4) |
and
| (5) |
is the optical depth, summed over all the transitions of the molecules:
| (6) |
and is the line profile:
| (7) |
is the Einstein coefficient, the energy of the transition, the energy of the lower state, is the upper state degeneracy, Q the partition function, is the Doppler width of the line, b is the beam dilution correction factor and is the total column density.
In hot cores, the temperature is such that the low-energy vibrational and/or torsional excited modes are significantly populated. Consequently we have used the vibrational-rotational partition function, Qrv, instead of the pure rotational partition function. Assuming non-interacting harmonic vibrational levels and rigid rotor levels, the ro-vibrational partition function is approximated by (see Gordy & Cook 1984):
| (8) |
where is the frequency of the vibrational mode i, its degeneracy, and Qrot is the rotational partition function. Qrot is approximated by:
| (9) |
where is the symmetry number (see Gordy & Cook 1984). At LTE, the temperature used to calculate the rotational and vibrational partition function is the same, we thus implicitly assume that Tvib = Trot, an hypothesis which may not be valid (see Sect.7). For methyl formate which has one internal rotor, rotational transitions are split into A and E components and is equal to 2. To calculate the partition function, we have considered the first excited state of methyl formate at 131 cm-1. For ethyl cyanide, we have used the partition function given by Mehringer et al. (2004) which is calculated by summing the rotational states of the ground state and of the first two excited states of ethyl cyanide at 206 and 212 cm-1. For methyl carbamate we have used the partition function in the ground vibrational state given by Groner et al. (2007).
4 Torsionally excited methyl formate
The prediction of the methyl formate lines is based on the most recent work on this species from Carvajal et al. (2007). In this work, all experimental data available on the ground and excited states (3496 and 774 microwave lines, respectively) in the 7-200 GHz frequency range, covering the J values up to 43 in the ground state and up to 18 in the first excited state =1, were collected from previously published studies (Ogata et al. 2004; Oesterling et al. 1999; Plummer et al. 1986, 1984; Demaison et al. 1984). Carvajal et al. (2007) also added 434 new lines of methyl formate in the ground state, measured in Lille in the 567-669 GHz spectral range and corresponding to transitions with J and K values up to 62 and 22, respectively. This dataset was fitted within almost experimental accuracy (root-mean-square deviations of 94 kHz and 84 kHz for the 3496 (774) lines of the ground torsional state and of the excited state =1, respectively) using the so-called rho axis method (RAM) described in the literature (Hougen et al. 1994) and a model extended to include perturbation terms through eighth order. The spectroscopic parameters and the details on the fitting procedure are given in the paper from Carvajal et al. (2007) in which a table presenting all the fitted experimental frequencies, measurement uncertainties, calculated frequencies, observed-calculated values , line strengths, energy levels as well as identification of the transitions, is available as Supplementary data.
For the detection in the W51 e2 spectrum, we have provided a line-list of predicted line-center frequencies and line intensities based on an internal rotation model (RAM or Rho Axis Method). This method and the code111A version of the program is available at the web site (http://www.ifpan.edu.pl/kisiel/introt/introt.htmbelgi) and other versions can be available by I. Kleiner (see the web site for more information). developed was used for several molecules detected in the interstellar medium (acetaldehyde, CH3COH, (Kleiner et al. 1996), acetamide CH3CONH2, (Hollis et al. 2006) and acetic acid CH3COOH, (Ilyushin et al. 2007). The laboratory measurements and predicted line frequencies of transitions in the first excited torsional state =1 of methyl formate in the spectral range used in the present detection are presented in Table LABEL:mtfvt1lab together with the line assignment, the observed-calculated value, the experimental accuracy, the calculated uncertainty, the line strength and the energy of the lower level. 222A prediction of the overall spectrum of methyl formate in the ground and first excited states, on a large frequency range will be published soon (Kleiner et al. in preparation).
More than eighty transitions from torsionally excited methyl formate, 82 precisely, are detected in the source among which 46 are not blended.
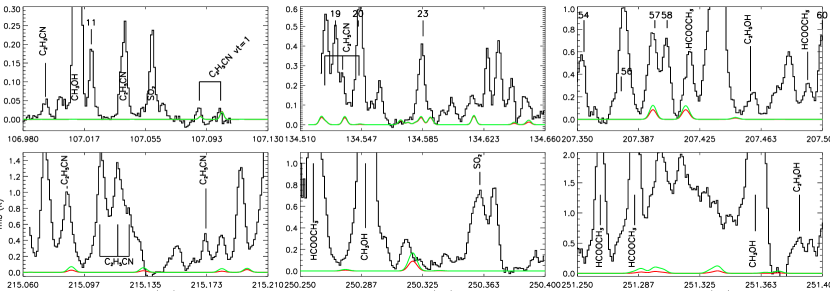
Taking into account possible blending, we find that all lines from torsionally excited methyl formate predicted to be intense enough to be detectable are present in the observed spectra. Furthermore, no lines, such as unobserved strong lines, contradicts the identification in the observed spectral range. The internal rotation of the methyl group of methyl formate splits the transitions into A and E components having the same intensity. Among the 16 observed A-E pairs, 9 are not blended (see Fig. 1). The intensity of the lines in a A-E pair, when none of the lines in the pair is blended, is consistent with the expected ones, strengthening the identification of excited methyl formate in this source. The detected lines (observed frequency, integrated intensity and line intensity) are listed in Table LABEL:mtfvt1 together with the laboratory or calculated frequency, the quantum numbers of the transition, its line strength and lower state energy. The first column of Table LABEL:mtfvt1 indicates the line number which is used to label the lines in Fig. 1. The number in parenthesis points out the A or E line associated to the transition when it is observed. However about half of the lines are blended. Comments have been added in Table LABEL:mtfvt1 to indicate line blenders when they are identified.
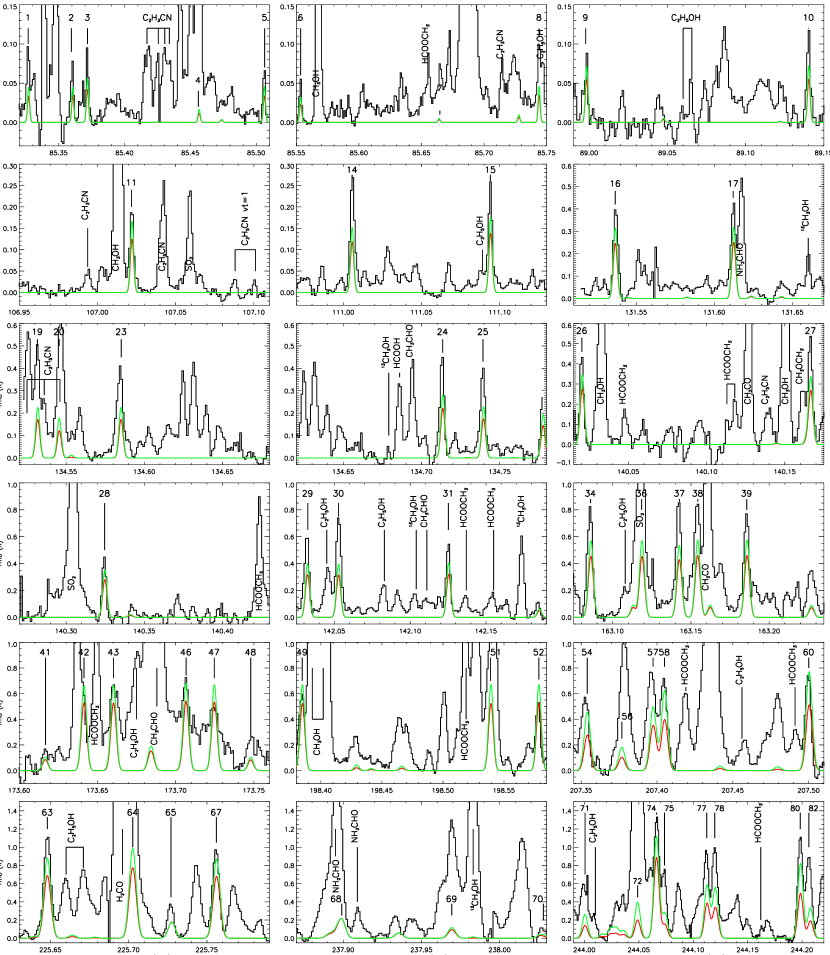
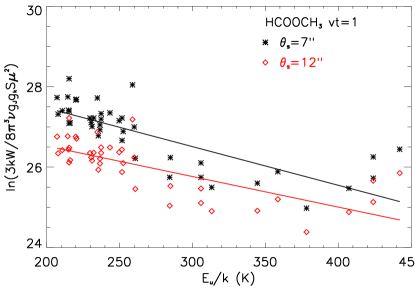
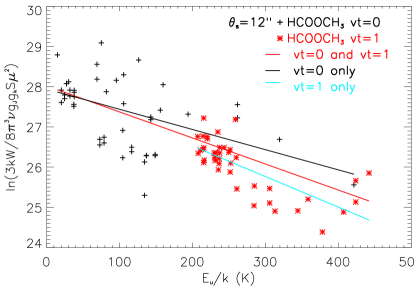
The non-blended lines have been used to estimate the rotational temperature and column density of excited HCOOCH3 using the rotational diagram method (Fig.2, Table 4). Remijan et al. (2002) have mapped W51 e2 with BIMA in two transitions of HCOOCH3 at 228.629 GHz and 90.146 GHz. The size of the emission region in these lines is of about 7″and 12″, respectively. Adopting these values for torsionally excited HCOOCH3, we find a rotational temperature and a column density of = 131 20 K and N = 3.4 1016 cm-2 for a source size of 12″and = 104 14 K and N = 9.4 1016 cm-2 for a source size of 7″(Table 4). A separate analysis of the A and E lines of excited methyl formate gives compatible values, within the uncertainty, for the rotational temperature and column density. Transitions from the ground state of HCOOCH3 have been detected too. Using the rotational diagram method we find for HCOOCH3 =0: = 199 28 K and N = 9.6 1016 cm-2 for a 12 ″source (Fig. 3). If we consider both lines from the ground state and from =1 we find = 154 8 K and N = 5.6 1016 cm-2 for a 12 ″source (Fig. 3, Table 4). These temperatures and column densities have been used to model the emission of methyl formate in the source. The comparison of the modelled spectra with the observations is shown in Fig. 1 for a number of lines from HCOOCH3, =1.
| Molecules | Source size | ||
|---|---|---|---|
| 7″ | 12″ | ||
| HCOOCH3 | T (K) | 176 24 | 199 28 |
| =0 | N (cm-2) | 17.0 1016 | 9.6 1016 |
| HCOOCH3 | T (K) | 104 14 | 131 20 |
| =1 | N (cm-2) | 9.4 1016 | 3.4 1016 |
| HCOOCH3 | T (K) | 144 7 | 154 8 |
| =0 + =1 | N (cm-2) | 11.4 1016 | 5.6 1016 |
| CH3CH2CN | T (K) | 103 9 | 114 11 |
| N (cm-2) | 3.7 1015 | 1.7 1015 | |
5 Ethyl cyanide
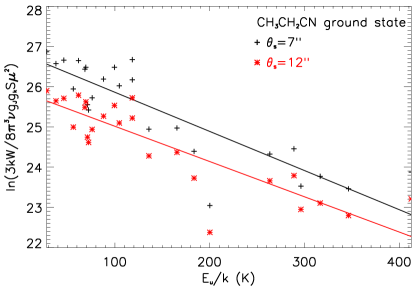
Severals tens of lines from ethyl cyanide in the ground state are observed in the spectra. A large number of these lines are not blended and their energy covers a wide range, allowing to plot a rotational diagram (Fig. 4). Adopting a source size of 12″as for the ground state of methyl formate, we find a rotational temperature of = 114 11 K and a column density N = 1.7 1015 cm-2. Adopting a smaller source of 7″does not change significantly the rotational temperature but changes the column density : = 103 9 K and a column density N = 3.7 1015 cm-2 (Table 4).
Ethyl cyanide appears to be colder than previously found. Liu et al. (2001) adopt a temperature of 200 K and find an abundance for this molecule of 4 1015 cm-2. However their analysis is based on lines having energies lower than 113 K. If we limit ourselves to low energy transitions we find = 184 K and a column density N = 1.3 1016 cm-2. Ikeda et al. (2001) fixed to 150 K and found a column density of N = 7 1014 cm-2.
We have searched for transitions from the first excited bending mode (in-plane CCN bending mode) of ethyl cyanide at 206 cm-1 (designated by =1) and from the first torsional excited state, =1, at 212 cm-1. These 2 states, together with the CCN out-of-plane bending mode at 378 cm-1, have been studied by Fukuyama et al. (1999) in the 8-200 GHz range for J and Ka than 16 and 2, respectively. Lines from the two lowest energy states =1 and =1 have been detected toward SgrB2 by Mehringer et al. (2004). This paper presents the molecular theory used for the spectral analysis of new measurements of excited ethyl cyanide in the 85-400 GHz range for J and Ka than 50 and 15, respectively. However, the complete analysis has not been published yet and the prediction for the line frequencies and intensities was obtained from J. Pearson (private communication).
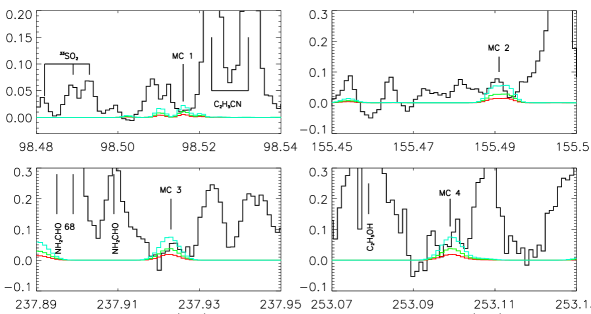
Most of the lines belonging to the excited states =1 and =1 are blended with other strong lines, identified or not (Table LABEL:propiovt1). However few lines allow the column density of vibrationally excited ethyl cyanide to be constrained (Table LABEL:propiovt1). We have estimated the upper limit on the abundance of excited CH3CH2CN by comparing the emission spectrum of excited ethyl cyanide simulated with the LTE model with the observed spectra, for different temperatures and column densities (Fig. 5). Adopting the same temperature as the ground state (100 K) and a higher temperature of 200 K we find that the column density of vibrationally excited ethyl cyanide is 1016cm-2 and 5 1015cm-2, respectively.
6 Methyl carbamate and glycine
The initial aim of the observations was to search for methyl carbamate (NH2COOCH3), an isomer of glycine (NH2CH2COOH). Methyl carbamate has a strong dipole moment and is energetically more stable than glycine, two reasons that make it a good candidate for interstellar detection. The rotational spectrum of methyl carbamate in the A torsional substate was studied in the 8-240 GHz frequency range (Bakri et al. 2002; Ilyushin et al. 2006). This study was recently extended by Groner et al. (2007) who measured transitions of both A and E torsional substates up to 371 GHz. Our first analysis of the observations from 2003 was performed with a prediction of lines frequencies and intensities made for the A-transitions from the work from Bakri et al. (2002). We have then made a new analysis of our data from 2003 and 2006 with the predictions given by Groner et al. (2007).
Several tens of lines from methyl carbamate were searched in spectral regions carefully chosen in order to avoid or limit confusion with spectral lines from other molecules. However we did not detect methyl carbamate in our data. Furthermore, despite everything, most of the lines are fully blended and only very few lines allow us to constrain the upper limit of the abundance of methyl carbamate in W51 e2.
By comparing the simulated emission spectrum of methyl carbamate at different temperatures and source sizes with the observed spectrum (Fig.6) we have constrained the upper limit of methyl carbamate in this source. For a small emission region (7″) and warm gas (200 K) we found N 5 1014 cm-2. This upper limit decreases as the rotational temperature and/or the size of the emission source decreases. We find N 2 1014 cm-2 for = 100 K and = 12″and N 8 1013 cm-2 for = 50 K and = 30″.
Numerous transitions from both conformers of glycine fall within our observed spectral ranges. Glycine is not detected in the spectra. Almost all the lines are blended and only few of them may be used to estimate roughly the upper limit of glycine in W51 e2. This upper limit varies by an order of magnitude depending on the source size, and rotational temperature. Assuming a rotational temperature of 100 K the upper limit on the column density of glycine is 3 1014 cm2 for a 7″source size and 6 1013 cm2 for a 30″source size.
7 Discussion
We find that the rotational temperatures derived from the rotational diagram analysis are different from the kinetic temperature, Tkin = 153(21) K derived by Remijan et al. (2004). The rotational temperature of ethyl cyanide (103 - 114 K) is lower than Tkin independently of the adopted source size. It is higher than Tkin if we consider methyl formate in its ground state (176 - 199 K), lower if we consider only the excited state (104 - 131 K) and of the same order if we consider simultaneously the ground state and the first excited state of methyl formate (144 -154 K). All this tends to indicates that the LTE hypothesis is probably not fully valid. However, despite these possible departure from LTE, the rotational diagram method which implicitly assume that LTE is reached and that all temperature are equivalent (i.e. Texc = Tkin = Trot = Tvib), is the only one left for us to get an estimation of the excitation temperature since a statistical analysis is ruled out by the absence of known collision rates for the studied molecules.
The relevance of the LTE assumption within each rotational level may also be evaluated by comparing the cloud density to the critical density of each vibrational state. Collisional rates are not known for molecules as complex as methyl formate or ethyl cyanide. However, it is possible to estimate roughly the critical density for these molecules by adopting the value of methanol interacting with H2, of the order of a few 10-11 cm3.s-1 (Pottage et al. 2004) and assuming it is the same for the ground and vibrational excited states. The Einstein coefficients of the rotational transitions are in the range 10-5-10-6 s-1. The critical density is thus of the order of 105-106 cm-3, i.e., comparable to the hydrogen density in W51 e2 estimated to be nH = 5(2) 105 cm-3 (Remijan et al. 2004). There is thus a competition between collisional and radiative excitation and it is clear that the levels are probably not all thermalized.
The excitation mechanism populating the observed excited state of methyl formate and ethyl cyanide may be infered in a similar way. The Einstein coefficients for ro-vibrational transitions from the excited states to the ground state are of the order of a few 10-1 s-1, much greater than for rotational transitions within the excited state (10-5-10-6 s-1). Thus, adopting the same value for the collisional rate as before (a few 10-11 cm3.s-1), the density needed to thermalize the levels in the excited state by collisions must be greater than the critical density which is of the order of 1010 cm-3. The dust in W51 e2 has a temperature of about 140 K (Sollins et al. 2004) and thus emits efficiently at the wavelength of the excited states of both molecules. It is thus most probable that the excited states of methyl formate and ethyl cyanide are populated by radiative processes rather than by collisions.
We find that the rotational temperature of the gas decreases when the source size gets smaller. This is surprising since it is expected that the deepest regions of hot cores are also the warmest. The observed transitions are optically thin for the adopted source sizes of 12″and 7 ″. BIMA observations of methyl formate in W51 e2 (Remijan et al. 2002) show that the emission region is smaller for high energy transition than for low energy transition. The size of the emission region is around 12″for the 72,5-62,4 transition at 90146 MHz corresponding to an energy of 10 cm-1 (15 K) and around 7″for the 185,13-175,12 transition at 228629 MHz corresponding to an energy of 75 cm-1 (108 K). More interferometric observations are needed to locate precisely the emission region of methyl formate and ethyl cyanide in the ground and excited state and understand their temperature distribution.
The presence of methyl formate in torsional excited state in hot cores such as W51 e2 and Orion KL (Kobayashi et al. 2007) is not surprising. Methyl formate is very abundant and its torsional mode has a very low energy (188 K). By comparison, it is not surprising that ethyl cyanide is more difficult to detect: it is less abundant and its excited states lie at slightly higher energy, around 300 K. However it is clear that observations having better signal to noise, better spectral and angular resolution, such as forthcoming observations from Herschel and ALMA, will reveal much more lines from excited states of these molecules but also of abundant large molecules possessing low-frequency vibrational states. For example dimethyl ether, CH3OCH3, has two torsional modes at about 203 and 242 cm-1 and transitions from these modes should be present in the spectra of hot cores. More generally, a large number of unidentified lines reported in the spectra of hot molecular clouds should be due to transitions from abundant molecules in excited states.
Acknowledgements.
The authors would like to thank Alexandre Faure for fruitful discussions, Jean Demaison and Isabelle Kleiner for invaluable help in the methyl formate study and John Pearson for providing us with the excited ethyl cyanide spectrum. We acknowledge all the Pico Veleta IRAM staff for their help during the observations. We thank the referee for his/her constructive comments. This work was supported by the Programme National ”Physico Chimie du Milieu Interstellaire” and by the European Research Training Network ”Molecular Universe” (MRTN-CT-2004-512302). M.C. thanks the CNRS (project CERC3) and Junta de Andalucia (project P07-FQM-03014) for financial support.References
- Bakri et al. (2002) Bakri, B., Demaison, J., Kleiner, I., et al. 2002, Journal of Molecular Spectroscopy, 215, 312
- Carvajal et al. (2007) Carvajal, M., Willaert, F., Demaison, J., & Kleiner, I. 2007, Journal of Molecular Spectroscopy, 246, 158
- Demaison et al. (1984) Demaison, J., Boucher, D., & Dubrulle, A. 1984, Journal of Molecular Spectroscopy, 102, 260
- Fuchs et al. (2005) Fuchs, G. W., Fuchs, U., Giesen, T. F., & Wyrowski, F. 2005, A&A, 444, 521
- Fukuyama et al. (1999) Fukuyama, Y., Omori, K., Odashima, H., Takagi, K., & Tsunekawa, S. 1999, Journal of Molecular Spectroscopy, 193, 72
- Gordy & Cook (1984) Gordy, W. & Cook, R. L. 1984, Microwave Molecular Spectra (New York: John Wiley & Sons)
- Groner et al. (2007) Groner, P., Winnewisser, M., Medvedev, I. R., et al. 2007, ApJS, 169, 28
- Hollis et al. (2006) Hollis, J. M., Lovas, F. J., Remijan, A. J., et al. 2006, ApJ, 643, L25
- Hougen et al. (1994) Hougen, J. T., Kleiner, I., & Godefroid, M. 1994, Journal of Molecular Spectroscopy, 163, 559
- Ikeda et al. (2001) Ikeda, M., Ohishi, M., Nummelin, A., et al. 2001, ApJ, 560, 792
- Ilyushin et al. (2006) Ilyushin, V., Alekseev, E., Demaison, J., & Kleiner, I. 2006, Journal of Molecular Spectroscopy, 240, 127
- Ilyushin et al. (2007) Ilyushin, V., Kleiner, I., & Lovas, F. J. 2007, Journal of Physical and Chemical Reference Data
- Kleiner et al. (1996) Kleiner, I., Lovas, F. J., & Godefroid, M. 1996, Journal of Physical and Chemical Reference Data, 25, 1113
- Kobayashi et al. (2007) Kobayashi, K., Ogata, K., Tsunekawa, S., & Takano, S. 2007, ApJ, 657, L17
- Liu et al. (2001) Liu, S.-Y., Mehringer, D. M., & Snyder, L. E. 2001, ApJ, 552, 654
- Mehringer et al. (2004) Mehringer, D. M., Pearson, J. C., Keene, J., & Phillips, T. G. 2004, ApJ, 608, 306
- Nummelin et al. (1998) Nummelin, A., Bergman, P., Hjalmarson, A., et al. 1998, ApJS, 117, 427
- Oesterling et al. (1999) Oesterling, L. C., Albert, S., De Lucia, F. C., Sastry, K. V. L. N., & Herbst, E. 1999, ApJ, 521, 255
- Ogata et al. (2004) Ogata, K., Odashima, H., Takagi, K., & Tsunekawa, S. 2004, Journal of Molecular Spectroscopy, 225, 14
- Plummer et al. (1984) Plummer, G. M., Herbst, E., De Lucia, F., & Blake, G. A. 1984, ApJS, 55, 633
- Plummer et al. (1986) Plummer, G. M., Herbst, E., De Lucia, F. C., & Blake, G. A. 1986, ApJS, 60, 949
- Pottage et al. (2004) Pottage, J. T., Flower, D. R., & Davis, S. L. 2004, MNRAS, 352, 39
- Remijan et al. (2002) Remijan, A., Snyder, L. E., Liu, S.-Y., Mehringer, D., & Kuan, Y.-J. 2002, ApJ, 576, 264
- Remijan et al. (2004) Remijan, A., Sutton, E. C., Snyder, L. E., et al. 2004, ApJ, 606, 917
- Snyder et al. (2005) Snyder, L. E., Lovas, F. J., Hollis, J. M., et al. 2005, ApJ, 619, 914
- Sollins et al. (2004) Sollins, P. K., Zhang, Q., & Ho, P. T. P. 2004, ApJ, 606, 943
- Turner (1991) Turner, B. E. 1991, ApJS, 76, 617
- Zhang et al. (1998) Zhang, Q., Ho, P. T. P., & Ohashi, N. 1998, ApJ, 494, 636
| J’ | Ka’ | Kc’ | P’ | J” | Ka” | Kc” | P” | Obs. Freq | Calc.Freq | Calc.Unc | Obs-Calc | S | |
|---|---|---|---|---|---|---|---|---|---|---|---|---|---|
| Upper Statea | Lower Statea | (MHz)b | (MHz)c | (kHz)c | (MHz)c | (D2) | (cm-1)d | ||||||
| 7 | 4 | 4 | - | 6 | 4 | 3 | - | 85327.104 | 85327.085 | 11 | 0.019 | 12.483 | 146.8606 |
| 7 | 4 | 3 | + | 6 | 4 | 2 | + | 85360.669 | 85360.823 | 11 | -0.154 | 12.483 | 146.8610 |
| 7 | 3 | 5 | + | 6 | 3 | 4 | + | 85371.762 | 85371.789 | 11 | -0.027 | 15.120 | 143.6253 |
| 7 | -6 | 2 | 6 | -6 | 1 | 85456.630 | 19 | 4.944 | 155.5393 | ||||
| 7 | 4 | 3 | 6 | 4 | 2 | 85506.175 | 85506.179 | 16 | -0.004 | 12.571 | 146.6097 | ||
| 7 | -5 | 3 | 6 | -5 | 2 | 85553.365 | 85553.288 | 17 | 0.077 | 9.123 | 150.4139 | ||
| 10 | 2 | 9 | - | 10 | 1 | 10 | + | 85664.038 | 85663.943 | 20 | 0.095 | 1.403 | 151.8343 |
| 11 | 4 | 7 | + | 11 | 3 | 8 | - | 85727.753 | 85727.728 | 18 | 0.025 | 3.078 | 162.4132 |
| 7 | -4 | 4 | 6 | -4 | 3 | 85743.967 | 85743.894 | 16 | 0.073 | 12.532 | 146.2356 | ||
| 7 | 2 | 5 | + | 6 | 2 | 4 | + | 88998.368 | 88998.415 | 12 | -0.047 | 17.049 | 141.4958 |
| 7 | 2 | 5 | 6 | 2 | 4 | 89140.383 | 89140.366 | 18 | 0.017 | 17.051 | 141.0232 | ||
| 25 | 5 | 20 | - | 25 | 4 | 21 | + | 107021.644 | 361 | 8.289 | 274.8357 | ||
| 9 | -2 | 8 | 8 | -2 | 7 | 107022.162 | 107022.092 | 13 | 0.070 | 22.628 | 146.6924 | ||
| 10 | 1 | 9 | - | 9 | 2 | 8 | - | 107472.351 | 107472.387 | 15 | -0.036 | 2.144 | 150.7587 |
| 9 | -3 | 7 | 8 | -3 | 6 | 111005.617 | 111005.582 | 19 | 0.035 | 20.800 | 149.1777 | ||
| 9 | 1 | 8 | 8 | 1 | 7 | 111094.105 | 111094.056 | 13 | 0.049 | 23.222 | 146.0900 | ||
| 12 | 0 | 12 | + | 11 | 0 | 11 | + | 131536.624 | 131536.653 | 12 | -0.029 | 31.375 | 155.8502 |
| 12 | 0 | 12 | 11 | 0 | 11 | 131612.344 | 131612.301 | 13 | 0.043 | 31.558 | 155.3072 | ||
| 12 | 1 | 12 | + | 11 | 0 | 11 | + | 131764.316 | 131764.341 | 12 | -0.025 | 4.870 | 155.8502 |
| 11 | 5 | 7 | + | 10 | 5 | 6 | + | 134531.846 | 134531.833 | 13 | 0.013 | 23.125 | 164.8530 |
| 27 | 7 | 20 | - | 27 | 6 | 21 | + | 134545.609 | 582 | 8.581 | 304.5077 | ||
| 11 | -7 | 5 | 10 | -7 | 4 | 134545.615 | 134545.516 | 27 | 0.099 | 17.431 | 175.4588 | ||
| 35 | 8 | 27 | + | 35 | 7 | 28 | - | 134553.290 | 912 | 12.622 | 416.6235 | ||
| 11 | 5 | 6 | - | 10 | 5 | 5 | - | 134585.070 | 134585.141 | 13 | -0.071 | 23.125 | 164.8541 |
| 11 | -3 | 9 | 10 | -3 | 8 | 134713.629 | 134713.526 | 16 | 0.103 | 26.708 | 156.9827 | ||
| 11 | 5 | 6 | 10 | 5 | 5 | 134739.630 | 134739.629 | 19 | 0.001 | 23.251 | 164.7142 | ||
| 12 | 2 | 11 | - | 11 | 2 | 10 | - | 140020.525 | 140020.564 | 12 | -0.039 | 30.616 | 158.9957 |
| 11 | 2 | 9 | + | 10 | 2 | 8 | + | 140166.667 | 140166.713 | 12 | -0.046 | 28.103 | 155.9781 |
| 12 | -2 | 11 | 11 | -2 | 10 | 140324.728 | 140324.699 | 12 | 0.029 | 30.787 | 158.5211 | ||
| 13 | -1 | 13 | 12 | -1 | 12 | 142032.334 | 142032.293 | 14 | 0.041 | 34.222 | 159.7047 | ||
| 13 | 0 | 13 | + | 12 | 0 | 12 | + | 142052.800 | 142052.735 | 14 | 0.065 | 34.029 | 160.2378 |
| 13 | 0 | 13 | 12 | 0 | 12 | 142125.416 | 142125.410 | 14 | 0.006 | 34.224 | 159.6973 | ||
| 13 | 1 | 13 | + | 12 | 0 | 12 | + | 142185.220 | 142185.198 | 14 | 0.022 | 5.339 | 160.2378 |
| 15 | 0 | 15 | + | 14 | 1 | 14 | + | 163042.398 | 163042.248 | 20 | 0.100 | 6.267 | 170.0683 |
| 15 | 1 | 15 | + | 14 | 1 | 14 | + | 163086.032 | 163085.873 | 20 | 0.159 | 39.344 | 170.0683 |
| 15 | 0 | 15 | 14 | -1 | 14 | 163113.094 | 163113.156 | 18 | -0.062 | 6.073 | 169.5325 | ||
| 15 | 0 | 15 | + | 14 | 0 | 14 | + | 163118.722 | 163118.574 | 20 | 0.148 | 39.345 | 170.0657 |
| 14 | 1 | 13 | 13 | 1 | 12 | 163142.587 | 163142.607 | 14 | -0.020 | 36.185 | 168.1362 | ||
| 15 | -1 | 15 | 14 | -1 | 14 | 163154.325 | 163154.404 | 18 | -0.079 | 39.561 | 169.5325 | ||
| 15 | 0 | 15 | 14 | 0 | 14 | 163185.864 | 163185.922 | 18 | -0.058 | 39.561 | 169.5300 | ||
| 15 | -1 | 15 | 14 | 0 | 14 | 163227.097 | 163227.169 | 18 | -0.072 | 6.074 | 169.5300 | ||
| 16 | 0 | 16 | + | 15 | 1 | 15 | + | 173616.616 | 173616.407 | 25 | 0.209 | 6.727 | 175.5082 |
| 16 | 1 | 16 | + | 15 | 1 | 15 | + | 173641.411 | 173641.171 | 25 | 0.240 | 42.007 | 175.5082 |
| 16 | 0 | 16 | + | 15 | 0 | 15 | + | 173660.281 | 173660.032 | 25 | 0.249 | 42.007 | 175.5068 |
| 16 | 0 | 16 | 15 | -1 | 15 | 173683.479 | 173683.597 | 23 | -0.118 | 6.525 | 174.9747 | ||
| 24 | 3 | 21 | - | 24 | 2 | 22 | + | 173704.470 | 241 | 4.324 | 254.0651 | ||
| 16 | -1 | 16 | 15 | -1 | 15 | 173706.683 | 173706.807 | 23 | -0.124 | 42.232 | 174.9747 | ||
| 16 | 0 | 16 | 15 | 0 | 15 | 173724.731 | 173724.845 | 23 | -0.114 | 42.232 | 174.9733 | ||
| 16 | -1 | 16 | 15 | 0 | 15 | 173747.990 | 173748.055 | 23 | -0.065 | 6.525 | 174.9733 | ||
| 16 | 5 | 11 | 15 | 5 | 10 | 198384.885 | 198384.966 | 32 | -0.081 | 38.205 | 191.3885 | ||
| 26 | 8 | 19 | - | 26 | 7 | 20 | + | 198429.332 | 290 | 6.921 | 297.4256 | ||
| 16 | 5 | 11 | - | 15 | 5 | 10 | - | 198539.350 | 30 | 38.279 | 191.5148 | ||
| 16 | -5 | 12 | 15 | -5 | 11 | 198578.563 | 198578.589 | 33 | -0.026 | 38.090 | 191.0593 | ||
| 19 | 3 | 16 | - | 18 | 4 | 15 | - | 207295.959 | 118 | 2.804 | 208.1331 | ||
| 17 | 12 | 5 | + | 16 | 12 | 4 | + | 207354.058 | 101 | 12.640 | 252.9573 | ||
| 17 | 12 | 6 | - | 16 | 12 | 5 | - | 207354.058 | 101 | 12.640 | 252.9573 | ||
| 17 | -13 | 5 | 16 | -13 | 4 | 207376.777 | 145 | 18.783 | 264.5661 | ||||
| 17 | 9 | 8 | 16 | 9 | 7 | 207397.312 | 68 | 32.511 | 223.9160 | ||||
| 17 | 11 | 7 | + | 16 | 11 | 6 | + | 207404.993 | 81 | 26.248 | 242.2767 | ||
| 17 | 11 | 6 | - | 16 | 11 | 5 | - | 207404.993 | 81 | 26.248 | 242.2767 | ||
| 17 | 10 | 8 | - | 16 | 10 | 7 | - | 207500.297 | 66 | 29.526 | 232.5324 | ||
| 17 | 10 | 7 | + | 16 | 10 | 6 | + | 207500.297 | 66 | 29.526 | 232.5324 | ||
| 19 | 2 | 18 | - | 18 | 1 | 17 | - | 215130.469 | 47 | 6.562 | 199.2115 | ||
| 18 | 5 | 13 | - | 17 | 5 | 12 | - | 225648.010 | 57 | 44.072 | 205.2072 | ||
| 19 | 2 | 17 | + | 18 | 2 | 16 | + | 225702.569 | 46 | 48.659 | 203.7419 | ||
| 6 | 6 | 1 | - | 5 | 5 | 0 | - | 225727.540 | 30 | 2.592 | 148.5921 | ||
| 6 | 6 | 0 | + | 5 | 5 | 1 | + | 225727.552 | 30 | 2.592 | 148.5921 | ||
| 18 | 5 | 13 | 17 | 5 | 12 | 225756.154 | 54 | 43.428 | 205.0713 | ||||
| 7 | 6 | 1 | + | 6 | 5 | 2 | + | 237899.077 | 27 | 2.594 | 151.0254 | ||
| 20 | 3 | 18 | + | 19 | 2 | 17 | + | 237969.273 | 58 | 5.371 | 211.2706 | ||
| 37 | 7 | 31 | + | 37 | 6 | 32 | - | 238027.934 | 1642 | 8.537 | 434.5487 | ||
| 20 | -14 | 7 | 19 | -14 | 6 | 244000.464 | 195 | 27.134 | 299.1664 | ||||
| 20 | 15 | 5 | - | 19 | 15 | 4 | - | 244048.806 | 207 | 23.017 | 312.5791 | ||
| 20 | 15 | 6 | + | 19 | 15 | 5 | + | 244048.806 | 207 | 23.017 | 312.5791 | ||
| 19 | 4 | 15 | + | 18 | 4 | 14 | + | 244066.113 | 79 | 48.355 | 209.5678 | ||
| 27 | 1 | 26 | - | 27 | 0 | 27 | + | 244066.575 | 470 | 1.456 | 268.2307 | ||
| 20 | 14 | 6 | + | 19 | 14 | 5 | + | 244073.956 | 178 | 20.522 | 299.0954 | ||
| 20 | 14 | 7 | - | 19 | 14 | 6 | - | 244073.956 | 178 | 20.522 | 299.0954 | ||
| 20 | 10 | 10 | 19 | 10 | 9 | 244112.669 | 108 | 39.852 | 254.7516 | ||||
| 20 | 13 | 7 | - | 19 | 13 | 6 | - | 244119.960 | 154 | 24.670 | 286.5471 | ||
| 20 | 13 | 8 | + | 19 | 13 | 7 | + | 244119.960 | 154 | 24.670 | 286.5471 | ||
| 20 | 12 | 8 | + | 19 | 12 | 7 | + | 244198.512 | 134 | 34.020 | 274.9352 | ||
| 20 | 12 | 9 | - | 19 | 12 | 8 | - | 244198.512 | 134 | 34.020 | 274.9352 | ||
| 20 | -13 | 8 | 19 | -13 | 7 | 244207.619 | 159 | 30.739 | 286.5459 | ||||
aUpper and lower state transitions quantum numbers. The rotational quantum number J, and the asymmetric rotor labels Ka and Kc are identified for each energy level. For the A symmetry species, P is the parity quantum number, for the E species, P is not defined, instead, the Ka label has a signed value (Hougen et al. 1994; Ilyushin et al. 2007). Note that this information has been suppressed in Table LABEL:mtfvt1, otherwise the quantum number labeling is the same.
bObserved laboratory frequencies in MHz from Ogata et al. (2004), the experimental uncertainty is 50 kHz for all measured lines.
cCalculated frequencies, uncertainties and obs-calc values are from (Carvajal et al. 2007) for the measured lines, the predicted frequencies and uncertainties for unmeasured lines is from Kleiner et al. (private communication).
dLower state energy in cm-1, relative to the J=K=0 A species levels, set as zero energy.
| Transitiona | S | Frequency | Obs. frequencyb | vc | Tmb | Commentd | ||
|---|---|---|---|---|---|---|---|---|
| (D2) | (cm-1) | (MHz) | (MHz) | (K.km.s-1) | (mK) | |||
| 1(8) | 7(4,4) - 6(4,3) A | 12.5 | 146.86 | 85327.104 | 85326.864 | 1.22 | 87 | |
| 2(5) | 7(4,3) - 6(4,2) A | 12.5 | 146.86 | 85360.669 | 85359.685 | 0.40 | 81 | |
| 3 | 7(3,5) - 6(3,4) A | 15.1 | 143.62 | 85371.762 | 85371.871 | 0.67 | 102 | |
| 4 | 7(6,2) - 6(6,1) E | 4.94 | 155.53 | 85456.630 | 85456.067 | 14.33 | 1133 | CH3CCH |
| 5(2) | 7(4,3) - 6(4,2) E | 12.6 | 146.60 | 85506.175 | 85506.053 | 0.57 | 84 | |
| 6 | 7(5,3) - 6(5,2) E | 9.12 | 150.40 | 85553.365 | 85553.361 | 0.54 | 78 | |
| 7 | 10(2,9) - 10(1,10) A | 1.40 | 151.83 | 85664.038 | 85664.621 | 1.06 | 61 | C2H3CN |
| 8(1) | 7(4,4) - 6(4,3) E | 12.5 | 146.22 | 85743.967 | 85743.915 | 0.79 | 102 | |
| 9(10) | 7(2,5) - 6(2,4) A | 17.0 | 141.50 | 88998.368 | 88997.692 | 0.77 | 83 | |
| 10(9) | 7(2,5) - 6(2,4) E | 17.1 | 141.01 | 89140.383 | 89140.161 | 1.20 | 120 | |
| 11 | 25(5,20) - 25(4,21) A | 8.29 | 274.84 | 107021.644 | 107021.862 | 1.99 | 186 | |
| 12 | 9(2,8) - 8(2,7) E | 22.6 | 146.68 | 107022.162 | - | - | - | |
| 13 | 10(1,9) - 9(2,8) A | 2.14 | 150.76 | 107472.351 | 107472.400 | 0.27 | 45 | |
| 14 | 9(3,7) - 8(3,6) E | 20.8 | 149.16 | 111005.617 | 111005.832 | 2.67 | 261 | |
| 15 | 9(1,8) - 8(1,7) E | 23.2 | 146.08 | 111094.105 | 111094.010 | 2.27 | 244 | |
| 16(17) | 12(0,12) - 11(0,11) A | 31.4 | 155.85 | 131536.624 | 131536.949 | 3.53 | 407 | |
| 17(16) | 12(0,12) - 11(0,11) E | 31.6 | 155.29 | 131612.344 | 131612.094 | 3.97 | 410 | |
| 18 | 12(1,12) - 11(0,11) A | 4.87 | 155.85 | 131764.316 | 131765.100 | 1.70 | 100 | S18O |
| 19 | 11(5,7) - 10(5,6) A | 23.1 | 164.85 | 134531.846 | 134531.411 | 3.44 | 478 | SO2 =1 |
| 20 | 27(7,20) - 27(6,21) A | 8.58 | 304.51 | 134545.609 | 134546.431 | 7.95 | 630 | C3H2CN + 33SO2 |
| 21 | 11(7,5) - 10(7,4) E | 17.4 | 175.45 | 134545.615 | - | - | - | - |
| 22 | 35(8,27) - 35(7,28) A | 12.6 | 416.62 | 134553.290 | 134553.647 | 0.71 | 991 | 33SO2 |
| 23(25) | 11(5,6), - 10(5,5) A | 23.1 | 164.85 | 134585.070 | 134584.263 | 4.68 | 382 | C3H2CN,=1 and ? |
| 24 | 11(3,9) - 10(3,8) E | 26.7 | 156.97 | 134713.629 | 134713.062 | 3.59 | 456 | |
| 25(23) | 11(5,6) - 10(5,5) E | 23.3 | 164.70 | 134739.630 | 134739.110 | 3.55 | 386 | |
| 26(28) | 12(2,11) - 11(2,10) A | 30.6 | 159.00 | 140020.525 | 140020.145 | 2.96 | 472 | |
| 27 | 11(2,9) - 10(2,8) A | 28.1 | 155.98 | 140166.667 | 140166.502 | 3.42 | 528 | |
| 28(26) | 12(2,11) - 11(2,10) E | 30.8 | 158.50 | 140324.728 | 140324.321 | 7.66 | 470 | |
| 29 | 13(1,13) - 12(1,12) E | 34.2 | 159.69 | 142032.334 | 142031.811 | 4.52 | 586 | |
| 30(31) | 13(0,13) - 12(0,12) A | 34.0 | 160.24 | 142052.800 | 142052.867 | 5.95 | 724 | |
| 31(30) | 13(0,13) - 12(0,12) E | 34.2 | 159.68 | 142125.416 | 142125.086 | 4.01 | 559 | |
| 32 | 13(1,13) - 12(0,12) A | 5.34 | 160.24 | 142185.220 | 142184.202 | 0.81 | 121 | |
| 33(35) | 15(0,15) - 14(1,14) A | 6.27 | 170.07 | 163042.398 | 163042.050 | 2.32 | 363 | |
| 34(38) | 15(1,15) - 14(1,14) A | 39.3 | 170.07 | 163086.032 | 163085.494 | 6.39 | 884 | HCOOCH3 =0 |
| 35(33) | 15(0,15) - 14(1,14) E | 6.07 | 169.52 | 163113.094 | 163113.656 | 5.11 | 549 | SO2 |
| 36(39) | 15(0,15) - 14(0,14) A | 39.3 | 169.52 | 163118.722 | 163118.285 | 19.40 | 2184 | SO2 |
| 37 | 14(1,13) - 13(1,12) E | 36.2 | 168.12 | 163142.587 | 163141.991 | 7.69 | 967 | |
| 38(34) | 15(1,15) - 14(1,14) E | 39.6 | 162.52 | 163154.325 | 163153.604 | 8.99 | 855 | |
| 39(36) | 15(0,15) - 14(0,14) E | 39.6 | 169.52 | 163185.864 | 163185.586 | 5.15 | 679 | |
| 40 | 15(1,15) - 14(0,14) E | 6.07 | 169.52 | 163227.097 | 163227.290 | 4.23 | 448 | |
| 41(44) | 16(0,16) - 15(1,15) A | 6.73 | 175.51 | 173616.616 | 173617.000 | 1.80 | 177 | |
| 42(46) | 16(1,16) - 15(1,15) A | 42.0 | 175.51 | 173641.411 | 173636.978 | 15.14 | 1288 | HCOOCH3 =0 |
| 43(47) | 16(0,16) - 15(0,15) A | 42.0 | 175.51 | 173660.281 | 173659.384 | 4.12 | 380 | |
| 44(41) | 16(0,16) - 15(1,15) E | 6.50 | 175.51 | 173683.479 | 173186.987 | 17.8 | 5300 | CH3CHO |
| 45 | 24(3,21) - 24(2,22) A | 4.32 | 254.06 | 173704.470 | 173706.183 | 9.03 | 644 | |
| 46(42) | 16(1,16) - 15(1,15) E | 42.2 | 174.96 | 173706.683 | 173706.183 | - | - | |
| 47(43) | 16(0,16) - 15(0,15) E | 42.2 | 174.97 | 173724.731 | 173724.558 | 2.02 | 479 | |
| 48 | 16(1,16) - 15(0,15) E | 6.6 | 174.97 | 173747.990 | 173748.150 | 3.94 | 264 | |
| 49(51) | 16(5,11) - 15(5,10) E | 38.2 | 191.37 | 198384.885 | 198384.516 | 5.23 | 467 | |
| 50 | 26(8,19) - 26(7,20) A | 6.92 | 297.43 | 198429.332 | 198428.202 | 1.67 | 231 | c-C2H4 |
| 51(49) | 16(5,11) - 15(5,10) A | 38.3 | 191.52 | 198539.350 | 198541.500 | 19.44 | 1400 | HCOOCH3 =0 |
| 52 | 16(5,12) - 15(5,11) E | 38.1 | 191.05 | 198578.563 | 198577.928 | 3.20 | 484 | |
| 53 | 19(3,16) - 18(4,15) A | 2.8 | 208.13 | 207295.959 | 207296.361 | 5.16 | 159 | CH3CH2CN |
| 54 | 17(12,5) - 16(12,4) A | 21.2 | 252.96 | 207354.058 | 207352.197 | 5.57 | 557 | |
| 55 | 17(12,6) - 16(12,5) A | 21.2 | 252.96 | - | - | - | - | |
| 56 | 17(13,5) - 16(13,4) E | 18.8 | 264.55 | 207376.777 | 207378.506 | 11.46 | 995 | CH2NH |
| 57 | 17(9,8) - 16(9,7) E | 32.5 | 223.90 | 207397.312 | 207396.134 | 8.62 | 758 | |
| 58 | 17(11,6) - 16(11,5) A | 26.2 | 242.28 | 207404.993 | 207404.612 | 5.67 | 690 | |
| 59 | 17(11,7) - 16(11,6) A | 26.2 | 242.28 | - | - | - | - | |
| 60 | 17(10,8) - 16(10,7) A | 29.5 | 232.53 | 207500.297 | 207499.521 | 4.8 | 897 | |
| 61 | 17(10,7) - 16(10,6) A | 29.5 | 232.53 | - | - | - | - | |
| 62 | 19(2,18) - 18(1,17) A | 6.56 | 199.21 | 215130.469 | 215130.828 | 2.59 | 394 | CH3CH2CN |
| 63(67) | 18(5,13) - 17(5,12) A | 44.1 | 205.21 | 225648.010 | 225647.974 | 5.16 | 1103 | HCOOCH3 =0 |
| 64 | 19(2,17) - 18(2,16) A | 48.7 | 203.74 | 225702.569 | 225698.559 | 184 | 1400 | H2CO |
| 65 | 6(6,1) - 5(5,0) A | 2.59 | 148.59 | 225727.540 | 225726.732 | 2.55 | 372 | CH2DCN |
| 66 | 6(6,0) - 5(5,1) A | 2.59 | 148.59 | 225727.552 | - | - | - | - |
| 67(63) | 18(5,13) - 17(5,12) E | 43.4 | 205.06 | 225756.154 | 225755.178 | 7.3 | 927 | |
| 68 | 7(6,1) - 6(5,2) A | 25.6 | 229.84 | 237899.08 | 237896.263 | 15.91 | 1.667 | NH2CHO |
| 69 | 20(3,18) - 19(2,17) A | 5.37 | 211.27 | 237969.273 | 237969.938 | 12.80 | 1.186 | unidentified species |
| 70 | 37(7,31) - 37(6,32) A | 8.54 | 434.55 | 238027.934 | 238026.742 | 1.12 | 122 | |
| 71 | 20(14,7) - 19(14,6) E | 27.1 | 299.15 | 244000.464 | 243999.803 | 7.82 | 596 | |
| 72 | 20(15,6) - 19(15,5) A | 23.3 | 312.58 | 244048.806 | 244048.230 | 90.33 | 10.84 | H2CS |
| 73 | 20(15,5) - 19(15,4) A | 23.3 | 312.58 | - | - | - | - | - |
| 74 | 19(4,15) - 18(4,14) A | 18.4 | 209.57 | 244066.113 | 244066.720 | 5.49 | 730 | |
| 75 | 20(14,7) - 19(14,6) A | 14.2 | 299.10 | 244073.956 | 244073.440 | 3.54 | 314 | unidentified species |
| 76 | 20(14,6) - 19(14,5) A | 14.2 | 299.10 | - | - | - | - | |
| 77 | 20(10,10) - 19(10,9) E | 39.9 | 254.74 | 244112.669 | 244112.254 | 2.65 | 677 | |
| 78(82) | 20(13,8) - 19(13,7) A | 21.0 | 286.55 | 244119.960 | 244119.708 | 2.95 | 886 | |
| 79 | 20(13,7) - 19(13,6) A | 21.0 | 286.55 | - | - | - | - | |
| 80 | 20(12,8) - 19(12,7) A | 34.0 | 274.94 | 244198.512 | 244198.232 | 7.43 | 1107 | |
| 81 | 20(12,9) - 19(12,8) A | 34.0 | 274.94 | - | - | - | - | |
| 82(78) | 20(13,8) - 19(13,7) E | 30.7 | 286.54 | 244207.619 | 244206.113 | 7.33 | 893 | unidentified species |
aThe notation for the quantum numbers is the same as Table LABEL:mtfvt1lab except that it does not contain information on the parity of the level, i.e. the signs present in Table LABEL:mtfvt1lab (associated to for the E species and in a separate column for the A species) have been suppressed.
bObserved frequencies for a systemic velocity of Vlsr = 55.3 km.s-1.
cThe line width is of the order of 7-8 km.s-1.
dThis column indicates the molecules blended with the detected HCOOCH3 =1 transitions.
The dashes indicates that the value is the same as the one in the previous line.
| Transition | State | S | Frequency | Obs. frequencya | vb | Tmb | Comment | |
|---|---|---|---|---|---|---|---|---|
| (D2) | (cm-1) | (MHz) | (MHz) | (K.km.s-1) | (mK) | |||
| 116.0 | 281.68 | 98463.46 | 98462.15 | 0.82 | 62 | |||
| - | - | 98464.02 | - | - | - | |||
| - | - | 98464.27 | - | - | - | |||
| - | - | 98464.32 | - | - | - | |||
| 79.2 | 295.40 | 98538.53 | 98537.9 | (c) | 15 | CH3CH2CN | ||
| - | - | 98538.84 | - | - | - | - | ||
| - | - | 98539.10 | - | - | - | - | ||
| - | - | 98539.11 | - | - | - | - | ||
| 156.3 | 258.45 | 98556.61 | 98557.5 | (c) | 50 | (c) | ||
| - | - | 98556.88 | - | - | - | - | ||
| - | - | 98557.12 | - | - | - | - | ||
| - | - | 98557.27 | - | - | - | - | ||
| 188.1 | 248.92 | 98617.87 | 98619.1 | 2.2 | 105 | (d) | ||
| - | - | 98617.91 | - | - | - | - | ||
| - | - | 98618.09 | - | - | - | - | ||
| - | - | 98618.19 | - | - | - | - | ||
| 237.0 | 242.51 | 98619.45 | - | - | - | - | ||
| 199.0 | 249.94 | 98620.23 | - | - | - | - | ||
| - | - | 98620.33 | - | - | - | - | ||
| 237.0 | 242.51 | 98620.38 | - | - | - | - | ||
| 212.8 | 249.94 | 98620.41 | - | - | - | - | ||
| 237.0 | 242.51 | 98620.80 | - | - | - | - | ||
| - | - | 98620.82 | - | - | - | - | ||
| 212.8 | 249.94 | 98621.02 | - | - | - | - | ||
| 240.4 | 234.40 | 98735.64 | 98736.0 | 0.38 | 31 | |||
| 233.2 | - | 98735.77 | - | - | - | |||
| - | 234.40 | 98738.68 | 98738.8 | 0.57 | 75 | |||
| 240.4 | - | 98739.06 | - | - | - | |||
| 297.2 | 229.03 | 107088.63 | 107088.5 | 0.52 | 50 | C2H5OH ? | ||
| - | 229.03 | 107088.81 | - | - | - | - | ||
| 294.5 | 235.76 | 107101.61 | 107101.2 | 0.34 | 37 | |||
| - | 235.76 | 107102.25 | - | - | - | |||
| 165.6 | 272.74 | 107251.81 | 107252.3 | 0.53 | 40 | |||
| - | - | 107252.50 | - | - | - | |||
| - | - | 107252.56 | - | - | - | |||
| - | - | 107252.93 | - | - | - | |||
| 148.1 | 284.97 | 107420.75 | 107420.9 | 0.80 | 40 | (d) | ||
| - | - | 107421.34 | - | - | - | - | ||
| - | - | 107421.59 | - | - | - | - | ||
| - | - | 107421.66 | - | - | - | - | ||
| 333.4 | 257.47 | 134571.52 | 134571.2 | (c) | 10 | (c) | ||
| 329.8 | 257.47 | 134576.01 | - | - | - | - | ||
| 349.5 | 251.67 | 134589.47 | 134590.2 | 0.46 | 60 | HCOOCH | ||
| - | - | 134590.45 | - | - | - | - | ||
| 318.4 | 255.87 | 134616.20 | 134616.1 | 3.23 | 135 | (d) | ||
| - | - | 134616.38 | - | - | - | - | ||
| 297.7 | 255.87 | 134616.44 | - | - | - | - | ||
| - | - | 134616.58 | - | - | - | - | ||
| 140.1 | 326.77 | 134640.95 | 134640.4 | 1.93 | 257 | |||
| - | - | 134641.10 | - | - | - | |||
| - | - | 134641.11 | - | - | - | |||
| - | - | 134641.12 | - | - | - | |||
| 104.7 | 343.90 | 134648.79 | 134648.1 | 2.37 | 132 | (d) | ||
| - | - | 134648.90 | - | - | - | - | ||
| - | - | 134648.98 | - | - | - | - | ||
| - | - | 134649.00 | - | - | - | - | ||
| 175.0 | 311.15 | 134650.29 | - | - | - | - | ||
| - | - | 134650.34 | - | - | - | - | ||
| - | - | 134650.34 | - | - | - | - | ||
| - | - | 134650.49 | - | - | - | - | ||
| 69.2 | 362.56 | 134666.30 | 131667.6 | (c) | 10 | (c) | ||
| - | - | 134666.33 | - | - | - | - | ||
| - | - | 134666.49 | - | - | - | - | ||
| - | - | 134666.50 | - | - | - | - | ||
| 209.4 | 297.07 | 134703.14 | 134702.7 | 0.98 | 103 | |||
| - | - | 134703.26 | - | - | - | |||
| - | - | 134703.45 | - | - | - | |||
| - | - | 134703.54 | - | - | - | |||
| 514.8 | 280.29 | 198463.40 | 198465.5 | 4.17 | 348 | unidentified species | ||
| - | - | 198463.42 | - | - | - | - | ||
| 485.2 | 293.79 | 207396.15 | 207397.5 | 8.58 | 758 | HCOOCH | ||
| - | 293.79 | 207396.27 | - | - | - | - | ||
| 502.5 | 290.47 | 207415.76 | 207240.2 | 6.69 | 568 | HCOOCH | ||
| - | 290.47 | 207417.59 | - | - | - | - | ||
| 188.2 | 293.36 | 207446.75 | 207446.0 | (c) | 15 | C2H5OH | ||
| 186.9 | 293.36 | 207447.53 | - | - | - | - | ||
| 325.5 | 393.52 | 215133.09 | 215132.5 | (c) | 380 | unknown species | ||
| - | - | 215133.41 | - | - | - | - | ||
| - | - | 215134.13 | - | - | - | - | ||
| - | - | 215134.19 | - | - | - | - | ||
| 511.8 | 307.94 | 225715.53 | 225714.7 | (c) | 228 | (c) | ||
| - | - | 225715.61 | - | |||||
| 534.4 | 323.30 | 244142.10 | 244139.3 | 3.94 | 288 | |||
| - | - | 244142.13 | - | - | - | |||
| 539.3 | 327.94 | 250318.38 | 250316.2 | 2.7 | 298 | |||
| 269.5 | 327.94 | 250319.81 | - | - | - | |||
| - | - | 250319.81 | - | - | - | |||
| 273.8 | 486.17 | 251372.86 | 251373.7 | (c) | 10 | (c) | ||
| - | - | 251373.06 | - | - | - | - | ||
| - | - | 251373.29 | - | - | - | - | ||
| - | - | 251373.32 | - | - | - | - |
aObserved frequencies for a systemic velocity of Vlsr = 57 km/s.
bThe line width is of the order of 7-8 km.s-1.
cLine within the noise, a gaussian fit could not be made, constrains the abundance of excited ethyl cyanide.
dVery broad lines, (v 15), due to the blending of several excited ethyl cyanide transitions and/or to the blending with an unknown species.
The dashes indicates that the value is the same as the one in the previous line.