Attractive and repulsive cracks in a heterogeneous material
Résumé
We study experimentally the paths of an assembly of cracks growing in interaction in a heterogeneous two-dimensional elastic brittle material submitted to uniaxial stress. For a given initial crack assembly geometry, we observe two types of crack path. The first one corresponds to a repulsion followed by an attraction on one end of the crack and a tip to tip attraction on the other end. The second one corresponds to a pure attraction. Only one of the crack path type is observed in a given sample. Thus, selection between the two types appears as a statistical collective process.
Keywords: Crack interactions, Crack paths, Pattern, Fracture mechanics, Heterogeneous materials
1 Introduction
Understanding the rupture mechanisms of solids has become an important goal of fracture physics in order to improve the strength of structures and avoid catastrophic failures. Characterization of rupture properties very often involve the growth of a dominant crack. For instance, there is an extensive literature, both experimental and theoretical, discussing the slow growth dynamics of a single crack along a straight path in brittle [1, 2, 3, 4, 5, 6, 7] or visco-plastic materials [8, 9, 10, 11, 12, 13, 14, 15]. However, in many practical situations, the crack path is not straight. For one thing, the crack path can be slightly destabilized and develop some roughness due to dynamical instabilities [16] or material heterogeneities. This kind of path instability has motivated a large amount of experimental works analyzing the roughness of cracks [17, 18, 19, 20, 21, 22, 23] as well as several models describing roughening mechanisms [24, 25, 26] and non-trivial effects of heterogeneities on the rate of crack growth [27, 28, 29]. Much larger deviations of the crack path from a straight line can be observed during the growth of an array of interacting cracks. Comparatively to the case of roughness, this rather complex situation has been studied essentially theoretically [30, 31, 32, 33, 34, 35, 36] and very little experimentally [37, 38, 39] despite its practical importance especially for heterogeneous materials where multiple cracks are likely to form. Understanding the growth of interacting cracks is also a relevant issue for fault dynamics [40] as well as crack pattern formation during drying processes [41, 42, 43, 44].
There are several levels of complexity that can play a role in the growth of interacting cracks. First, depending on the geometry of the crack array and the loading, the stress field around a crack will be amplified or shielded because of the existence of other cracks. Then, in , the effective contribution of the loading on each crack will usually be a mixture of mode I and mode II 111The mode I corresponds to a tensile stress normal to the plane of the crack as the mode II corresponds to a shear stress acting parallel to the plane of the crack and perpendicular to the crack front.. It has been argued that crack deviations occur when the shear stress on the crack lips (mode II) is non-zero and that the crack will grow so as to minimize the mode II contribution and maximize the mode I contribution [45, 46, 47]. A noticeable observation related to this property is the preferential merging of cracks joining each other forming a right angle, commonly observed for crack patterns in drying experiments [42, 43, 44]. This occurs naturally because the principal stress along a crack lip is parallel to the crack direction so that a crack approaching the lip with a right angle is propagating mainly in mode I. On the other hand, when two collinear mode I cracks are growing towards each other, they do not merge tip to tip, but instead repel each other [37]. The origin of this effect has been discussed by several authors [30, 32] and numerical simulations have been able to reproduce, at least qualitatively, experimental observations [34]. However, there are not many experimental data to compare with these theoretical predictions, and furthermore, there is very little knowledge about the effect of material heterogeneities on the crack path selection.
In this paper, we study experimentally the trajectories of interacting cracks in an almost two dimensional brittle and heterogeneous material. The array of cracks has been initiated prior to the application of the external stress and the heterogeneity of the material (paper sheets) allows us to test the stability of crack paths to small perturbations. We uncover that for a given geometry of the crack array, a crack can follow statistically two stable trajectories : an attractive one and a repulsive one with respect to the neighboring cracks. The main result of this investigation is the analysis of the geometrical conditions for which cracks are attracted towards another and when they are repelled. The paper is organized as follows. In the next section, we describe the experimental apparatus. In section 3, the extraction procedure of the post-mortem shapes of the crack profiles is described. In sections 4, 5 and 6, we analyze the different types of crack paths and their statistics as a function of the initial crack pattern geometry. In section 7, we finally discuss the results and conclude.
2 The experiments
To study the growth of several interacting cracks, we have loaded bi-dimensional brittle samples made of fax paper sheets (Alrey®) with a tensile machine. The samples were previously prepared cutting several straight cracks in the paper sheets. In order to observe clearly the interaction between cracks during their growth, we had to find a geometry for which all crack tips are equivalent. Actually, we wanted to prevent the isolated growth at a particular crack tip that will inhibit the growth of the other cracks. One possible geometry that follows this condition consists in an array of cracks as presented in figure 1. The pattern formed by the two lines of cracks offers the advantage to have some translational invariance in the cracks direction. The stress is applied perpendicularly to the cracks direction and uniformly on the sample borders. Therefore, stress intensification is theoretically equivalent at each crack tip. In this geometry, there are three adjustable parameters: the crack length, the vertical spacing of cracks on a line and the horizontal spacing between the two lines. In this article, the first two parameters are fixed to 1cm and only the distance between the two lines of cracks has been varied.
\psfrag{S}{$\sigma$}\psfrag{d}[l][0.9]{$d$}\includegraphics[width=213.39566pt]{figure1.eps}
Each sample is prepared with the 11 initial cracks forming the array using a cutter blade. The experimental set-up consists of a tensile machine driven by a motor (Micro Controle UE42) controlled electronically to move step by step (Micro Controle ITL09). The paper sheets are mounted on the tensile machine with both ends attached with glue tape and rolled twice over rigid bars clamped on jaws. The motor controls the displacement of one jaw (400 steps per micrometer) while the other jaw is rigidly fixed to a force gage (Hydrotonics-TC). The tensile machine is placed in a box with a humidity level stabilized at and at room temperature. The samples are loaded by increasing the distance between the jaws on which they are clamped such that the resulting force (m is the film thickness and cm the sample height) is perpendicular to the initial cracks direction. The loading is enforced at a constant and very slow velocity (between m.s-1 and m.s-1) until the final breakdown of the sample. More details about the experimental set-up can be found in [7]. Actually, once the force threshold of the sample is overcome, we observe a quasi-instantaneous rupture of the sample with a quasi-simultaneous growth of all the cracks. There is no visual evidence of any sub-critical crack growth process before the final breakdown of the sample. During this breakdown, the applied force drops. When it reaches about half its maximum value, we stop loading the sample before breaking it in two pieces. It is a convenient procedure that allows us afterwards to image properly the crack path configurations in each sample.
3 Post-mortem analysis of crack trajectories
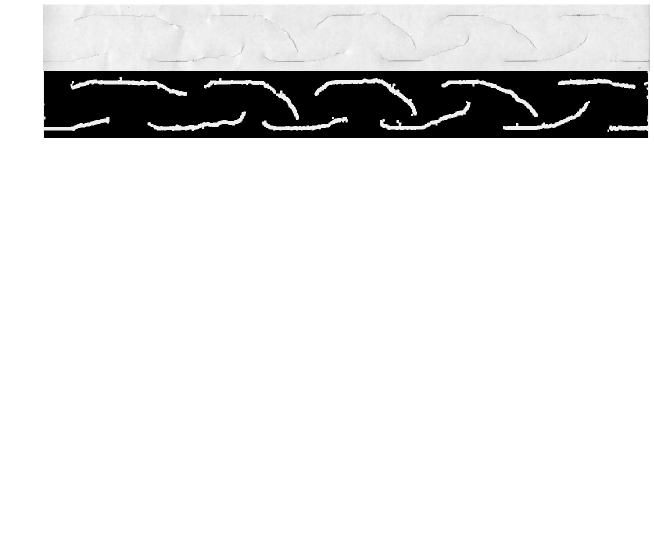
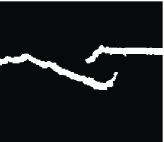
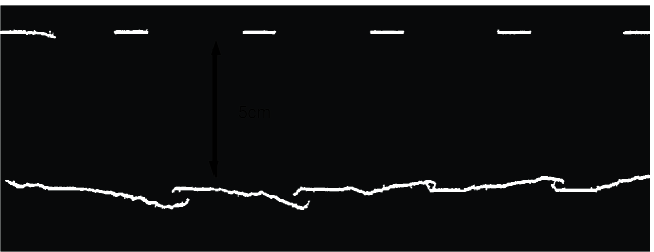
After each experiment, post-mortem samples are digitized using a high resolution scanner. The obtained images are processed in order to get a binary image in which the crack paths can be distinguished. In figure 2, we show an example of a digitized sample and of the corresponding extracted binary image. This image processing allows to finally create for each crack path the profile that describes its shape as a function of the abscissae along the axis corresponding to the initial crack direction and centered on the corresponding initial crack (cf. figure 3).
\psfrag{Y}[l][0.9]{$y$ (cm)}\psfrag{X}[l][0.9]{$x$ (cm)}\includegraphics[width=156.49014pt]{figure3a.eps} \psfrag{Y}[l][0.9]{$y$ (cm)}\psfrag{X}[l][0.9]{$x$ (cm)}\includegraphics[width=209.69667pt]{figure3b.eps}
4 Two types of crack path

For an horizontal spacing cm between the two crack lines, the initial crack array collapses into a single crack line. In figure 4, one can see that the crack paths show a repulsion phase before an attraction one. This initial crack pattern always leads to the so-called type B0 growth behavior. This is the signature of the fact crack tips repulse each other. Indeed, the crack tips move away from the initial crack line before the neighboring tips overtake each other. Then, the paths curve to join the neighboring crack lips tending to form a right angle. Couples of crack paths appear to describe a sort of spiral shape as one can see in figure 5.
For (experimentally cm), two different kinds of behavior have been identified with respect to the crack path shapes among the fifty crack arrays that have been fractured. These two behaviors occur statistically for a given sample geometry. For the first one, that will be referred to as type A, neighboring cracks on different lines attract each other from the beginning of the crack growth up to the end as it is the case in figure 2 (cm). In contrast, for the type B, the crack paths are a mixture of two paths, a repulsive plus attractive path on one end and an attractive path tip to tip on the other end of each crack. For instance, in figure 6 (cm), we observe a repulsion phase for the right tip of the bottom cracks followed by an attraction phase by the neighboring crack on the other line while the right tip of the top cracks tends to join the left tip of the bottom cracks in a rather unexpected way. It seems that the symmetry breaking associated to the repulsive phase of crack growth on one end of the crack allows simultaneously the merging of tips on the other end of the crack.

Finally, when , the two lines of cracks do not interact (cf. figure 7). Actually, one of the two lines fractures preferentially and we get the type B0 behavior previously observed for cm since the situation is comparable.
To summarize the results:
-
—
For , only type B0 is observed.
-
—
For , types A and B are observed.
-
—
For , only type B0 is observed.
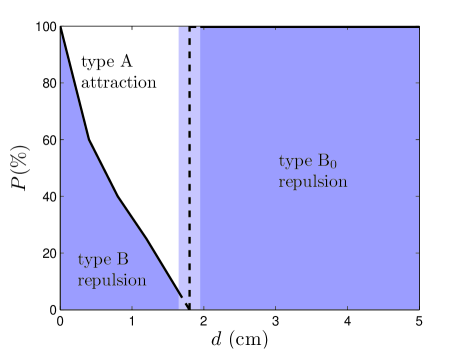
The statistical proportion between types A and B is a function of the spacing between the two initial crack lines. In figure 8, we plot for each value of the percentage of samples for which the fracture process follows type B (including the case B0). This percentage decreases regularly starting from 100 for down to zero for where it jumps back brutally to (this last case corresponds to rupture on a single crack line as observed in figure 7).
In the case of a homogeneous material, we would have expected the crack trajectories to be reproducible from one experiment to the other. A sheet of paper is actually made of a complex network of cellulose fibers. Scanning electron microscopy on our samples shows fiber diameters between 4 and 50m with an average of 18m. Cellulose fibers are themselves a bundle of many microfibrils that have a crystalline structure [48]. The statistical selection between two types of crack path shapes for a given initial crack geometry is probably triggered by this heterogeneity of the fractured material. Indeed, heterogeneity and anisotropy in the initial crack tip toughness and shape due to the heterogeneity of the material might induce small perturbations in the initiation of the crack growth path. We discover that these perturbations are large enough for the crack to explore statistically two very different “meta-stable” crack paths.
Additionally, the crack patterns observed in this section allow us to confirm the fact that, in general, two crack tips repulse each other while a crack tip and a crack lip attract each other.
5 Analysis of attractive cracks in type A samples
In this section, we study the average behavior followed by type A cracks that corresponds to experiments in which the cracks have been attracting each other during their whole growth. For each value of the spacing between the two crack lines, we extract the average profile of the cracks. Actually, for each sample, we compute the mean crack profile averaging over the profiles of all the cracks located on the same initial crack line. In figure 9(a), we plot for three different samples the averaged profiles of the two crack lines separated by cm. Then, we average the profiles over all the type A samples corresponding to the same value of (cf. figure 9(b)). We get the mean type A profile for each value of .
\psfrag{Y}[c][0.9]{$\langle y(x)\rangle$ (cm)}\psfrag{X}[c][0.9]{$x$ (cm)}\psfrag{Z}[c][0.9]{$\langle\langle y(x)\rangle\rangle$ (cm)}\psfrag{A}[c][0.9]{(a)}\psfrag{B}[c][0.9]{(b)}\includegraphics[width=207.7052pt]{figure9a.eps} \psfrag{Y}[c][0.9]{$\langle y(x)\rangle$ (cm)}\psfrag{X}[c][0.9]{$x$ (cm)}\psfrag{Z}[c][0.9]{$\langle\langle y(x)\rangle\rangle$ (cm)}\psfrag{A}[c][0.9]{(a)}\psfrag{B}[c][0.9]{(b)}\includegraphics[width=211.97293pt]{figure9b.eps}
\psfrag{Y}[c][0.9]{$\langle y(x)\rangle$ (cm)}\psfrag{X}[c][0.9]{$x$ (cm)}\psfrag{A}[c][0.9]{(a)}\psfrag{B}[c][0.9]{(b)}\psfrag{L}[c][0.9]{$\ell_{j}$ (cm)}\psfrag{d}[c][0.9]{$d$ (cm)}\psfrag{U}[c][0.9]{$\ell_{j}$}\includegraphics[width=209.12791pt]{figure10a.eps} \psfrag{Y}[c][0.9]{$\langle y(x)\rangle$ (cm)}\psfrag{X}[c][0.9]{$x$ (cm)}\psfrag{A}[c][0.9]{(a)}\psfrag{B}[c][0.9]{(b)}\psfrag{L}[c][0.9]{$\ell_{j}$ (cm)}\psfrag{d}[c][0.9]{$d$ (cm)}\psfrag{U}[c][0.9]{$\ell_{j}$}\includegraphics[width=207.7052pt]{figure10b.eps}
It is important to notice that, depending on the position , the number of profiles on which the averaging is performed is variable since all the cracks do not have the same length in the direction. This is the reason why the averaged profiles, and , are not continuous at all points. For the same value of , cracks of different samples appear to a have very similar mean profiles as one can see in figure 9(a). Additionally, for all type A cracks, the dependence of the crack path on the distance between the initial crack lines is weak and non-systematic. The main difference is that the crack paths extend farther away when the distance is increased (cf. figure 9(b)).
Extending intuitively each crack path to join the neighboring crack lip on the other crack line, we are able to define an hypothetical junction position measured from the center of the joined crack (cf. figure 10(a)). In figure 10(b), we see that this junction distance increases rapidly with . Actually, the rapid increase of this distance between cm and cm suggests that there might be a divergence of the junction position when the distance approaches cm). A divergence of would make sense since when the two crack lines do not interact anymore and thus, the cracks of one line cannot cross those of the other line.
6 Analysis of repulsive cracks in type B samples
\psfrag{Y}[c][0.9]{$\langle y(x)\rangle$ (cm)}\psfrag{X}[c][0.9]{$x$ (cm)}\psfrag{Z}[c][0.9]{$\langle\langle y(x)\rangle\rangle$ (cm)}\psfrag{A}[c][0.9]{(a)}\psfrag{B}[c][0.9]{(b)}\includegraphics[width=209.12791pt]{figure11a.eps} \psfrag{Y}[c][0.9]{$\langle y(x)\rangle$ (cm)}\psfrag{X}[c][0.9]{$x$ (cm)}\psfrag{Z}[c][0.9]{$\langle\langle y(x)\rangle\rangle$ (cm)}\psfrag{A}[c][0.9]{(a)}\psfrag{B}[c][0.9]{(b)}\includegraphics[width=211.97293pt]{figure11b.eps}
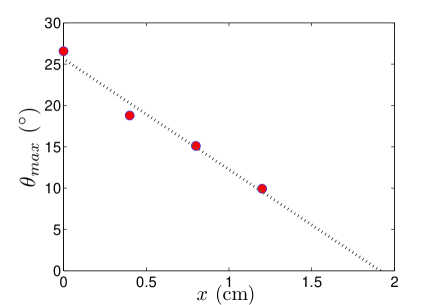
In this section, we study in type B (including B0 for ) samples the average behavior followed by the repulsive crack paths. In figure 11(a), we plot the average profile of repulsive cracks for two samples with cm. We note that, for a given distance , the crack path is reproducible from one sample to the other. In figure 11(b), we plot the average crack profile as a function of and . Clearly, the smaller , the larger the repulsion. One way to quantify this is to measure the maximum angle of deviation during the repulsion phase. As can be seen in figure 12, this quantity decreases with the distance . If we extend linearly this curve, we can see that the effects of the repulsion disappear when reaches a value of about cm. Interestingly, we recover a value in the range corresponding to the characteristic distance above which the two crack lines do not interact.
For , we find a maximum deviation angle . This value is significantly larger than Kachanov’s prediction [32] that was obtained assuming the crack goes in the direction for which the strain energy release rate would be maximum. Melin [30] has a different approach to explain the deviation of collinear cracks. She analyzes the stability of the crack path to a local perturbation. The crack deviation angle is then where is the amplitude of the local deviation and is the crack length. To obtain would require a perturbation cm, a rather unphysical value. A large deviation angle could also be obtained assuming that several smaller local deviations of the crack path occur due to the heterogeneous structure of paper. However, if that was the case, one would expect the crack to progressively rotate instead of turning rather abruptly (see figure 11(b)).
7 Discussion and conclusion
In this article, we have seen that the interactions between two lines of cracks growing under a very low strain rate in a heterogeneous material lead to a statistical behavior. Indeed, for the same initial sample geometry, we get two types of crack path pattern. The type A behavior, that corresponds to a permanent attraction between the cracks during their growth, appears to present a universal shape that does not depend significantly on the initial crack array geometry. On the contrary, for type B behavior, for which the crack paths present either a repulsion phase followed by an attraction or an attraction phase tip to tip, the path trajectories appear to be dependent on the distance between the two initial crack lines . Indeed, the repulsion decreases as increases and finally totaly disappears as tends to a certain distance . This particular value of is also a critical value above which the two lines do not interact anymore. Understanding this value is still an open issue. Also, the value of the crack deviation angle observed in our experiments during the repulsive phase remains unexplained. In particular, it is rather large compared to theoretical predictions.
The statistics observed for the crack path shape is the signature of the meta-stability of two types of crack trajectory for a given geometry. This bi-stability is for the moment an unexplained property but it seems to be intrinsic to the chosen crack pattern geometry. It is likely that the trigger for this statistics comes from the complex structure of paper sheets that makes this material heterogeneous and leads to anisotropy on the initial crack tip shape and toughness. The two types of crack path are two meta-stable paths between which each crack has to choose when it initiates its growth. Only at this initiation stage, may the heterogeneity of the sample strongly influence the crack in its “choice”.
It is also important to point out the collective behavior of the cracks located on the same initial crack line. Indeed, inside a given crack line, all the cracks select a specific dynamics with quasi-identical crack path shape. Actually, the initiation of the global rupture of a sample is probably triggered at one particular crack tip. The choice for the crack shape type is made at this particular moment. Then, an unexplained collective effect operates to make all the cracks throughout a line behave the same way.
References
Références
- [1] Hsieh C and Thomson R, 1973 J. Appl. Phys. 44 2051
- [2] Rice J R, 1979 Proceedings of the U. S. National Congress of Applied Mechanics (Western Periodicals, North Hollywood) p 191
- [3] Marder M, 1996 Phys. Rev. E 54 3442
- [4] Santucci S, Vanel L, Scorretti R, Guarino A and Ciliberto S, 2003 Europhys. Lett. 62 320
- [5] Santucci S, Vanel L and Ciliberto S, 2004 Phys. Rev. Lett. 93 095505
- [6] Santucci S, Cortet P-P, Deschanel S, Vanel L and Ciliberto S, 2006 Europhys. Lett. 74(4) 595
- [7] Santucci S, Vanel L and Ciliberto S, 2007 Eur. Phys. J. Special Topics 146 341
- [8] Schapery R A, 1975 Int. J. Fracture 11 141
- [9] Schapery R A, 1975 Int. J. Fracture 11 369
- [10] Schapery R A, 1975 Int. J. Fracture 11 549
- [11] Kaminskii A A, 1979 Soviet. Appl. Mech. 15 1078
- [12] Kaminskii A A, 2004 Int. Appl. Mech. 40 829
- [13] Chudnovsky A and Shulkin Y, 1999 Int. J. Fracture 97 83
- [14] Cortet P-P, Santucci S, Vanel L and Ciliberto S, 2005 Europhys. Lett. 71(2) 1
- [15] Cortet P-P, Vanel L and Ciliberto S, 2007 Phys. Rev. Lett. 99 255502
- [16] Boudet J-F and Ciliberto S, 2000 Physica D 142 317
- [17] Schmittbuhl J and Måløy K J, 1997 Phys. Rev. Lett. 78 3888
- [18] Boffa J, Allain C and Hulin J-P, 2000 Physica A 278 65
- [19] Salminen L I, Alava M J and Niskanen K J, 2003 Eur. Phys. J. B 32 369
- [20] Mallick N, Cortet P-P, Santucci S, Roux S G and Vanel L, 2006 Phys. Rev. Lett. 98 255502
- [21] Santucci S, Mathiesen J, Måløy K J, Hansen A, Schmittbuhl J, Vanel L, Delaplace A, Bakke J O H and Ray P, 2007 Phys. Rev. E 75 016104
- [22] Célarié F, Prades S, Bonamy D, Ferrero L, Bouchaud E, Guillot C and Marlière F, 2003 Phys. Rev. Lett. 90 075504
- [23] Bonamy D, Ponson L, Prades S, Bouchaud E and Guillot C, 2006 Phys. Rev. Lett. 97 135504
- [24] Ramanathan S, Ertas D and Fisher D S, 1997 Phys. Rev. Lett. 79 873
- [25] Schmittbuhl J, Roux S, Vilotte J-P and Måløy K J, 1995 Phys. Rev. Lett. 74 1787
- [26] Bonamy D, Santucci S and Ponson L, Preprint arXiv:0803.0190
- [27] Kierfeld J and Vinokur V M, 2006 Phys. Rev. Lett. 96 175502
- [28] Cortet P-P, Vanel L and Ciliberto S, 2006 Europhys. Lett. 74(4) 602
- [29] Guarino A, Vanel L, Scorretti R and Ciliberto S, 2006 J. Stat. Mech. P06020
- [30] Melin S, 1983 Int. J. Fracture 23 37
- [31] Hori M and Nemat-Nasser S, 1987 J. Mech. Phys. Solids 35 601
- [32] Kachanov M, 1994 Adv. Appl. Mech. vol 30 (Academic Press, San Diego) p 259
- [33] Kachanov M, 2003 Int. J. Fracture 120 537
- [34] Seelig T and Gross D, 1999 J. Mech. Phys. Solids 47 935
- [35] Xia Z C and Hutchinson J W, 2000 J. Mech. Phys. Solids 48 1107
- [36] Brener E A, Müller-Krumbhaar H and Spatschek R, 2001 Phys. Rev. Lett. 86 1291
- [37] Eremenko A S, Novikov S A and Pogorelov A P, 1979 J. Appl. Mech. Tech. Phys. 20(4) 477
- [38] Dolotova N A, Aleshin V I, Zeiliger V A and Bessonov M I, 1987 Strength Mater. 19 886
- [39] Broberg K B, 1987 Eng. Fract. Mech. 28 663
- [40] An L-J, 1998 Tectonophysics 293 45
- [41] Groisman A and Kaplan E, 1994 Europhys. Lett. 25 415
- [42] Shorlin K, de Bruyn J, Graham M and Morris S, 2000 Phys. Rev. E 61 6950
- [43] Bohn S, Pauchard L and Couder Y, 2005 Phys. Rev. E 71(4) 046214
- [44] Bohn S, Platkiewicz J, Andreotti B, Adda-Bedia M and Couder Y, 2005 Phys. Rev. E 71(4) 046215
- [45] Erdogan R and Sih G C, 1963 J. Basic Eng. 85 519
- [46] Goldstein R V and Salganik R L, 1974 Int. J. Fracture 10 507
- [47] Cotterell B and Rice J R, 1980 Int. J. Fracture 16 155
- [48] Jakob H F, Tschegg S E and Fratzl P, 1994 Struct. Biol. 133 13