Milliarcsecond angular resolution of reddened stellar sources in the vicinity of the Galactic Center ††thanks: Based on observations made with ESO telescopes at Paranal Observatory
Abstract
Context. We present lunar occultation (LO) observations obtained in August 2006 with the recently demonstrated burst mode of the ISAAC instrument at the ESO VLT. The results presented here follow the previously reported observations carried out in March 2006 on a similar but unrelated set of sources.
Aims. Interstellar extinction in the inner regions of the galactic bulge amounts to tens of magnitudes at visual wavelengths. As a consequence, the majority of sources in that area are poorly studied and large numbers of potentially interesting sources such as late-type giants with circumstellar shells, stellar masers, infrared stars, remain excluded from the typical investigations which are carried out in less problematic regions. Also undetected are a large numbers of binaries. By observing LO events in this region, we gain the means to investigate at least a selected number of sources with an unprecedented combination of sensitivity and angular resolution.
Methods. The LO technique permits to achieve milliarcsecond resolution with a sensitivity of K12 mag at a very large telescope. We have used the opportunity of a favorable passage of the Moon over a crowded region in the general direction of the Galactic Center to observe 78 LO events of heavily reddened stellar sources.
Results. We have detected six new binary and one triple star, with typical projected separation of . We have also detected the compact circumstellar emission around one maser and one central star of a planetary nebula. Additionally we have measured the diameter and/or circumstellar shell of two carbon stars and other IR sources.
Conclusions. We have used the upper limits on the size of about 60 unresolved or marginally resolved sources to establish the performance of the method. In agreement with our previous result, we conclude that lunar occultations in fast read-out mode on a detector subwindow at an 8 m-class telescope can achieve an angular resolution close to with a sensitivity K mag.
Key Words.:
Techniques: high angular resolution – Astrometry – Occultations – Stars: binaries – Stars: carbon – Masers1 Introduction
This paper follows closely the scientific rationale, method, observations and results already presented in Richichi et al. (PaperI (2008), Paper I hereafter), where we introduced the technique of lunar occultations (LO) at the ESO Very Large Telescope using a fast readout (burst mode) of the ISAAC instrument. For our application, the burst mode allows to sample subarrays of 32 or 64 squared pixels with sampling times of 3.2 or 6.4 ms, respectively. We demonstrated that in this way it is possible to record LO data with the highest quality ever achieved in terms of signal-to-noise ratio (SNR), thanks also to the strong reduction of scintillation made possible by the 8.2 m mirror in the near-IR. In Paper I we characterized in detail the performance, which approached milliarcsecond (mas) in angular resolution, K mag in sensitivity, and K mag in dynamic range on scales smaller than the Airy disk of the telescope. Notwithstanding the obvious limitations of LO with respect to the choice of the sources and the repeatability, this combined performance is superior to that of any other technique presently available for high angular resolution in the near-IR.
In Paper I we took advantage of a recently developed data pipeline which employs an automated generation of masks and light curve extraction and generates the first-guess parameters for the fitting (AWLORP, Fors et al. fors08 (2008)). This pipeline allows us to perform a quick preliminary inspection of large volume of LO data. Subsequently, a more detailed interactive analysis is performed on a selected number of sources using both model-dependent and model-independent procedures (ALOR and CAL respectively, Richichi et al. richichi96 (1996) and Richichi CAL (1989)).
In the present paper we report on LO observations carried out in the night of August 5, 2006, during which 78 events were observed. We descrive the observations and the list of sources in Sect. 2, without recalling the details of the method and of the data analysis which can be found in Paper I and references therein. Subsequently, we discuss the results in Sect. 3. These include several new detections of binary and triple stars, as well as angular diameters and circumstellar shells of diverse objects such as a maser, two carbon stars, and the central star of a planetary nebula.
2 Observations
We observed a passage of the Moon in a crowded, heavily reddened region in the direction of the Galactic Bulge, in the night of August 5-6, 2006. The center of this region was located at and . Fig. 1 shows the area, with the apparent lunar path superimposed. Note that this region is contiguous but barely overlapping with the area of the events reported in Paper I. In particular, there were no sources observed on both dates.
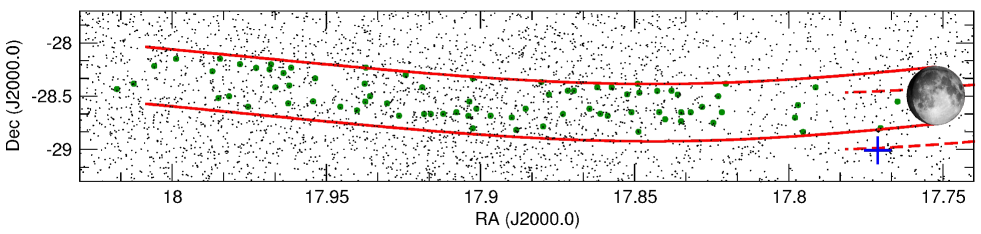
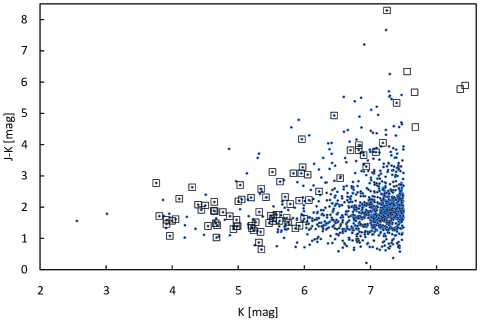
Although the minimum approach of the Moon to the Galactic Center, as seen from Paranal, was larger in August than in March 2006 (12 and 12 respectively), the region is nevertheless heavily reddened by interstellar dust. A near-IR color-mgnitude diagram is shown in Fig. 2, where we include only sources with K mag to avoid overcrowding.
Our predictions were based on the 2MASS Catalogue (Cutri et al 2003yCat.2246….0C (2003)). To the limit K mag a total of 6421 sources were due to be occulted during the night. As was the case in Paper I, it would have been impossible to observe all these events, not to mention the even huger number of those possible up to the sensitivity limit of the technique. We then applied a prioritization scheme which took into account the magnitude, the color (redder objects having higher priority), and the time intervals between the events. Priorities were increased for sources with known cross-identifications and previous measurements. We carried out our observations over about 8.5 hours, during which a total of 78 events were recorded. We took advantage of the experience with such observations from our previous run, and of the fact that the August events were disappearances (lunar phase 84%), making the pointing significantly easier. Also the image quality was significantly improved, with frequent checks of the active optics correction for the primary mirror. Our main limitation were, as before, the overheads for telescope pointing and data storing. At best, we could record an occultation every three minutes. Given the more favorable circumstances in this second run, we adopted a subwindow size of 32x32 pixels for most of the events, and detector integration time (DIT) of 3.2 ms. This is also the sampling time. In a few cases, we adopted the configuration 64x64 pixels and DIT=6.4 ms. The field of view in the two cases was about and squared. Data acquisition was triggered automatically according to the time of the event, and the typical length of the recorded data was between 10 and 20 seconds, in order to account for some uncertainty in the predictions.
3 Results
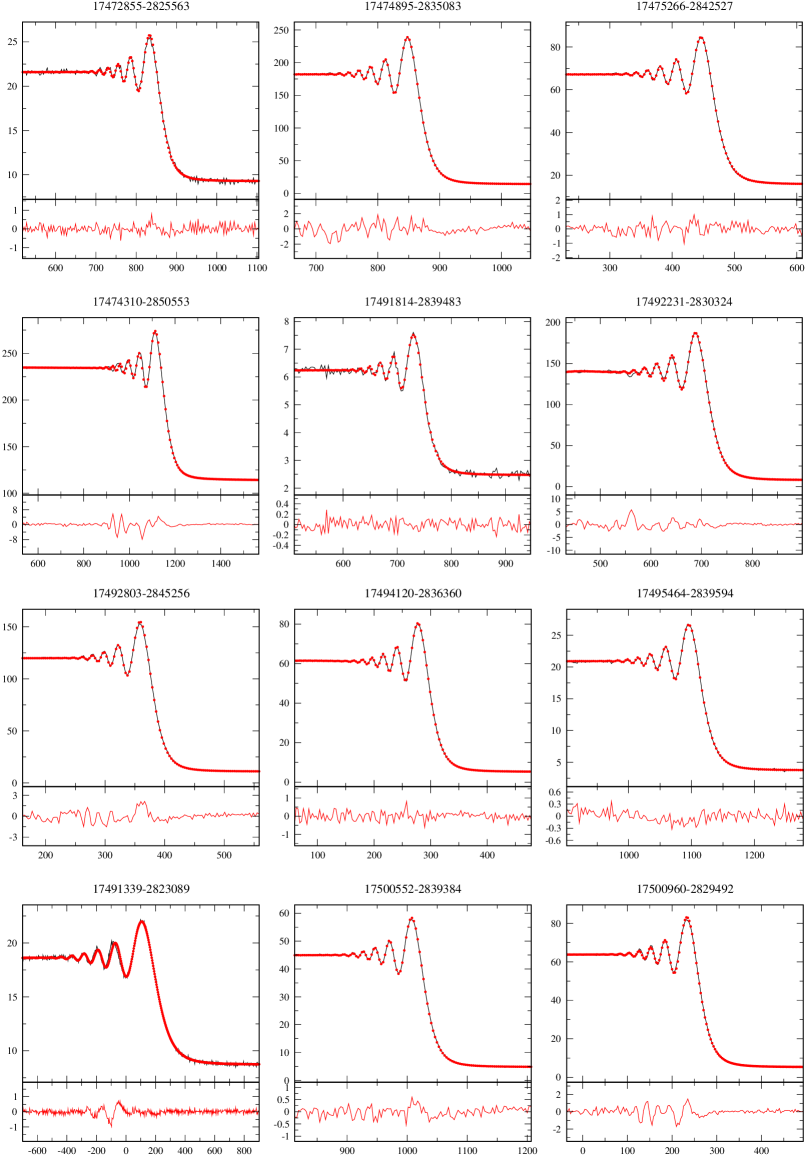
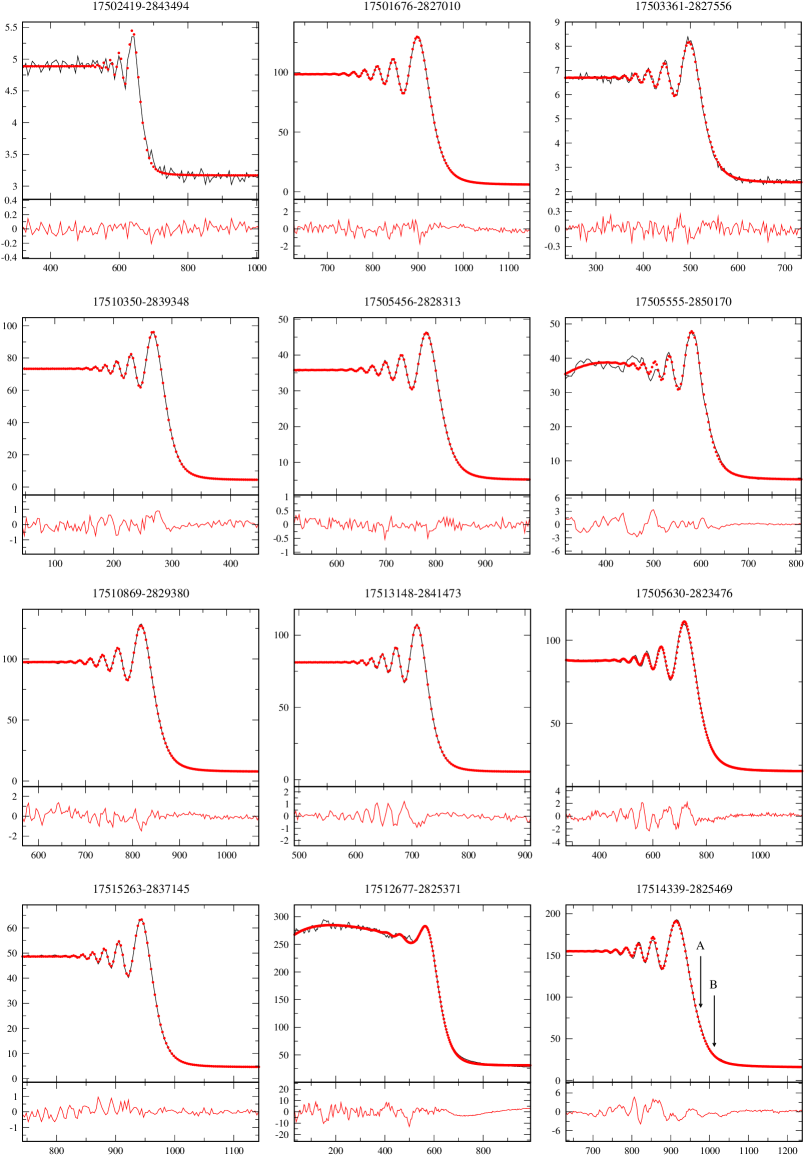
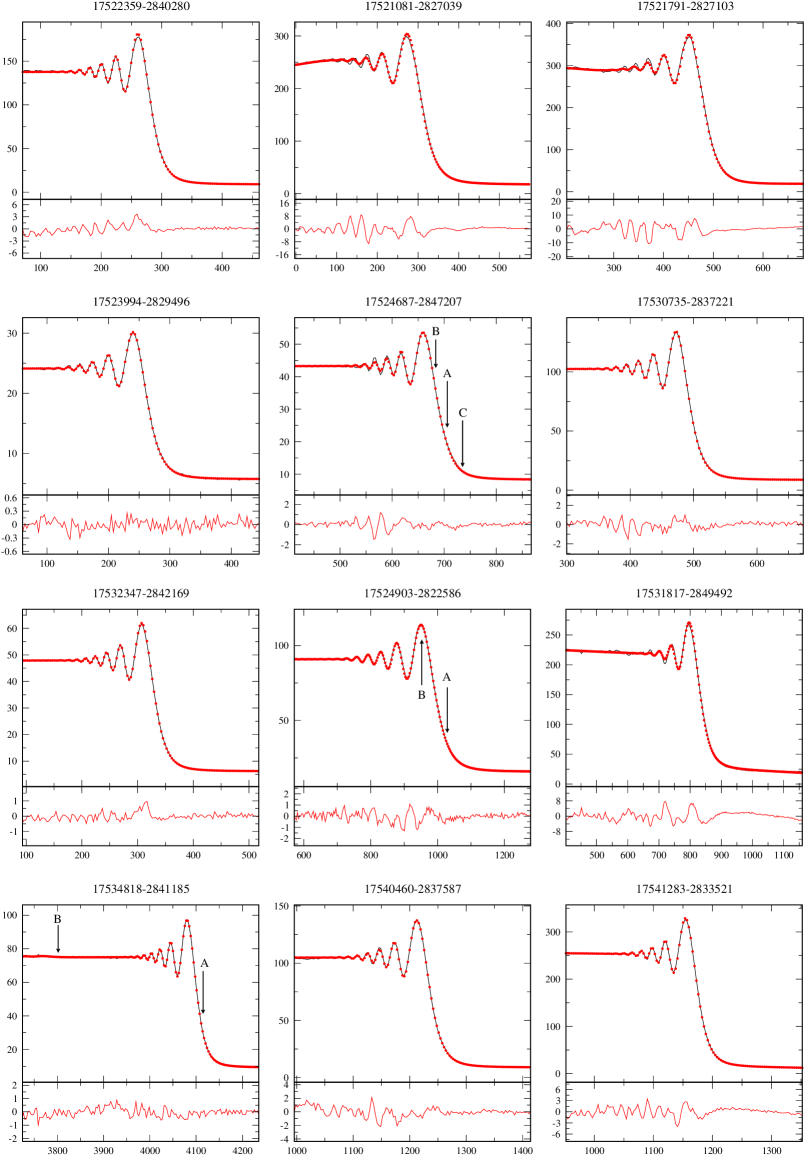
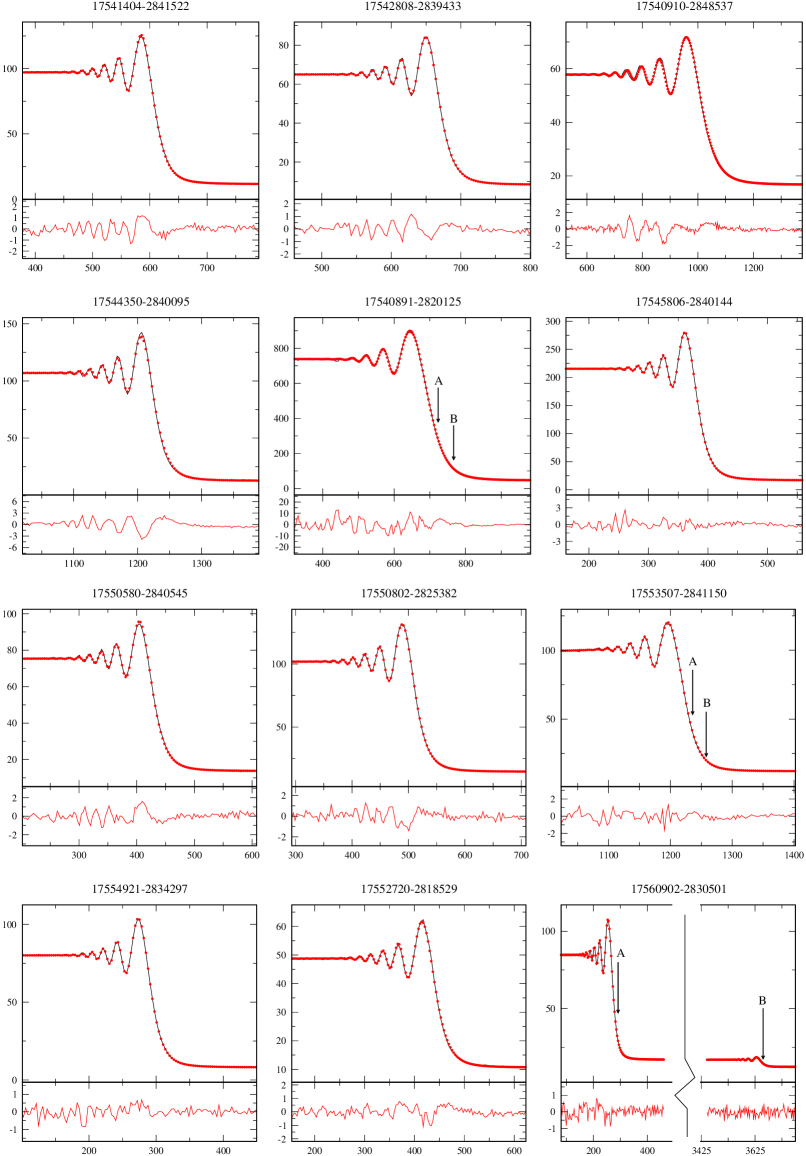
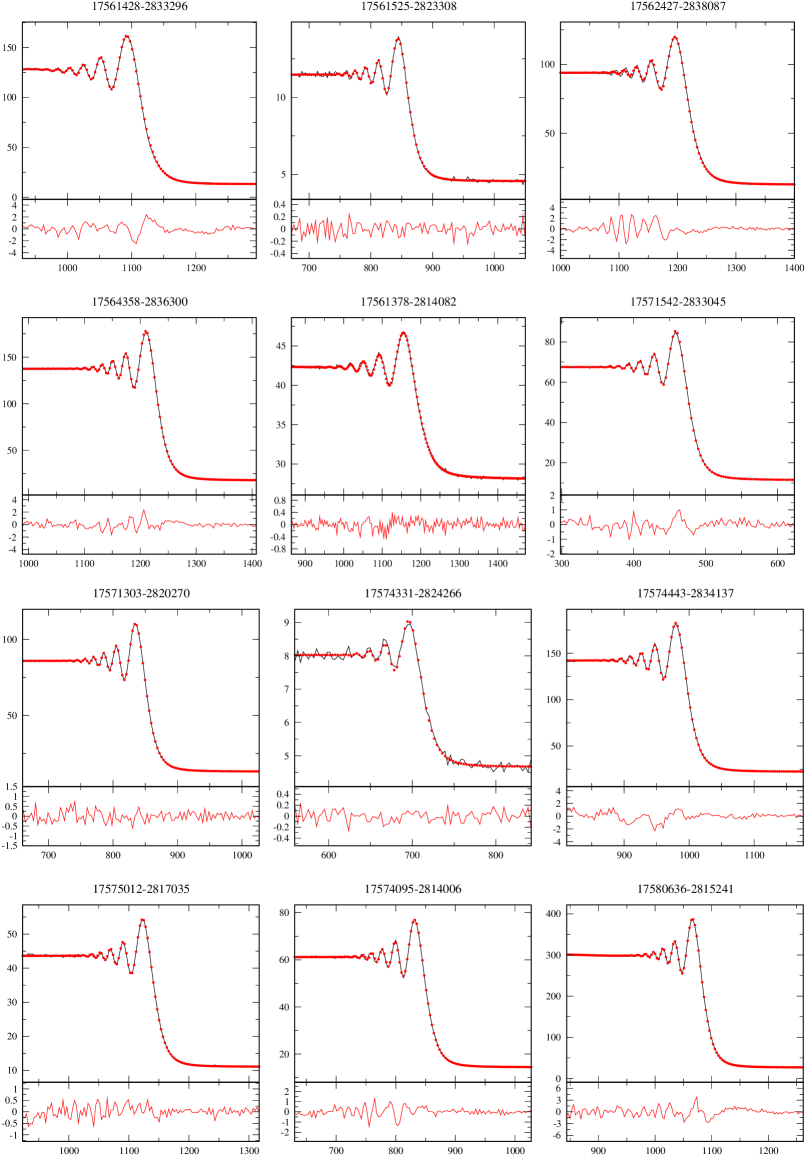
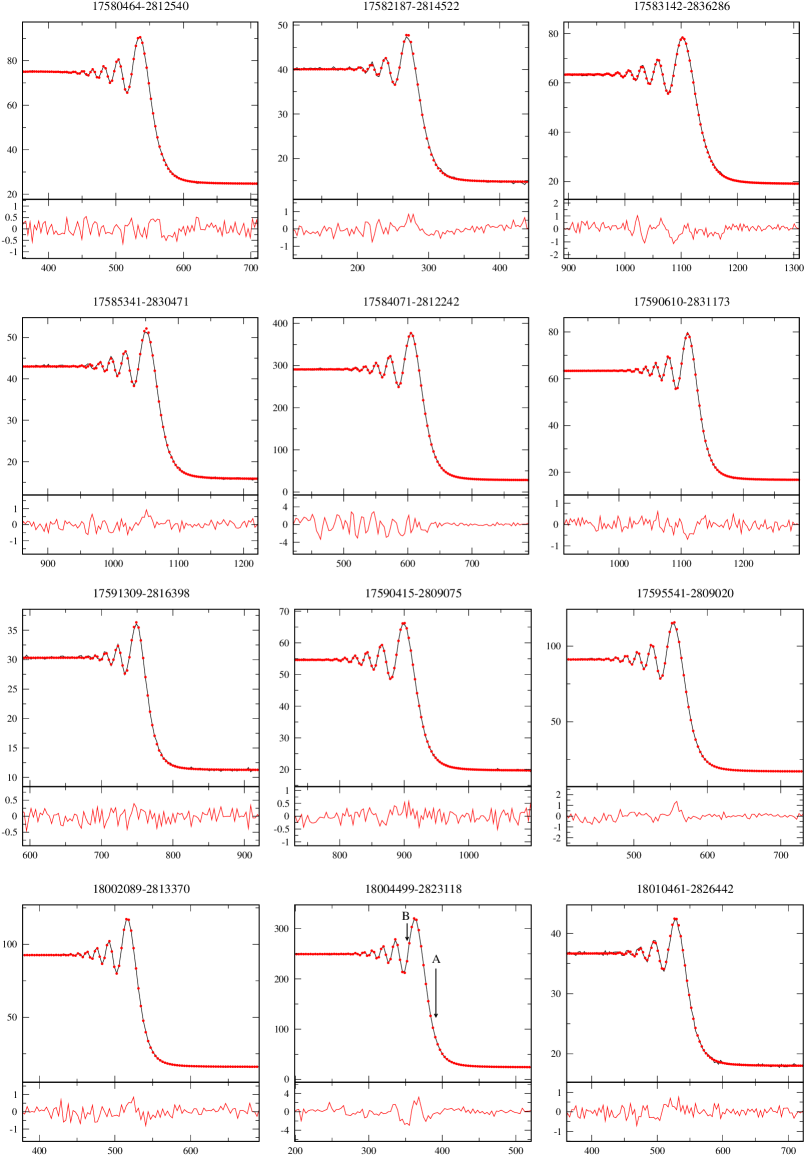
A list of the sources observed, including details of observation and comments, is provided in Table LABEL:lo_complete. We list for completeness the total of 78 recorded events, but in 6 cases no LO was detected. Most of the sources have no entries in the Simbad database, with only 10 of the sources in Table LABEL:lo_complete having a cross-identification, and only 4 having a spectral determination. The K magnitudes range from 3.8 to 8.4 mag, a wider range than in Paper I, and the J-K colors from 0.6 to 8.3. The complete set of light curves and best fits is available online. In the following we will discuss individually the sources which were found to be resolved or binaries, and separately we will use the unresolved sources to characterize the performance of the method.
Table 2 lists sources which were found to be resolved in our observations, either with an angular diameter or with a compact circumstellar shell, or as binary stars. The table uses the same format already adopted in Paper I and in previous papers referenced therein. In summary, the columns list the value of the fitted linear rate of the event V, its deviation from the predicted rate Vt, the local lunar limb slope , the position and contact angles, and the SNR. For binary detections, the projected separation and the brightness ratio are given, while for resolved stars the angular diameter is reported, under the assumption of a uniform stellar disc, or the characteristic size of the shell. All angular quantities are computed from the fitted rate of the event.
| (1) | (2) | (3) | (4) | (5) | (6) | (7) | (8) | (9) | (10) |
|---|---|---|---|---|---|---|---|---|---|
| Source | V (m/ms) | V/Vt–1 | () | PA() | CA() | SNR | Sep. (mas) | Br. Ratio | (mas) |
| 17512677-2825371 | 0.2787 | 24.9% | 10 | 25 | 64 | 66.5 | 13.2 (shell) | ||
| 17514339-2825469 | 0.3825 | 2.9% | 1 | 35 | 52 | 104.6 | 7.4 1.5 | 6.1 0.3 | |
| 17524687-2847207A-B | 0.5291 | 5.0% | 5 | 130 | 45 | 99.6 | 8.7 1.1 | 11.8 1.2 | |
| 17524687-2847207A-C | 93.1 | 6.5 0.2 | 73 29 | ||||||
| 17524903-2822586 | 0.3097 | 10.7% | 4 | 22 | 61 | 186.7 | 13.1 2.4 | 31.2 2.5 | |
| 17531817-2849492 | 0.3932 | 14.0% | 5 | 147 | 64 | 127.1 | 5.83 0.10 | ||
| 17534818-2841185 | 0.6422 | 4.3% | 7 | 113 | 29 | 213.1 | 112 10 | 121.4 19.8 | |
| 17540891-2820125 | 0.3044 | 12.0% | 4 | 19 | 62 | 160.0 | 7.56 0.16 | 7.38 0.15 | 5.30 0.06 |
| 17545806-2840144 | 0.6266 | 0.9% | 1 | 111 | 30 | 339.6 | 2.73 0.13 | ||
| 17553507-2841150 | 0.6060 | 7.2% | 5 | 125 | 45 | 149.3 | 7.36 0.34 | 6.05 0.35 | shell? |
| 17582187-2814522 | 0.7391 | 2.8% | 3 | 46 | 32 | 91.3 | 4.72 0.49 | ||
| 18004499-2823118 | 0.8590 | 1.9% | 2 | 101 | 23 | 267.2 | 18.6 1.2 | 77.1 9.2 |
3.1 Resolved sources
2MASS 17512677-2825371 is coincident with the radio-luminous maser OH 1.09-0.83, which has no optical counterpart. Jones et al. (jones88 (1988)) used near-IR spectra to classify this star as a true core-burning supergiant. Our data are not easy to fit over an extended time sequence, due to flux oscillations which could be due to telescope jitter coupled to the small field of view over the extended emission around this source. Also the fitted rate of the event is significantly different from the predicted one (see Table 2), which is not out of the ordinary however given the rather high value of the CA. In any case, the data around the central time of occultation unambiguously indicate a very resolved source. A CAL analysis shows a central peak with about 11 mas FWHM, surrounded by rather symmetrical wings extending to about . This is in good agreement with the conclusions of Cobb & Fix (cobb87 (1987)), who obtained 1-D speckle observations of this source at 10 and 5 m, finding it to be generally symmetric with angular sizes of and , respectively.
2MASS 17531817-2849492 is identified with a carbon star well detected both in the visual (CGCS 3889, V=11.6 mag) and in the mid-IR (IRAS 17501-2849, 6 Jy at 12 m). Our data are best fitted by a resolved central star of 5.8 mas (see Table 2) and a circumstellar component. The CAL analysis reveals that this latter contributes 9.2% of the total K-band flux, and extends over about with an asymmetric profile. Two narrow maxima of emission from the shell can be detected at 10 mas from the position of the central star, or about 2 R∗, and are interpreted as the inner rim. Unfortunately, no estimates of the distance to CGCS 3889 are available. Based on its brightness and the relatively large angular sizes of the star and the shell, we speculate that this source is well in the foreground with respect to the galactic bulge and that its J-K color of 2.6 mag is of local origin.
2MASS 17540891-2820125 is a very reddened source, with K=3.8 mag from the 2MASS catalogue. Other designations include IRC-30330 and AFGL 5151S. Hansen & Blanco (hansen73 (1973)) associated it with an optical counterpart having V mag and spectral type M8 or cooler. Variability is of course prominent, and even in K-band the brightness appears to have decreased by about 1.5 mag from the measurement in the above paper to the 2MASS value. Our data show a significantly resolved star, and in fact our data-independent CAL analysis has revealed a close companion which has subsequently been confirmed in an improved model-dependent binary fit. A near-IR LO of this source was already recorded in 1988 (i.e. one Saros cycle earlier) and discussed by Richichi et al. (1992a , RLD hereafter). Also at that time the angular diameter was resolved, albeit with a slightly smaller diameter than our present measurement. We have re-analyzed the older data, and looked for the presence of a faint companion. Luckily, the data quality was sufficiently high also in the previous observation (SNR=127), and indeed we now confirm that the 1988 data are indeed better fitted with a resolved star and a companion than by the RLD single component fit. The combination of the position angles and projected separations of the 1988 and 2006 data would yield the true parameters PA= and mas. This however is subject to the condition that the orbital motion has been negiglible in the intervening 18 years, which is difficult to verify in the absence of a reliable distance to the star. We note in conclusion that, albeit the smaller angular diameter measured in 1988 is subject to more uncertainty than the present one due to a number of artifacts described in detail in RLD, this is consistent at least in principle with the brightness decrease observed since.
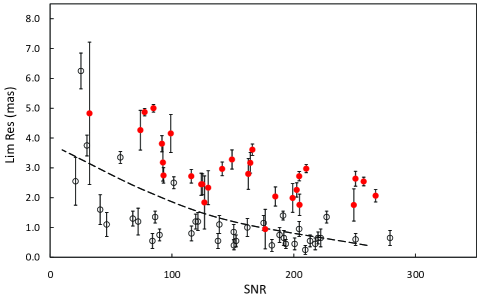
2MASS 17582187-2814522 exhibits significant reddening (J-K=3.8 mag) and is associated with the planetary nebula ESO 456-27. Cross-identifications with a wide range of nomenclature exist, including IRAS 17552-2814 which reports a flux of 8.0 Jy at 12 m and 24,7 Jy at 100 m, but only upper limits at other wavelengths. Our data are of course sensitive only to the inner regions on the sub-arcsecond scale, and they reveal a compact, clearly resolved source. When fitted with a uniform-disk model, the angular diameter is 4.7 mas (see Table 2). Tajitsu & Tamura (tajitsu (1998)) have computed distances for a long list of planetary nebulae, but they have excluded ESO 456-27 because of its IR flux being not consistent with a black body. Zhang (zhang (1995)) used different statistical relations and estimated a distance of 8.2 kpc, while Cahn et al. (cahn92 (1992)) had derived the value 5.35 kpc. In spite of the uncertainties, it is clear that our result corresponds to a linear extent AU and is thus unrelated to the size of the central star. The most likely interpretation is that we are detecting the emission from the dust around the central star. Unfortunately the lack of extensive infrared fluxes prevents detailed estimates of the spectral energy distribution and further conclusions. To be consistent with the arguments given later in Sect. 3.3, we note that the SNR and diameter accuracy for this source place it at the margin of what can be considered reliably resolved in Fig. 5.
Using the same argument but with opposite conclusions, we note that the source 2MASS 17545806-2840144 has a relatively small diameter value but appears to be convincingly resolved using the guidelines of Fig. 5. Thus we include this source in Table 2, although the expected diameter for a late-type star of the same brightness (K=4.4 mag) in the absence of circumstellar emission would be significantly smaller than 1 mas. In the absence of cross-identifications and distance estimates, it is difficult to argue if the color J-K=2.1 mag could be due to local or to interstellar extinction.
3.2 Binaries
In addition to IRC-30330 mentioned above, other 6 sources were found to be binary or triple, with relatively small projected separations and magnitude differences between the components up to mag. They are all new detections, and for three of them no optical or infrared counterparts are known and no literature references exist. These include 2MASS 17514339-2825469, 2MASS 17524687-2847207 and 2MASS 17524903-2822586. Their J-K colors, while being quite red, are not especially extreme compared with the rest of the sample and are probably indicative of a foreground location with respect to the bulge. Under this assumption, their projected separations would correspond to about 10-50 AU.
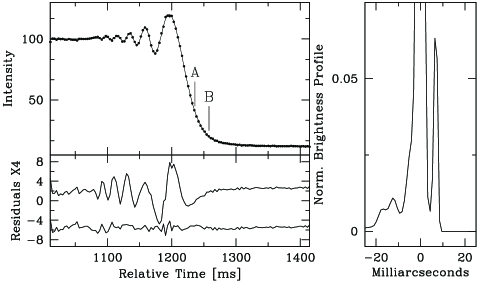
The scenario is similar for the remaining three new binaries, which do have known cross-identifications. 2MASS 17553507-2841150 has no optical counterpart, but is well detected in the mid-IR as IRAS 17524-2840, with fluxes of about 23, 10 and 3 Jy at 12, 25 and 60 m. Volk et al (volk91 (1991)) found the IRAS low resolution spectrum of this source to be unusual and not easily classifiable. On the basis of both IRAS and ground-based IR photometry Gugliemo et al (guglielmo93 (1993)) classified it as a carbon star. Fig. 4 shows that our data are best fitted by a binary model. We note that the diameter of the primary is found to be mas, but we consider this as marginally resolved as discussed in Sect. 3.3. The CAL analysis shown in the right panel of Fig. 4 also seems to indicate some extended emission on the scale of a few stellar radii, but since in this case we used a low-order Legendre polynomial to fit some scintillation (Richichi et al 1992b ), we are not able to further confirm it. We note that the brightness of the object seems to have decreased from K=3.17 mag reported by Gugliemo et al (guglielmo93 (1993)) to K=4.11 mag measured by 2MASS. The J-K colors have changed more markedly.
2MASS 17534818-2841185 has a bright optical counterpart in HD 162761. The magnitudes are V=7.9, K=5.3 and the spectral type K0III. No references are found in the literature for this star. 2MASS 18004499-2823118 is the infrared source IRAS 17575-2823, with 3.1 Jy at 12 m. It is undetected in the other IRAS bands, and has no optical counterpart. Follow up studies of all these sources are desirable, but they appear challenging with any other technique other than LO. We also note that some other stars in our sample have companions on much larger (arcsecond) scales. These are marked in Table LABEL:lo_complete, but we do not provide details as they can be easily detected with standard imaging.
3.3 Unresolved sources and performance
We have tested the resolved/unresolved character of all the sources in our sample using a criterium of variations in the of the fit, as described in Paper I and references therein. Excluding the sources just discussed in Sect. 3.1, the remaining 61 stars were found to be unresolved (i.e. with an upper limit on the angular diameter), or only marginally resolved (i.e. with an angular diameter which is not distinguishable from unresolved when the error bars are taken into account). We plot these values as a function of SNR in Fig. 5, where it can be seen that the empirical relationship for the limiting angular resolution tentatively established in Paper I still holds satisfactorily.
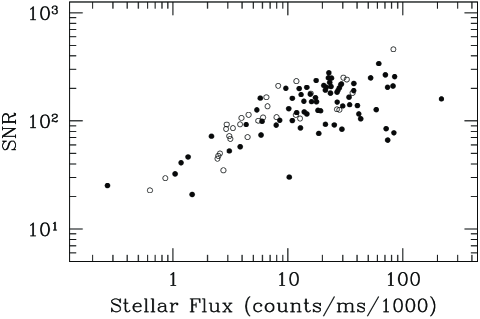
Also the relationship between stellar flux and SNR is in good agreement with the one previously reported in Paper I, as shown in Fig. 6. The longer DIT employed in the observations of Paper I does not seem to have clear-cut consequences: on one side more photons are collected for the same magnitude, but on the other side the time sampling of the light curve is poorer. As before, we estimate the limiting magnitude of the method at K mag for SNR=1. However, it can be noticed that the points relative to the August 2006 observations tend to have more scatter, especially at the fainter magnitudes.
We believe that this scatter is due to the fact that the August run included more faint sources than the March one, and also to intrinsic variability. We show in Fig. 7 a plot of the measured flux against the 2MASS magnitude. In the absence of the image clipping and image quality problems encountered in Paper I, the distribution of the points in Fig. 7 follows very closely the expected ISAAC performance.

It can now be clearly seen that several sources had a flux, at the time of our measurement, significantly different from the 2MASS value. This is indicative of variability, both as brightening and as dimming, of up to two magnitudes in the K band. Not surprisingly, some of our well resolved sources with a complex structure are also those which exhibit the largest difference between our measured flux and the 2MASS magnitude. These include the maser 2MASS 17512677-2825371, almost six times brighter in August 2006 than at the time of the 2MASS measurement, and IRC-30330, 1.6 times brighter. We also mention that 2MASS 17545806-2840144 appeared significantly brighter too, which could help in understanding why the source appears larger in size than expected. The putative carbon star 2MASS 17553507-2841150, for which we detected a new companion, was almost two times fainter at the time of our measurement than expected.
8
8
8
8
8
8
4 Conclusions
We have reported on additional lunar occultation observations, after those reported in Paper I, using the burst mode of the ISAAC instrument at the ESO VLT. During a passage of the Moon in the central regions of the galactic bulge, we have recorded 78 LO events (72 with a positive detection) over 8.5 hours. Our results include the new detection of six binaries and one triple star, with typical projected separations of mas, i.e. five times less than the diffraction limit of the 8.2 m telescope. Brightness ratios were as low as 1:100. We have also detected and measured the extended emission arising from circumstellar dust around one maser star, two carbon stars, the central star of a planetary nebula and other IR stars.
Our sources have no or very few known counterparts, and other information such as fluxes or spectra is also missing or very scarce. Follow-up studies are necessary in order to better characterize the energy distribution and spectral characteristics of these sources. Our measurements have also shown a significant amount of variability in many of the sources, with differences between our determination and the 2MASS flux which approached 2 mag in some cases.
As shown in this paper and in Paper I, the LO technique using a fast readout on a detector subwindow at a large telescope provides an unprecedented combination of sensitivity and high angular resolution, namely K12 mag and respectively. Fast-photometry on a detector subwindow is now a well-characterized observational mode, publicly offered at the VLT.
Acknowledgements.
This work is partially supported by the ESO Director General’s Discretionary Fund and by the MCYT-SEPCYT Plan Nacional I+D+I AYA #2005-08604. AR wishes to thank the National Astronomical Observatory of Japan in Mitaka, where he worked on the writing of this paper. This research has made use of the SIMBAD database, operated at CDS, Strasbourg, France.References
- (1) Cahn, J. H., Kaler, J. B., & Stanghellini, L. 1992, A&AS, 94, 399
- (2) Cobb, M. L., & Fix, J. D. 1987, ApJ, 315, 325
- (3) Cutri, R. M., Skrutskie, M. F., van Dyk, S. et al. 2003, The IRSA 2MASS All-Sky Point Source Catalog, NASA/IPAC Infrared Science Archive
- (4) Fors, O., Richichi, A., Otazu, X., & Nunez, J. 2008, A&A, 480, 297
- (5) Guglielmo, F., Epchtein, N., Le Bertre, T., Fouque, P., Hron, J., Kerschbaum, F., & Lepine, J. R. D. 1993, A&AS, 99, 31
- (6) Hansen, O.L., Blanco, V.M. 1973, AJ, 78, 669
- (7) Jones, T. J., Hyland, A. R., Fix, J. D., & Cobb, M. L. 1988, AJ, 95, 158
- (8) Richichi, A. 1989, A&A, 226, 366
- (9) Richichi, A., Lisi, F., di Giacomo, A. (RLD) 1992a, A&A, 254, 149
- (10) Richichi, A., di Giacomo, A., Lisi, F., & Calamai, G. 1992b, A&A, 265, 535
- (11) Richichi, A., Baffa, C., Calamai, G., Lisi, F. 1996, AJ, 112, 278
- (12) Richichi, A., Fors, O., Mason E., Stegmeier J., Chandrasekhar T. (Paper I) 2008, A&A, in press
- (13) Tajitsu, A., & Tamura, S. 1998, AJ, 115, 1989
- (14) Volk, K., Kwok, S., Stencel, R. E., & Brugel, E. 1991, ApJS, 77, 607
- (15) Zhang, C. Y. 1995, ApJS, 98, 659
| 2MASS id | Frame | NDIT | Time | K | J-K | Sp | Cross-Id | Notes |
|---|---|---|---|---|---|---|---|---|
| (px) | (UT) | (mag) | ||||||
| 17455299-2833479 | 64 | 14000 | 22:32:02 | 8.43 | 5.89 | not seen | ||
| 17461267-2848121 | 32 | 14000 | 23:11:38 | 6.45 | 4.93 | not seen | ||
| 17472855-2825563 | 32 | 14000 | 23:29:29 | 7.25 | 8.29 | piq | ||
| 17474895-2835083 | 32 | 14000 | 23:35:45 | 4.44 | 1.91 | piq | ||
| 17475266-2842527 | 32 | 14000 | 23:43:36 | 5.62 | 1.56 | piq | ||
| 17474310-2850553 | 64 | 12000 | 0:00:20 | 5.52 | 3.12 | |||
| 17491814-2839483 | 32 | 14000 | 0:30:19 | 7.67 | 5.67 | piq | ||
| 17492231-2830324 | 32 | 14000 | 0:37:02 | 4.64 | 1.87 | |||
| 17492803-2845256 | 32 | 14000 | 0:41:27 | 4.77 | 1.84 | M6 | 2MASS J17492803-2845256 | |
| 17494120-2836360 | 32 | 14000 | 0:44:20 | 5.53 | 1.64 | soc | ||
| 17495464-2839594 | 32 | 14000 | 0:52:57 | 5.96 | 4.17 | |||
| 17491339-2823089 | 32 | 12000 | 0:56:40 | 7.55 | 6.34 | |||
| 17500552-2839384 | 32 | 14000 | 0:59:40 | 5.83 | 3.08 | |||
| 17500584-2844582 | 32 | 6904 | 1:03:42 | 6.05 | 3.04 | not seen | ||
| 17500960-2829492 | 32 | 14000 | 1:09:32 | 5.47 | 1.49 | soc | ||
| 17502419-2843494 | 64 | 8000 | 1:13:48 | 8.36 | 5.78 | |||
| 17503131-2839110 | 32 | 2190 | 1:15:53 | 6.82 | 3.83 | not seen | ||
| 17501676-2827010 | 32 | 14000 | 1:21:22 | 4.97 | 1.39 | |||
| 17503361-2827556 | 32 | 14000 | 1:29:47 | 6.94 | 3.30 | |||
| 17510350-2839348 | 32 | 14000 | 1:36:23 | 5.31 | 0.87 | |||
| 17505456-2828313 | 32 | 12000 | 1:41:49 | 6.22 | 2.50 | |||
| 17505555-2850170 | 32 | 14000 | 1:44:38 | 5.71 | 2.33 | edge | ||
| 17510869-2829380 | 32 | 14000 | 1:48:21 | 5.03 | 2.71 | |||
| 17513148-2841473 | 32 | 14000 | 1:54:50 | 5.19 | 2.31 | |||
| 17514002-2840031 | 32 | 10000 | 1:59:39 | 3.91 | 1.46 | not seen | ||
| 17505630-2823476 | 32 | 14000 | 2:02:33 | 5.34 | 1.21 | soc | ||
| 17515263-2837145 | 32 | 14000 | 2:07:47 | 5.76 | 1.51 | soc | ||
| 17512677-2825371 | 32 | 14000 | 2:11:15 | 5.97 | 3.28 | GAL 001.095-00.832 | long | |
| 17514339-2825469 | 32 | 14000 | 2:20:34 | 4.54 | 1.40 | |||
| 17522359-2840280 | 32 | 14000 | 2:27:17 | 4.66 | 1.48 | |||
| 17521081-2827039 | 32 | 14000 | 2:32:43 | 3.96 | 1.08 | M2 | HD 316515 | |
| 17521791-2827103 | 32 | 8000 | 2:36:36 | 3.80 | 1.71 | |||
| 17523994-2829496 | 32 | 14000 | 2:43:58 | 7.68 | 4.56 | |||
| 17524687-2847207 | 32 | 14000 | 2:49:36 | 5.35 | 2.58 | IRAS 17496-2846 | ||
| 17530735-2837221 | 32 | 14000 | 2:54:08 | 4.99 | 1.39 | |||
| 17532347-2842169 | 32 | 8000 | 3:05:50 | 5.95 | 3.08 | |||
| 17524903-2822586 | 32 | 14000 | 3:08:10 | 5.21 | 1.33 | |||
| 17531817-2849492 | 32 | 8000 | 3:17:43 | 4.30 | 2.64 | C* 2490 | ||
| 17534818-2841185 | 32 | 14000 | 3:20:22 | 5.35 | 0.65 | K0III | HD 162761 | |
| 17540460-2837587 | 32 | 14000 | 3:28:41 | 4.93 | 1.30 | 2 stars | ||
| 17541283-2833521 | 32 | 10000 | 3:33:53 | 4.64 | 2.17 | IRAS 17510-2833 | ||
| 17541404-2841522 | 32 | 14000 | 3:36:48 | 5.42 | 2.31 | |||
| 17542808-2839433 | 32 | 14000 | 3:43:29 | 5.53 | 1.56 | piq | ||
| 17540910-2848537 | 32 | 10000 | 3:50:10 | 5.86 | 1.32 | |||
| 17544350-2840095 | 32 | 14000 | 3:53:04 | 4.97 | 1.60 | |||
| 17540891-2820125 | 32 | 10000 | 3:57:03 | 3.76 | 2.77 | M8+: | NSV 9818 | |
| 17545806-2840144 | 32 | 14000 | 4:01:52 | 4.39 | 2.08 | |||
| 17550580-2840545 | 32 | 14000 | 4:07:14 | 7.19 | 4.06 | piq | ||
| 17550802-2825382 | 32 | 10000 | 4:11:16 | 5.00 | 2.19 | |||
| 17553507-2841150 | 32 | 10000 | 4:25:23 | 4.11 | 2.27 | IRAS 17524-2840 | ||
| 17554921-2834297 | 32 | 14000 | 4:27:54 | 5.23 | 1.25 | |||
| 17552720-2818529 | 32 | 12000 | 4:34:23 | 5.93 | 1.40 | |||
| 17560902-2830501 | 32 | 12000 | 4:38:31 | 5.32 | 1.85 | 2stars | ||
| 17561428-2833296 | 32 | 14000 | 4:41:19 | 5.63 | 2.82 | 2stars | ||
| 17561525-2823308 | 32 | 12000 | 4:46:51 | 7.08 | 3.76 | |||
| 17562427-2838087 | 32 | 14000 | 4:50:03 | 4.63 | 1.89 | |||
| 17564358-2836300 | 32 | 14000 | 4:59:08 | 4.68 | 1.42 | |||
| 17561378-2814082 | 32 | 12000 | 5:09:03 | 7.40 | 5.33 | |||
| 17571542-2833045 | 32 | 14000 | 5:13:41 | 5.49 | 1.72 | |||
| 17571303-2820270 | 32 | 14000 | 5:17:02 | 5.26 | 1.52 | |||
| 17574331-2824266 | 32 | 10000 | 5:27:23 | 6.54 | 2.93 | |||
| 17574443-2834137 | 32 | 14000 | 5:29:59 | 4.67 | 1.03 | |||
| 17575952-2825406 | 32 | 10000 | 5:34:46 | 4.50 | 2.05 | not seen | ||
| 17575012-2817035 | 32 | 8000 | 5:37:30 | 6.00 | 1.63 | |||
| 17574095-2814006 | 32 | 14000 | 5:39:31 | 5.92 | 2.21 | |||
| 17580636-2815241 | 32 | 12000 | 5:46:38 | 4.00 | 1.56 | |||
| 17580464-2812540 | 32 | 10000 | 5:50:45 | 5.58 | 1.76 | |||
| 17582187-2814522 | 32 | 14000 | 5:53:36 | 6.70 | 3.82 | ESO 456-27 | ||
| 17583142-2836286 | 32 | 8000 | 6:00:03 | 5.79 | 2.10 | |||
| 17585341-2830471 | 32 | 12000 | 6:02:18 | 5.05 | 2.25 | |||
| 17584071-2812242 | 32 | 10000 | 6:05:00 | 4.05 | 1.62 | |||
| 17590610-2831173 | 32 | 8000 | 6:09:16 | 5.73 | 1.65 | |||
| 17591309-2816398 | 32 | 14000 | 6:11:59 | 6.90 | 3.66 | |||
| 17590415-2809075 | 32 | 14000 | 6:20:08 | 6.07 | 2.23 | |||
| 17595541-2809020 | 32 | 12000 | 6:37:48 | 5.20 | 1.41 | |||
| 18002089-2813370 | 32 | 14000 | 6:41:34 | 4.87 | 1.71 | |||
| 18004499-2823118 | 32 | 14000 | 6:49:39 | 3.92 | 1.59 | |||
| 18010461-2826442 | 32 | 10000 | 7:01:42 | 6.82 | 3.98 | piq | ||
Frame is the size of the subwindow and NDIT the number of frames used in the raw burst mode. The number of frames in the reformatted FITS cube is NDIT/2-1, and this also determines the total time span of the recorded data. In the notes, piq stands for poor image quality and soc for slightly off center. Sometimes 2 stars were present in the field of view, but only one was occulted.