X-ray selected AGN in groups at redshifts
Abstract
We explore the role of the group environment in the evolution of AGN at the redshift interval , by combining deep Chandra observations with extensive optical spectroscopy from the All-wavelength Extended Groth strip International Survey (AEGIS). The sample consists of 3902 optical sources and 71 X-ray AGN. Compared to the overall optically selected galaxy population, X-ray AGN are more frequently found in groups at the 99% confidence level. This is partly because AGN are hosted by red luminous galaxies, which are known to reside, on average, in dense environments. Relative to these sources, the excess of X-ray AGN in groups is significant at the 91% level only. Restricting the sample to and mag in order to control systematics we find that X-ray AGN represent and % of the optical galaxy population in groups and in the field respectively. These numbers are consistent with the AGN fraction in low redshift clusters, groups and the field. The results above, although affected by small number statistics, suggest that X-ray AGN are spread over a range of environments, from groups to the field, once the properties of their hosts (e.g. colour, luminosity) are accounted for. There is also tentative evidence, significant at the 98% level, that the field produces more X-ray luminous AGN compared to groups, extending similar results at low redshift to . This trend may be because of either cold gas availability or the nature of the interactions occurring in the denser group environment (i.e. prolonged tidal encounters).
keywords:
Surveys – galaxies: active – galaxies: structure – cosmology: large scale structure of the Universe1 Introduction
The environment of Active Galactic Nuclei (AGN) holds important clues on the physical mechanism(s) responsible for the accretion of material on the central supermassive black hole (SBH). Numerical simulations have shown that an efficient way of channeling gas to the nuclear galaxy regions and in the vicinity of the SBH are galaxy interactions and mergers (e.g. Barnes & Hernquist 1992; Mihos & Hernquist 1996). As a result, many models for the formation and the cosmological evolution of AGN assume that the main growth phase of the central SBH in galaxies occurs in major mergers (e.g. Kauffmann & Haehnelt 2000; Di Matteo, Springel & Hernquist; Hopkins et al. 2005; Bower et al. 2006; Croton et al. 2006). Recent observations of the local environment of luminous QSOs supports this scenario. The excess of optical neighbours around QSOs on small scales ( Mpc) compared to galaxies (Serber et al. 2006) and the higher fraction of QSO pairs with separations Mpc compared to the expectation from large scales ( Mpc; Hennawi et al. 2006; Myers et al. 2007), both suggest that galaxy interactions may play an important role in the evolution of QSOs. This does not appear to be the case however, for the more common but less powerful narrow-line AGN (Seyfert, Low Ionization Nuclear Emission Line Regions – LINERs) selected in the Sloan Digital Sky Survey (SDSS) at . The small scale environment of these sources (0.1 Mpc) suggests that galaxy interactions alone cannot explain the observed activity in the bulk of this population (Li et al. 2006). Modeling work indeed predicts that low luminosity AGN, such as Seyferts and LINERs, may accrete cold gas stochastically by mechanisms such as bar instabilities or tidal disruptions rather than major interactions or mergers (Hopkins & Hernquist 2006).
On scales much larger than 0.5 Mpc, the clustering of AGN measures the mass of their host dark matter halo and how it relates to the observed nuclear activity. At these scales, an increasing body of evidence underlines the potential significance in the evolution of AGN of the group environment. Early studies for example, have shown that low redshift luminous QSOs are associated with moderate enhancements in the distribution of galaxies and avoid rich clusters (Hartwick & Schade 1990; Bahcall & Chokshi 1991; Fisher et al. 1996; McLure & Dunlop 2001). Moreover, the evolution of the large scale clustering of broad line QSOs in the redshift range is consistent with a parent dark matter halo of almost constant mass in the range (Porciani et al. 2004; Croom et al. 2005; Hopkins et al. 2007; da Angela et al. 2007; Mountrichas et al. 2008; but see Coil et al. 2007), close to the threshold for galaxy groups ( for DEEP2 groups with velocity dispersion ; Coil et al 2006) The more common narrow emission-line AGN in the local Universe () are hosted by massive early-type galaxies (Kauffmann et al. 2003), which are known to be more clustered on Mpc-scales than the overall galaxy population (Zehavi et al. 2005). A luminosity dependence of the clustering has also been found, with the most luminous narrow-line AGN residing in lower density regions compared to less luminous ones (Kauffmann et al. 2004; Wake et al. 2004; Constantin & Vogeley 2006). Popesso & Biviano (2006) further showed that not only the luminosity but also the number of AGN is a strong function of local density. In a sample of low redshift clusters, they found that the fraction of narrow-line AGN anti-correlates with cluster velocity dispersion, increasing toward galaxy groups.
At higher redshift, , X-ray surveys provide the most efficient and least biased way of finding active SBH to explore their demographics. The large scale structure of the X-ray selected AGN at is usually determined using the angular or the spatial auto-correlation functions (e.g. Yang et al. 2004; Basilakos et al. 2004, 2005; Gilli et al. 2005; Miyaji et al. 2007). Although there is substantial scatter in the results from these studies, largely because of observational uncertainties (Miyaji et al. 2007) or luminosity dependent clustering (Plionis et al. 2007), the general consensus is that X-ray selected AGN are hosted by dark matter haloes with mass of about (Miyaji et al. 2007), i.e. in the range expected for galaxy groups (e.g. Zandivarez, Merchan, & Padilla 2003).
Why AGN show a preference for the group scale environment is still unclear. One possibility is that galaxy interactions, which are believed to be one of the AGN triggers, are suppressed in massive clusters, while they proceed more efficiently in the lower velocity dispersion groups of galaxies. Alternatively, it might be that the necessary ingredients for AGN activity, sufficient cold gas supplies and a SBH, are often found in moderate density environments. More massive galaxies, which are likely to host larger black holes (e.g. Ferrarese & Merritt 2000; Gebhardt et al. 2000), are associated with high density regions (e.g. Hogg et al. 2003; Cooper et al. 2006). Moreover, cold gas, the fuel of AGN, is likely to be more abundant in moderate density environments, while it is depleted more efficiently in high density regions, such as clusters. Despite the potential significance of galaxy groups, there are still few studies that attempt to directly constrain the incidence of active SBHs in these moderate density environments. Shen et al. (2007) found that the fraction of AGN (both X-ray and optically selected) in a sample of eight poor groups at is consistent with that of clusters or the field (Martini et al. 2007). Although small number statistics are a issue in these studies, the finding above is against scenarios where the group environment promotes AGN activity, because of e.g. the higher efficiency of galaxy-galaxy mergers.
At higher redshift, , close to the peak of the AGN density in the Universe (e.g. Barger et al. 2005; Hasinger et al. 2005), there is still no information on the association between AGN and groups. This is mainly because it is hard to identify moderate overdensities at high redshift, as it requires large spectroscopic surveys of optically faint galaxies. The All-wavelength Extended Groth-strip International Survey (AEGIS; Davis et al. 2007) has extensive optical spectroscopy that can be used to identify groups at and deep Chandra observations, which provide the most efficient way for finding AGN, particularly at high redshift. In this paper we combine the AEGIS group and X-ray catalogues to explore the fraction of X-ray selected AGN associated with these overdensities. We adopt , and .
2 Data and sample selection
The X-ray data are from the Chandra survey of the AEGIS. The observations consist of 8 ACIS-I pointings, each with a total integration time of about 200 ks split in at least 3 shorter exposures obtained at different epochs. The data reduction, source detection and flux estimation are described in detail by Laird et al. (in preparation) and are based on methods presented by Nandra et al. (2005). The limiting flux in the 0.5-2 and 2-10 keV band are , , respectively. The X-ray catalogue comprises a total of 1318 sources over to a Poisson detection probability threshold of . For the optical identification we use the DEEP2 photometric catalogues and the Likelihood Ratio () method (e.g. Brusa et al. 2007; Laird et al. in prep.). In this paper optical counterparts are selected to have . For this cutoff, there are 857 optical identifications and the false counterpart rate is estimated to be 4.4 per cent.
The AEGIS is one of the four fields targeted by the DEEP2 redshift survey. This spectroscopic program uses the DEIMOS spectrograph (Faber et al. 2003) on the 10 m Keck-II telescope to obtain redshifts for galaxies to mag. The observational setup uses a moderately high resolution grating (), which provides a velocity accuracy of and a wavelength coverage of 6500–9100 Å. This spectral window allows the identification of the strong [O II] doublet 3727Å emission line to . We use DEEP2 galaxies with redshift determinations secure at the confidence level (quality flag ; Davis et al. 2007).
3 The Group Catalog
The AEGIS group catalogue has been constructed using the Voronoi-Delaunay group finding method described by Gerke et al. (2005). This algorithm has been optimised and tested for the typical DEEP2 redshift survey field, in which spectroscopic targets have been pre-selected based on their optical colour to limit the sample in the redshift interval . This is unlike the AEGIS field, for which no colour pre-selection has been applied for spectroscopic follow ups and the sampling rate of the galaxy population is higher than the rest of the DEEP2 survey fields. The Gerke et al. (2005) group finding method has been applied on the sub-sample of AEGIS galaxies that fulfill the DEEP2 spectroscopic survey selection criteria (i.e. colour pre-selection, sampling rate). This includes a total of 3902 optical sources in the redshift range , of which 1125 belong to groups, and 71 X-ray AGN over the same redshift interval.
Gerke et al. (2005) estimate that about 79 per cent of real group members are assigned to a group. The interloper fraction among group galaxies is 46 per cent, while the field sample is contaminated by group members at the 6 per cent level only. Correctly classified galaxies therefore dominate both the group and field populations. The group catalogue of Gerke et al. (2005) has been designed to reproduce the distribution of groups as a function of velocity dispersion, , and redshift, for . However, in this paper we are interested in the properties of group member galaxies i.e., the fraction of X-ray AGN in this population, rather than the group properties. Therefore the large number of groups with velocity dispersions lower than the limit above are also considered in the analysis. Although the uncertainty of the estimated is likely to be large, particularly at low velocity dispersions, because of the discrete sampling of the galaxy population, the group sample can still be used to explore in a statistical way the properties of the member galaxies. Groups with may suffer higher contamination (e.g. Gerke et al. 2007), but we nevertheless choose not to apply any velocity dispersion cutoff to the group catalogue used here. Our analysis guarantees that this has a minimal impact on the results. This is because the incidence of group galaxy members among X-ray sources is compared with that of the optically selected galaxies. Any contamination affecting low velocity dispersion groups cancels out in this differential test. By including all groups in the analysis we also improve the statistical reliability of the results. Nevertheless, restricting the group galaxy sample to those sources whose host groups have does not alter our conclusions. It is important to note that the groups identified here have moderate virial masses in the range , with very few groups having . Therefore the results presented here do not apply to clusters. In the next sections the group population is referred to those galaxies that have been identified as members of group. The remaining galaxies are the field population.
| Sample | |||
|---|---|---|---|
| () | |||
| (1) | (2) | (3) | (4) |
| X-ray sources | 71 | 30 | |
| optical galaxies | 3902 | 1125 | |
| optical galaxies (matched /)1 | – | – |
-
The columns are: (1): Sample definition; (2): is the total number of galaxies in the sample; (3): corresponds to the number of galaxies that are group members; (4): is defined . The errors for the first two rows are estimated assuming binomial statistics. For the third row see note below.
-
1The 3rd row corresponds to the sample of optical galaxies with and distributions matched to those of X-ray selected AGN. This sample is not unique and therefore and are not well defined quantities and are not listed. For that sample can only be estimated through the simulations described in the text. We list the median of the distribution determined from the trials described in the text. The errors correspond to the 16th and 84th percentile of the distribution, i.e. the 68% confidence level.
4 Results
4.1 Comparison of X-ray AGN with optically selected galaxies
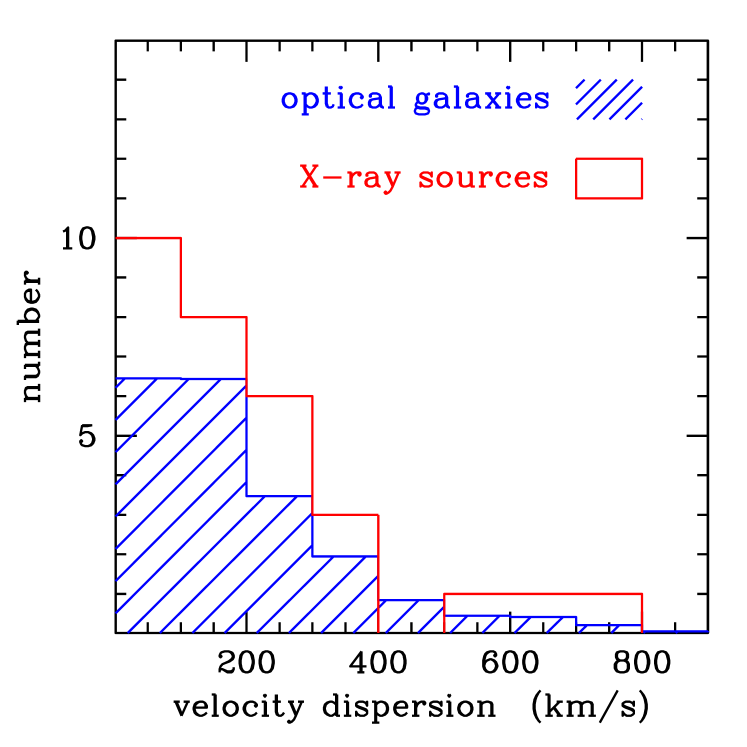
In Table 1 a large fraction of the X-ray selected AGN are found in groups, about 42 per cent (30/71). For comparison, the fraction of group members among optical galaxies is 29 per cent (1125/3902). The significance of the excess is assessed by randomly resampling with replacement the optical galaxy population to construct subsamples with size equal that of the X-ray source catalogue. In each trial the fraction of group galaxies is registered and the experiment is repeated 10 000 times. In this exercise, we first use the entire optical galaxy catalogue to draw random subsamples without applying an colour or optical luminosity cuts. In 99 per cent of the trials the number of group members is lower than the observed one for the X-ray AGN sample. Compared to the full optical galaxy population, the excess of X-ray AGN in groups at is therefore significant at the 99 per cent level, or in the case of a normal distribution. This excess is graphically shown in Figure 1. Selection effects introduced by e.g. the magnitude limit of the spectroscopic survey mag, or the group identification method, are affecting both the X-ray and the optical galaxy samples in the same way and hence cancel out in the differential test used here.
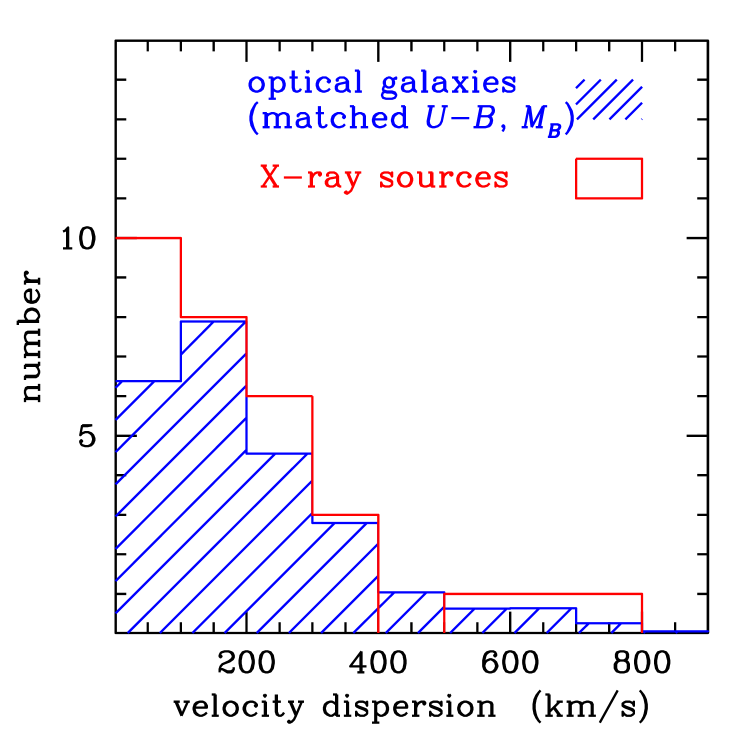
The environment of galaxies is a strong function of their optical colour and luminosity (e.g. Cooper et al. 2006; Gerke et al. 2007). X-ray selected AGN have been shown to be associated with red (Nandra et al. 2007) early-type (Pierce et al. 2007) galaxies, which are known to be more clustered than blue sources. This effect is accounted for by repeating the random resampling of the optical galaxy population, after matching in each trial the absolute magnitude, , and the rest-frame colour distributions of the optical galaxy subsample to that of X-ray sources using bin sizes of 1 mag and 0.5 mag respectively. The redshift distributions of the random subsamples and the X-ray AGN that are also statistically identical. This exercise shows that in 91 per cent of the trials the fraction of group galaxies is smaller than X-ray AGN, reducing the significance of the excess to about . The group fraction of the optical galaxy subsample with and distributions matched to those of X-ray sources is 33.8 per cent (see Table 1). In conclusion, the higher incidence of X-ray AGN in groups compared to optical galaxies at is to some level because they are hosted by red and luminous galaxies, which are known to reside in relatively dense regions (Cooper et al. 2006; Gerke et al. 2007).
Contamination of the optical light by emission from the AGN is an issue when matching the and of X-ray sources and optical galaxies. This effect is likely to be small however, and is unlikely to change the results presented here. The majority of X-ray sources in the sample have (Fig. 2), and therefore the central engine is not powerful enough to significantly affect the optical light of the host galaxy. For example Nandra et al. (2007) find only a weak trend between X-ray luminosity and for the AEGIS X-ray sources, suggesting that the optical light of these systems is dominated by the galaxy. Nevertheless, AGN contamination means that the true colour (i.e. corrected for contamination) of some AGN hosts is redder than observed. As the fraction of galaxies in groups increases with colour (Gerke et al. 2007), it is expected that any differences in the group fraction between X-ray AGN and optical galaxies will be smaller than what is estimated above (e.g. 91 per cent) once the true (i.e. corrected for AGN contamination) and of the two populations are matched.
4.2 AGN fraction: groups vs field
The results of the previous section also indicate that the fraction of X-ray AGN relative to optical galaxies (with matched /) in groups and in the field differ at the 91 per cent confidence level only. Any differences in the AGN fraction between the field and the group galaxy populations are not large enough to be detected at a high significance level in the sample presented in this paper.
The resampling technique of the previous section is useful for exploring differences in the fraction of AGN in groups relative to the field but cannot be used to estimate these fractions in absolute terms. Next, we address this issue to allow comparison with previous studies at lower redshift. For this exercise any observational biases need to be taken into account explicitly by applying appropriate cuts to the galaxy and AGN samples. The disadvantage of this approach is that the sample size is reduced drastically (see below), thereby increasing the statistical errors of individual measurements.
Firstly, the magnitude limit of the DEEP2 spectroscopic survey, mag, introduces colour dependent incompleteness in the sample. Galaxies with intrinsically red colours, which are on average more clustered, drop below the survey limit at lower redshifts than intrinsically bluer galaxies, which are frequently found in lower density regions. This effect becomes increasingly severe at , as the -band straddles the rest-frame UV. Before comparing the fraction of AGN in groups and in the field, it is essential to account for this effect by defining samples that are complete for both blue and red galaxies. For this exercise we select galaxies with and mag. These cuts result in a sample that is free from colour dependent biases (Gerke et al. 2007). The second selection effect is related to the fact that optically faint group members may drop out of the spectroscopic sample at higher redshift. As a result a group with certain properties, such as number and optical luminosity of members, may be missed by the algorithm at higher although it can be identified at lower . To avoid this bias, we follow Gerke et al. (2007) and redefine the group sample to be only those galaxies that reside in groups with two or more members brighter than mag. In that way the group sample is uniform, in terms of sensitivity to groups of certain properties, across the redshift range of the sample. For this new sample we find that the fractions of X-ray AGN in groups and in the field are per cent (8/168) and per cent (19/425) respectively, with the errors estimated using binomial statistics. The fractions above are consistent within the uncertainties. X-ray AGN are therefore found in diverse environments, from groups to the field. Therefore, the group environment does not appear to promote AGN activity more than the field, once the properties (e.g. ) of the population of potential AGN hosts are accounted for.
The small size of the sample is an issue however, and may drown subtle differences in the AGN fraction between groups and the field. Assuming that the true AGN fraction is higher than the observed one, we estimate that the binomial probability of observing exactly 8 AGN in groups is less than per cent for a true group AGN fraction of per cent. In other words, the sample size used here can only put an upper limit of about 10 per cent (99.7 per cent confidence level) in the true fraction of AGN in groups. Finally, we note in passing that our estimate of the fraction of AGN in groups at (4.7 per cent, mag) is similar to that observed in low redshift clusters (Martini et al. 2007; 5 per cent, mag) and groups (Shen et al. 2007; 7 per cent, mag) at a similar optical luminosity limit.
4.3 AGN X-ray luminosity distribution: groups vs field
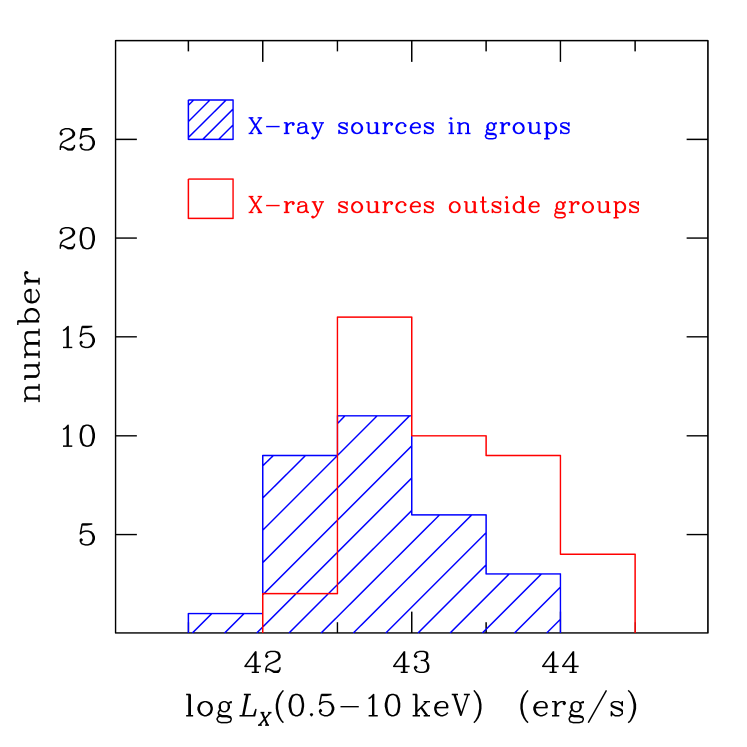
Figure 2 compares the X-ray luminosity distributions of AGN in groups with those in the field. The latter population is offset to higher X-ray luminosities. A Kolmogorov-Smirnov (K-S) tests shows that the likelihood of the observed differences, if the two populations were drawn from the same parent sample, is . However, this may be a selection effect related to the group finding algorithm. For example, group galaxies with given optical absolute magnitudes may be identified as members at low redshift, but at higher redshift some of them may become fainter than the spectroscopic magnitude limit of the AEGIS survey, mag. In this case the group may not be identified by the algorithm at higher redshift. One way to account for this bias is to adopt the redshift and optical luminosity cuts of the previous section. This approach however, also significantly reduces the sample size and increases the random errors. Instead, we use the full sample and account for redshift dependent selection effects using the random resamples of the optical galaxy population, after matching their absolute magnitude and optical colour distributions to that of X-ray sources. Each galaxy in individual subsamples is assigned an X-ray flux, drawn randomly and without replacement from the observed fluxes of the AEGIS X-ray sources. This results in subsamples with the same flux distribution as X-ray AGN. The K-S test is then applied to the X-ray luminosities of the mock subsample to estimate the probability that group members and non-group members are drawn from the same parent population. It is found that for the mock catalogues the K-S likelihood of the observed differences in between group and non-group members, if the two populations were drawn from the same parent population, is larger than the observed one for X-ray AGN in 98 per cent of the trials. This is tentative evidence, significant at the 98 per cent level, that at X-ray selected AGN in groups are systematically less X-ray luminous compared to those in the field.
4.4 AGN host galaxy properties
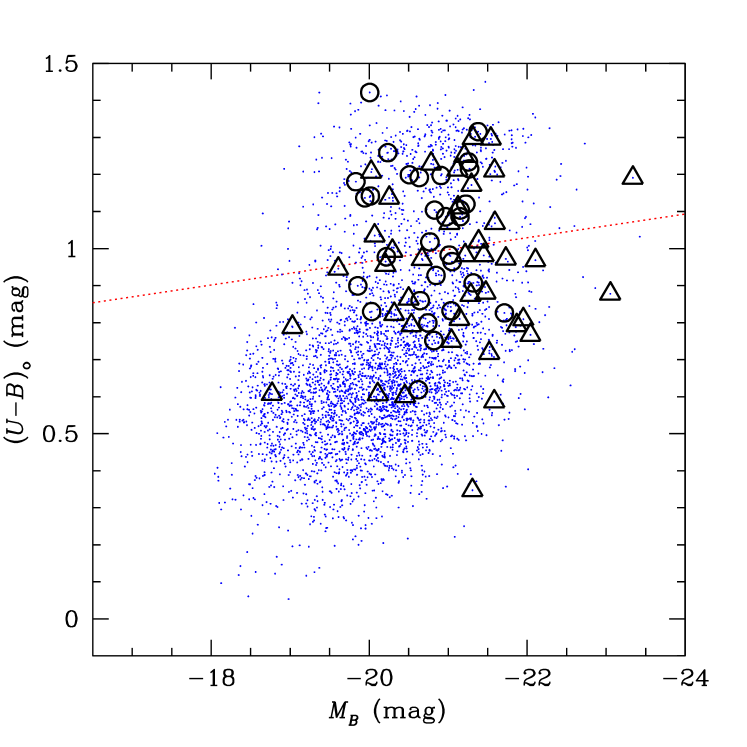
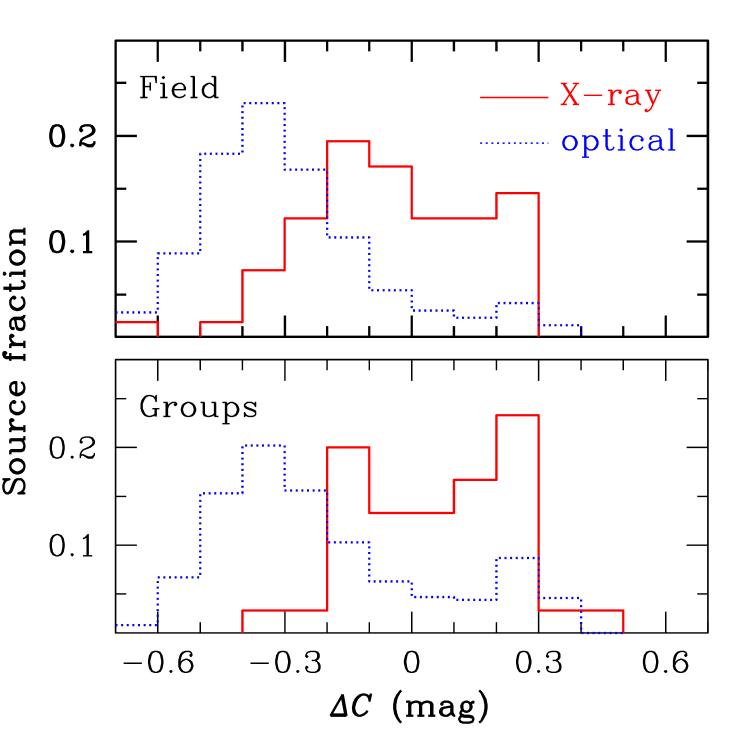
The colour-magnitude diagram is used to explore possibly differences in the host galaxy properties of AGN in groups and in the field. Figure 3 shows the distribution of the group and the field X-ray AGN in the vs colour-magnitude diagram. Optically luminous AGN ( mag) are systematically found in the field, in agreement with the results presented in the previous section. Nevertheless, both the field and the group AGN have similar distributions in the colour. This is further demonstrated using the parameter (Georgakakis et al. 2008), which is defined as the difference between the colour of the galaxy and the line separating the blue from the red clouds (Willmer et al. 2006). Figure 4 plots the distribution of the parameter for X-ray sources and optical galaxies in groups and in the field. In both these environments AGN have similar distributions and occupy the region of the colour magnitude space between the red and blue clouds (Nandra et al. 2007; Georgakakis et al. 2008). A Kolmogorov-Smirnov tests shows that the likelihood of the observed differences in the distributions if the field and the group AGN were drawn from the same parent population is 27 per cent. We conclude that there is no evidence for a difference in the rest-frame colour of AGN hosts in the field and in groups. This contrary to recent claims that AGN associated with the large scale structures in the Chandra Deep Field South (Gilli et al. 2003) are preferentially found in the valley between the blue and the red clouds of the colour-magnitude distribution of galaxies (Silverman et al. 2007).
5 Discussion
Using data from the AEGIS survey we explore, for the first time, the incidence of active SBHs in groups at high redshift, . X-ray selected AGN at this redshift are more frequently associated with groups compared to the overall optical galaxy population at the 99 per cent confidence level. This result is consistent with independent estimates of the large scale distribution of X-ray AGN at using either the auto-correlation function (e.g. Miyaji et al. 2007), measurements of the local density in the vicinity of X-ray sources (Georgakakis et al. 2007), or the cross-correlation function with optical galaxies (Coil et al. 2008 in prep.). These studies find that the typical environment of X-ray sources at is similar to or possibly even denser than that of early-type galaxies, which are known to be more clustered than the overall galaxy population (e.g. Coil et al. 2008). Given that X-ray AGN at are hosted mostly by red early-type galaxies (Pierce et al. 2007; Nandra et al. 2007), it is not surprising that they are preferentially found in high density regions. After accounting for the colour and optical luminosity distribution of X-ray AGN hosts, it is found that the excess of AGN in groups compared to galaxies of similar intrinsic optical properties is significant at the 91 per cent only. This is consistent with the work of Georgakakis et al. (2007) who found no statistically significant environmental differences between X-ray AGN and galaxies of similar rest-frame optical colour and luminosity. Low redshift studies also report similar results. At , the environment of narrow optical emission line AGN on large scales is almost the same as that of non-AGN with similar host galaxy properties (Li et al. 2006).
Another way of presenting the results above is that once the properties of AGN hosts are accounted for, the group and the field environment at are different at the 91 per cent confidence level in the fraction of X-ray AGN relative to galaxies. Although the small number of sources is a problem, this result suggests a range of environments for X-ray AGN at . At low redshift, there is also no strong evidence for a significant variation in the fraction of AGN relative to galaxies at different environments. Popesso & Biviano (2006) showed that the fraction of optically selected narrow emission-line AGN in low redshift clusters anticorrelates with the velocity dispersion and becomes consistent with the field value for densities similar to or below those of groups and poor clusters. Martini et al. (2006, 2007) however, argue that optical AGN selection methods are missing a substantial fraction of AGN in clusters, which can be identified by X-ray observations. These authors argue that when the X-ray AGN are taken into account, there are no strong differences between the field and clusters either. Shen et al. (2007) using a small sample of groups at found that the fraction of both optically and X-ray selected AGN is consistent with the fraction of X-ray AGN in clusters (e.g. Martini et al. 2007). Although the studies above are still limited by small number statistics, that may drown weak trends, and also by inhomogeneous AGN selection criteria (i.e. X-ray vs optical narrow emission-lines), they suggest that AGN activity does not strongly depend on local density. Therefore, the mechanism(s) responsible for triggering the accretion on SBHs operate nearly equally efficiently, in terms of AGN numbers, in groups, the field and possibly in clusters. It is the preference of AGN for luminous/red hosts that makes them appear more clustered than the overall galaxy population. Recent simulations also suggest diverse environments for AGN. Colberg & Di Matteo (2008) showed that the most massive and active SBHs at are in groups, albeit with significant scatter, while less massive/active SBHs span a wide range of local densities, from groups to the field. The X-ray AGN sample used here is likely to include systems with a wide range of BH masses and accretion rates (e.g. Bundy et al. 2008). It is therefore not surprising that we find similar fractions of AGN in groups and in the field.
Although the fraction of AGN at different environments is comparable, there is tentative evidence, significant at 98 per cent level, that the field can produce more powerful AGN compared to groups. Coil et al. (2007) also found that luminous broad-line QSOs are clustered like blue galaxies suggesting low density environments for these systems. The results above are at odds with the simulations of Colberg & Di Matteo (2008) at and with recent observations which suggest that the clustering of X-ray selected AGN at increases with X-ray luminosity (Plionis et al. 2008). This discrepancy underlines the need to further explore the dependence of AGN clustering on luminosity. Interestingly however, low redshift studies are consistent with our finding. Low luminosity AGN (e.g. LINERs) are more clustered than the overall AGN population at (Wake et al. 2004; Constantin & Vogeley 2006). Kauffmann et al. (2003) also found a strong environmental dependence of the fraction of luminous () optically selected (narrow-line) AGN at . The incidence of such objects increases with decreasing local density, from clusters to the field. Popesso & Biviano (2006) found a similar trend for the mean equivalent width of the [O II] 3727 emission line of AGN in low redshift clusters. Active SBHs with higher equivalent widths of [O II] 3727 reside, on average, in lower velocity dispersion clusters. Although the Popesso & Biviano (2006) sample does not include very low density environments, such as small groups or the field, extrapolation of their best-fit relations below , implies that the fraction of luminous AGN will continue to increase with decreasing density. An anti-correlation between AGN luminosity and local density at , if confirmed with a larger sample, may be related to either gas availability (i.e. galaxies in groups have less fuel to feed the supermassive black hole), or the nature of the gravitational interactions in groups (i.e. prolonged tidal disruptions, minor mergers), or a combination of the two.
In addition to possible differences in the X-ray luminosity and the number of AGN, we also explore evidence that the host galaxy properties of active SBH in groups and in the field are distinct. Silverman et al. (2007) for example, found that the fraction X-ray AGN in the valley between the blue and the red clouds of the colour-magnitude diagram increases in the large scale structures of the Chandra Deep Field South, identified by the redshift spikes at and in that field (Gilli et al. 2003). Figure 4 shows that AGN host galaxies in the field and in groups have similar distributions in the colour-magnitude diagram. Both these populations are associated with galaxies in the valley between the blue and the red clouds. The data does not support an association of AGN host galaxy colour and large scale structures like that found by Silverman et al. (2007). We note however, that the “wall” or “sheet” structures in the Chandra Deep Field South, identified as spikes in the redshift distribution, are likely to be significantly different in terms of spatial extent and virialisation state, compared to the groups studied here.
6 Conclusions
In conclusion, it is found that at , AGN are more frequently found in groups compared to the overall optically selected galaxy population at the 99 per cent confidence level. This excess is to some level because X-ray AGN are associated with red and luminous galaxies which are known to be more clustered than the overall galaxy population. After taking into account the AGN host galaxy properties the significance of the excess of AGN in groups drops to 91 per cent. This suggests that X-ray AGN live in a range of environments and that groups do not produce more AGN than the field, once their host galaxy properties are factored in the analysis. There is tentative evidence that AGN in the field are more powerful, on average, than their group counterparts, extending similar results at low redshift to . This can be attributed to differences in the gas content of group/field galaxies and/or the nature of interactions in these environments.
Although the results presented here are affected by small number statistics, it is the first time that an attempt is made to explore the relation between SBH accretion and optically identified groups at . There are two obvious ways to improve the reliability of our conclusions. Either perform deep X-ray observations in fields with extensive optical spectroscopy, like those surveyed by the DEEP2 project, or complement existing deep X-ray surveys (e.g. COSMOS, Chandra Deep Fields) with optical spectroscopy of similar quality and extent to the DEEP2 spectroscopic survey.
7 Acknowledgments
The authors wish to thank the anonymous referee for providing constructive comments and suggestions that significantly improved this paper. This work has been supported by funding from the Marie-Curie Fellowship grant MEIF-CT-2005-025108 (AG) and STFC (ESL). BFG is supported by the U.S. Department of Energy under contract number DE-AC02-76SF00515. ALC is supported by NASA through Hubble Fellowship grant HF-01182.01-A, awarded by the Space Telescope Science Institute, which is operated by the Association of Universities for Research in Astronomy, Inc., for NASA, under contract NAS 5-26555.
References
- [1] Bahcall N. A.; Chokshi A., 1991, ApJ, 380L, 9
- [2] Barger A. J., et al., 2005, AJ, 129, 578
- [3] Barnes J. E., Hernquist L., 1992, ARA&A, 30, 705
- [4] Basilakos S., Plionis M., Georgakakis A., Georgantopoulos I., 2005, MNRAS, 356, 183
- [5] Basilakos S., Georgakakis A., Plionis M., Georgantopoulos I., 2004, ApJ, 607L, 79
- [6] Bower R. G., Benson A. J., Malbon R., Helly J. C., Frenk C. S., Baugh C. M., Cole S., Lacey C. G., 2006, MNRAS, 370, 645
- [7] Brusa M., et al., ApJS, 2007, ApJS, 172, 353
- [8] Bundy K., et al., 2008, ApJ, in press, arXiv0710.2105
- [9] Ciotti L., & Ostriker J. P., 2001, ApJ, 551, 131
- [10] Coil A. L., et al., 2008, ApJ, 672, 153
- [11] Coil A. L., Hennawi J. F., Newman J. A., Cooper M. C., Davis M., 2007, ApJ, 654, 115
- [12] Coil A. L., et al., 2006, ApJ, 638, 668
- [13] Colberg J. M. & Di Matteo T., 2008, MNRAS, accepted, arXiv0804.1756
- [14] Constantin A. & Vogeley M. S., 2006, ApJ, 650, 727
- [15] Cooper M. C., et al., 2006, MNRAS, 370, 198
- [16] Cooper M. C., Newman J. A., Madgwick D. S., Gerke, B. F., Yan R., Davis M., 2005, ApJ, 634, 833
- [17] Croom S. M., et al., 2005, MNRAS, 356, 415
- [18] Croton D. J, et al., 2006, MNRAS, 365, 11
- [19] da Ângela, J. et al., 2008, MNRAS, 383, 565
- [20] Davis M., et al., 2007, ApJ, 660, 1L
- [21] Di Matteo T., Springel V., Hernquist L., 2005, Nature, 433, 604
- [22] Faber et al. 2003, SPIE, 4841, 1657
- [23] Ferrarese L., Merritt D., 2000, ApJ, 539, L9
- [24] Fisher K. B., Bahcall J. N., Kirhakos S., Schneider D. P., 1996, ApJ, 468, 469
- [25] Gebhardt K., et al., 2000, ApJ, 539, L13
- [26] Georgakakis A., et al., 2008, MNRAS, in press, arXiv0801.2160
- [27] Georgakakis A., et al., 2007, ApJ, 660L, 15
- [28] Gerke B. F., et al., 2007, MNRAS, 376, 1425
- [29] Gerke B. F., et al., 2005, ApJ, 625, 6
- [30] Gilli R., et al., 2005, A&A, 430, 811
- [31] Gilli R., et al., 2003, ApJ, 592, 721
- [32] Hartwick F. D. A., Schade D., 1990, ARA&A, 28, 437
- [33] Hasinger G., Miyaji T., Schmidt M., 2005, A&A, 441, 417
- [34] Hennawi J. F., 2006, AJ, 131, 1
- [35] Hogg D. W. et al., 2003, ApJ, 585, L5
- [36] Hopkins P. F., Lidz A., Hernquist L., Coil A. L., Myers A. D., Cox T. J., Spergel D. N., 2007, ApJ, 662, 110
- [37] Hopkins P. F., Hernquist L., 2006, ApJS, 166, 1
- [38] Hopkins P. F., Hernquist L., Cox T. J., Di Matteo T., Martini P., Robertson B., Springel V., 2005, ApJ, 630, 705
- [39] Kauffmann G., et al., 2004, MNRAS, 353, 713
- [40] Kauffmann G., et al., 2003, MNRAS, 346, 1055
- [41] Kauffmann G. & Haehnelt M., 2000, MNRAS, 311, 576
- [42] Li C., Kauffmann G., Wang L., White S. D. M., Heckman T. M., Jing Y. P., 2006, MNRAS, 373, 457
- [43] Magorrian J., et al., 1998, AJ, 115, 2285
- [44] Martini P., Mulchaey J. S., Kelson D. D., 2007, ApJ, 664, 761
- [45] Martini P., Kelson D. D., Kim E., Mulchaey J. S., Athey A. A., 2006, ApJ, 644, 116
- [46] McLure R. J., Dunlop J. S., 2001, MNRAS, 321, 515
- [47] Mihos J. C. & Hernquist L., 1996, ApJ, 464, 641
- [48] Miller C. J., Nichol R. C., Gómez P. L., Hopkins A. M., Bernardi M., 2003, 597, 142
- [49] Miyaji T., et al., 2007, ApJS, 172, 396
- [50] Mountrichas G., Shanks T., Croom S. M., Sawangwit U., Schneider D. P., Myers A. D., Pimbblet K., 2008, arXiv0801.1816
- [51] Myers A. D., Brunner R. J., Richards G. T., Nichol R. C., Schneider D. P., Bahcall N. A., 2007 ,ApJ, 658, 99
- [52] Nandra K., et al., 2007, ApJ, 660, 11L
- [53] Nandra K., et al., 2005, MNRAS, 356, 568
- [54] Pierce C. M., et al., 2007, ApJ, 660, 19L
- [55] Plionis M., Rovilos M., Basilakos S., Georgantopoulos I., Bauer F., 2008, ApJL, accepted, arXiv0712.3072
- [56] Popesso P. & Biviano A., 2006, A&A, 460L, 23
- [57] Porciani C., Magliocchetti M., Norberg P., 2004, MNRAS, 355, 1010
- [58] Serber W., Bahcall N., Ménard B., Richards G., 2006, ApJ, 643, 68
- [59] Silverman J. D., et al., 2007, ApJ, in press, arXiv0709.3455
- [60] Shen Y., Mulchaey J. S., Raychaudhury S., Rasmussen J., Ponman T. J., 2007, ApJ, 654L, 115
- [61] Wake D. A., 2004, ApJ, 610L, 85
- [62] Willmer C. N. A., et al., 2006, ApJ, 647, 853
- [63] Yang Y., Mushotzky R. F., Steffen A. T., Barger A. J., Cowie L. L., 2004, AJ, 128, 1501
- [64] Zandivarez A., Martínez H. J., Merchán M. E., 2006, ApJ, 650, 137
- [65] Zehavi I., et al., 2005, ApJ, 630, 1