The jet of Markarian 501 from millions of Schwarzschild radii down to a few hundreds.
Abstract
Aims. The TeV BL Lac object Markarian 501 is a complex, core dominated radio source, with a one sided, twisting jet on parsec scales. In the present work, we attempt to extend our understanding of the source physics to regions of the radio jet which have not been accessed before.
Methods. We present new observations of Mrk 501 at 1.4 and 86 GHz. The 1.4 GHz data were obtained using the Very Large Array (VLA) and High Sensitivity Array (HSA) in November 2004, in full polarization, with a final r.m.s. noise of Jy/beam in the HSA total intensity image; the 86 GHz observations were performed in October 2005 with the Global Millimeter VLBI Array (GMVA), providing an angular resolution as good as .
Results. The sensitivity and resolution provided by the HSA make it possible to detect the jet up to 700 milliarcseconds (corresponding to a projected linear size of 500 pc) from its base, while the superior resolution of the 86 GHz GMVA observations probes the innermost regions of the jet down to 200 Schwarzschild radii. The brightness temperature at the jet base is in excess of K. We find evidence of limb brightening on physical scales from pc to pc. Polarization images and fits to the trend of jet width and brightness vs. distance from the core reveal a magnetic field parallel to the jet axis.
Key Words.:
galaxies: active - galaxies: nuclei - galaxies: jets - BL Lacertae objects: individual: Markarian 5011 INTRODUCTION
The study of extragalactic radio jets is an important area in astrophysics. In radio loud sources, jets contribute a large fraction of the total radiated power, and sustain the formation of energetic kiloparsec scale lobes. While observational properties of jets are widely differentiated, they are present in high and low power sources, with some common features; on the parsec scale, they are relativistic in both types and they are also intrinsically identical in beamed and misaligned sources. Giovannini et al. (2001) have shown that the Lorentz factor in the parsec scale jet of low power FRI radio galaxies as well as of more powerful FR IIs are both in the range . With these values, jets also appear intrinsically identical in beamed (BL Lac objects) and misaligned sources (FRI radio galaxies), if the former have jet axis oriented at an average viewing angle of (Giroletti et al. 2004b).
In the present paper we focus on the jet structure of the BL Lac source Markarian 501. This object is highly active and well-studied at all frequencies. Its activity and variability at high energy (as high as TeV regime, Quinn et al. 1996) seems to require high Doppler factors and consequently a small angle to the line of sight. In the radio band, centimeter VLBI observations have revealed a clear limb-brightened structure, beginning in the very inner jet, suggestive of a dual velocity structure (Giroletti et al. 2004a, hereinafter G04). The complex limb-brightened structure makes component identification problematic and multi-epoch attempts to measure pattern speed conclude that it is not well defined (G04) or in any case at most subluminal (Edwards & Piner 2002). These seem to be common features in TeV blazars (Piner & Edwards 2004; Giroletti et al. 2006), and theoretical models have been proposed to reconcile them with the very high energy emission (Ghisellini et al. 2005; Wang et al. 2004).
However, the results obtained so far still leave some major questions unanswered. For example, it is not at all clear whether the jet velocity structure is intrinsic or produced by the interaction with the surrounding medium. We want to understand why the properties of the radio jet on parsec scales are different from those needed to explain the ray emission in Mrk 501, as well as in other TeV blazars. Moreover, a change in regime must occur on much larger scales, since the large scale structure of the source is known to be symmetric rather than one-sided (e.g., Ulvestad et al. 1983). We want to investigate if this transition is smooth and what is the configuration of the magnetic field in the outer jet, which needs sensitive images in total intensity and polarization.
In order to search for an answer to such questions, we need to go beyond the capability of the instruments available for ordinary centimeter wavelength VLBI, which provides information only for the region between and milliarcseconds. Smaller and larger scale regions remain inaccessible because of inadequate resolution and sensitivity, respectively.
Improvements in the technical and organizational issues are now offering to astronomers VLBI arrays of unprecedented resolution and sensitivity, such as the High Sensitivity Array (HSA111http://www.nrao.edu/hsa/), and the Global mm-VLBI Array (GMVA222http://www.mpifr-bonn.mpg.de/div/vlbi/globalmm/). Thanks to its proximity and brightness, Mrk 501 is an ideal laboratory for experiments using these advanced VLBI techniques: it is at (1 mas = 0.67 pc, using km s-1 Mpc-1); the total flux density at 5 GHz is Jy; the Schwarzschild radius for its central black hole is estimated around pc ( mas), if we adopt (Rieger & Mannheim 2003). Using these new facilities, we can therefore access regions never studied previously: the jet base with the GMVA, and the faint, resolved jet region at mas with HSA.
2 OBSERVATIONS
2.1 High Sensitivity Array observations
We observed Mrk 501 with the HSA at 1.4 GHz on 26 Nov 2004. The HSA is obtained by combining in the same array the 10 VLBA antennas and other sensitive elements, i.e. the Green Bank Telescope (GBT, 100 m.), the phased VLA ( m.), Arecibo (300 m.), and Effelsberg (100 m.). Even without Arecibo, whose declination limits do not allow it to observe Mrk 501, the collecting area is increased by a factor of 7 over the VLBA alone. The sensitivity was also improved thanks to a large recording rate (256 Mbps) and a long integration time (8 hrs). The Effelsberg telescope was in the experiment for the first 5 hrs; some failures affected SC, FD, MK, and the VLA during part of the observation.
We reduced the data in the standard way in AIPS, using 3C345 as a fringe finder, OQ208 as a leakage calibrator, and 3C286 for the EVPA calibration. Final images were produced both in AIPS and Difmap, with different weighting schemes. The source structure is complex, with a strong peak ( Jy) and significant diffuse emission ( Jy). Although this prevents us from reaching the thermal noise, we still achieve in our best image a dynamic range as good as 30,000:1, with a noise level of Jy beam-1 ().
During the HSA observations, the VLA (used as phased array) was in the A configuration. We obtained the internal VLA data and calibrated and reduced in the standard way to obtain also a VLA image of Mrk 501.

2.2 Global mm-VLBI observations
Millimeter VLBI permits a much higher angular resolution than ground or space based VLBI at centimeter wavelengths. Moreover, it offers the possibility to study emission regions which appear self-absorbed at longer wavelengths, with important consequences for our understanding of the physical processes in AGNs in the vicinity of supermassive black holes. After years of continuous development and technical improvement, the GMVA is now able to provide good quality images in the 3mm band, with an angular resolution of a few tens of micro-arcseconds (Krichbaum et al. 2006a).
We observed Mrk 501 on 14 Oct 2005 with the Global mm-VLBI Array. This experiment tested the sensitivity limits of the array, since on the basis of the observed centimeter wavelength flux density and spectral index (G04), Mrk 501 was expected to be only a few hundred mJy at this frequency.
The standard frequency was 86.198 GHz, with 16 IFs of 8 MHz bandwidth each, 2 bit sampling in left circular polarisation (LCP). The participating telescopes were Effelsberg, Pico Veleta, the Plateau de Bure interferometer, Onsala, Metsähovi, and 8 VLBA stations (i.e. all except Saint Croix and Hancock). The European telescopes observed for hours and the American ones joined in for the last hours (Mauna Kea only for the last hours); the telescopes at Metsähovi and North Liberty failed.
The calibrator 3C345 was readily detected with good signal-to-noise ratio. From the fringe fitting of 3C345 we determined rates and single-band delays, and applied them to the whole data set. We obtained an image of 3C345 and found it to be in agreement with published images of comparable or slightly lower resolution (Lobanov et al. 2000; Lister & Homan 2005). At this stage, it was then possible to fringe fit Mrk 501 itself, averaging over the IFs, using a solution interval as long as the scan, and setting a SNR threshold of 3.0. Mrk 501 was well detected not only between large European apertures but also on baselines to the smaller VLBA antennas. Solutions that were obviously bad were edited out using SNEDT, and the data were subsequently frequency averaged. Final self-calibration and imaging were done in Obit (Cotton 2008).
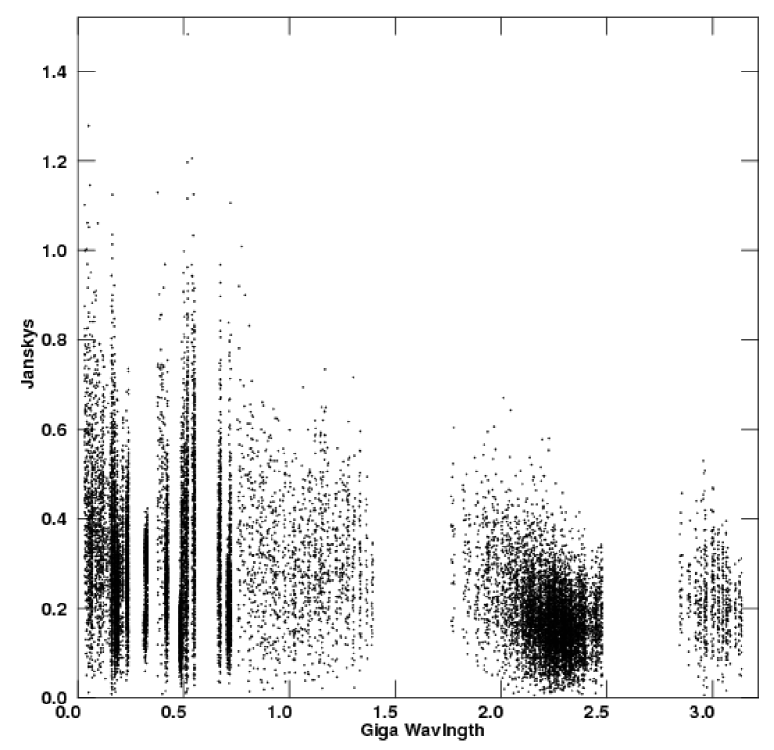
The final amplitude vs. distance plot is shown in Fig. 1. The coverage is good in the short baseline range and much sparser in the outer part of the plane. Due to the failure of the easternmost VLBA antenna, there is also a large gap in between the short and long baseline domains. A large baseline noise is visible; however, significant emission in the short baselines is clearly present. An image of the calibrator 3C345 and a spectral plot of the resulting phases vs. spectral channels for visibilities of Mrk 501 are shown in Giroletti & Giovannini (2006).
3 RESULTS
3.1 The kpc scale structure
On kiloparsec scales, Mrk 501 is core dominated with a two sided extended structure visible as well, extending in PA for more than 30″ on both sides of the core (Ulvestad et al. 1983; Kollgaard et al. 1992; Cassaro et al. 1999). It is straightforward to identify this structure with the symmetric extended emission characteristic of a radio galaxy and to infer an orientation near to the line of sight, in agreement with what is expected from a BL Lac source. However, the symmetric emission implies that at this distance from the core no relativistic jet remains.
Thanks to the VLA data available as a byproduct of the HSA observations, we obtained a higher resolution VLA image of Mrk 501 (see Fig. 2). The phased array image is dynamic range limited (), and it shows a one-sided emission with a short jet like structure in the same PA as the extended symmetric structure. From this one-sided emission we can derive constraints on the jet velocity () and orientation () with respect to the line of sight. At we have and at , . This result implies that at 0.67 kpc (projected) from the core the jet is still at least mildly relativistic ().
3.2 The extended jet
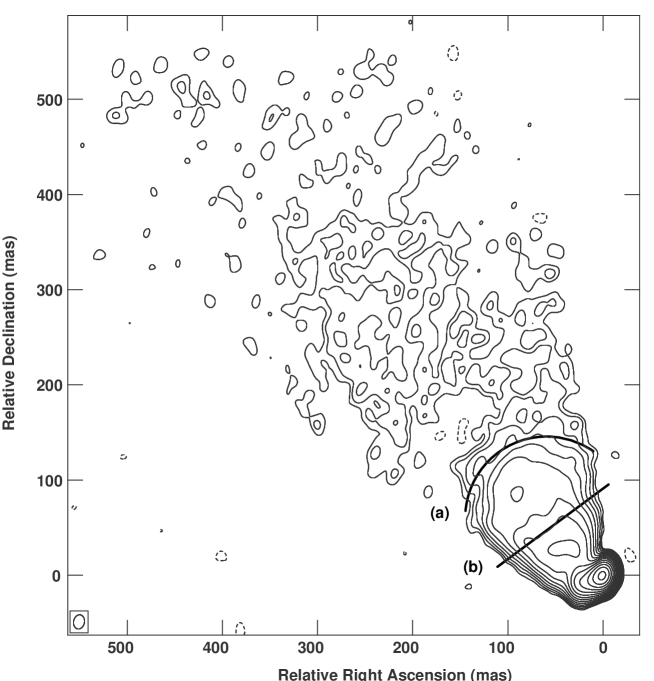
We obtain a detailed look at the jet of Mrk 501 from the deep VLBI observations with the HSA. We show in Fig. 3 a tapered image, where baselines longer than 18 M have been significantly down-weighted to increase the signal to noise ratio of the low-surface brightness emission. We achieve a r.m.s. of Jy beam-1 and emission is revealed on the main jet side up to a distance of mas from the core, i.e., five times further than detected in any previous VLBI observation. No emission is detected on the counter-jet side at the level of noise. In Table 1, we give at some selected distances (Col. 1) the jet brightness (Col. 2) and the corresponding lower limits to the jet/counter-jet brightness ratio (Col. 3). The minimum required velocity () and largest allowed viewing angles () are then reported in Cols. 4 and 5, respectively. The jet opening angle remains constant () after the well known bend at 30 mas.

| (mas) | (mJy beam-1) | (∘) | Notes | ||
|---|---|---|---|---|---|
| (1) | (2) | (3) | (4) | (5) | (6) |
| 12 | 180 | 7200 | 0.94 | 19 | Inner jet |
| 21 | 105 | 4200 | 0.93 | 21 | Jet bend |
| 62 | 21.4 | 856 | 0.87 | 29 | |
| 128 | 3.5 | 140 | 0.76 | 41 | |
| 284 | 0.26 | 10.4 | 0.44 | 64 | |
| 464 | 0.20 | 8.0 | 0.39 | 67 | |
| 706 | 0.12 | 5.0 | 0.31 | 72 | confused with noise |
The jet brightness shows a decrease with increasing jet distance from the core; the space distribution is quite uniform, i.e., no prominent knot is present in the extended jet. The most noteworthy features in Fig. 3 are the relatively sharp brightness decrease at mas (marked with ), which could correspond to a shock region, and the jet limb brightening across the slice at mas from the core (marked by ). The jet brightness profile across this slice is shown in Fig. 4 and, although less conspicuous, is similar to the structure visible in the inner jet in higher resolution images (G04).
Besides these features, the jet presents an uniformly distributed flux density. If we consider only the region above the noise level, 73.2% of the pixels in the image have a brightness between 75 and 300 Jy beam-1. Significant peaks are not present and local maxima can be related to small increases in the jet emissivity but also to artifacts brought about by the image reconstruction process. This seems to be a characteristic of the jet of Mrk 501 on all scales; even in the inner jet, images with high resolution (G04) tend to show a uniform brightness distribution rather than the compact knots observed in other AGN jets.
In G04, we modeled the jet intensity of Mrk 501 as a function of jet velocity and radius, using the formulas for an adiabatically expanding jet derived by Baum et al. (1997) in the case of relativistic motion. The most sensitive observations available in G04 allowed us to study the jet only to a distance of mas, still allowing for a degeneracy between magnetic field orientation and jet velocity. Thanks to the HSA data, we can now extend this argument to a distance of almost 500 mas.

We derived brightness profiles across the jet using the AIPS task SLICE on the tapered HSA image for the extended jet, obtaining one slice every 5 mas in PA. Using the AIPS task SLFIT, we fitted single Gaussian components to each profile. We show the resulting data as functions of the distance from the core in Fig. 5. The fit could be done unambiguously in most cases, although some slices presented some deviation from a pure single Gaussian profile. However, the difference between the area subtended by the profile and the fit is generally smaller than 5% and only a couple of fits (at mas from the core, marked by the larger error bars) had to be rejected. At a distance larger than mas from the core, the best fit FWHM starts decreasing; we ascribe this behavior to the insufficient brightness at the jet edges, and do not consider any slice at mas in our analysis. Moreover, we note that for the same reason – and because of the limb brightening of the jet – even at smaller distances the actual jet FWHM is in some cases larger than the best fit one. The implication of this effect are discussed below. In the inner jet ( mas), we keep the fit from G04, whose better resolution is important in this region where the jet is not transversely resolved in the present image. The best-fit peak brightness and jet FWHM have then been smoothed with a boxcar filter (50 mas wide, for points at mas) to suppress local noise.
3.3 The core and inner jet structure
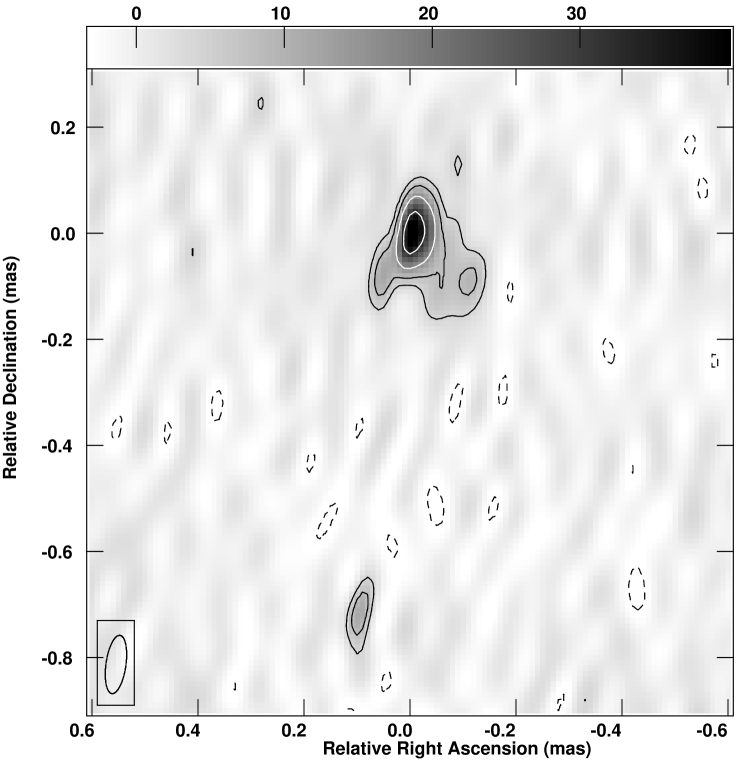
In Fig. 6, we show our Global mm-VLBI Array image of Mrk 501 at a resolution of 110 as as (beam FWHM, PA ). Mrk 501 is clearly detected at 3 mm and it is dominated by a compact, prominent component, mJy beam-1 peak brightness. The visibility data suggest that there is a fair amount of extended emission, although the coverage is not ideal and it is extremely difficult to image it.
In our clean image and with modelfitting, we recover mJy in the core region, including a jet-like feature in PA and some more diffuse emission in PA . A tentative jet knot () is also visible 0.73 mas south of the core (PA ). The features in the image plane can be described by model-fitting with four Gaussian components. These components are shown overlayed to the total intensity lowest contour in Fig. 7; each component is represented by a cross with major and minor axis equal to its FWHM, with the major axis aligned along the component’s position angle. Quantitative results from model fitting are reported in Table 2, where and are the polar coordinates of the component (re-referenced to the core position), , , and are the deconvolved major and minor axis of the component and its position angle, and the peak brightness and the total flux density.
Visibility model-fitting in Difmap provides a reduced with this model. The only quantity that has a significant uncertainty in the best-fit (around 10%) is the total flux density , while nominal errors on the component positions are typically much less than 10 as.
Since such values are unrealistically small, we have estimated independent uncertainties on taking into account two basic parameters for each component: (1) the peak flux density and (2) its compactness. In simple words, the uncertainty brought about by noise in the visibility data (i.e. scatter of the points) will affect faint diffuse components much more than bright compact ones. Therefore, we estimate the uncertainty on the position of each component using the following formula:
where is the image local noise; the formula is therefore related to the SNR of the component in such a way that the position of a feature is not known to better than its mean angular radius. The uncertainties reported in Col. (2) are calculated in this way and they have been added in quadrature to that on the core position (0.004 mas), which is taken as a reference.

| (mas) | (∘) | (mas) | (mas) | (∘) | (mJy | (mJy) |
| beam-1) | ||||||
| (1) | (2) | (3) | (4) | (5) | (6) | (7) |
| 0.00 | 0.0 | 0.032 | 169 | 40.2 | ||
| 135.6 | 0.181 | 0.078 | 27 | 9.7 | ||
| 144.4 | 175 | 11.4 | ||||
| 172.0 | 170 | 12.9 |
The brightest component, which we identify with the core visible at centimeter wavelengths, is still unresolved at 86 GHz. We then use our deconvolved size of this component to give an upper limit to the dimension of the jet base, and a lower limit to its brightness temperature. At , 1 mas = 0.67 pc, therefore the deconvolved angular size of the GMVA core corresponds to 0.021 0.032 pc. The black hole mass for Mrk 501 is estimated around (Rieger & Mannheim 2003), which implies a Schwarzschild radius parsecs. This means that the radio emission originates in a region that is smaller than 210 320 RS.
We derive the brightness temperature of this region from the following formula:
In our observations mm; moreover, to derive in MKS units, we calculate that 1 beam ster, where and are the major and minor semi-axis of the deconvolved component, in mas. Therefore:
i.e.,
With the values from Table 2, we find a brightness temperature for the core component . If we make the reasonable assumption that the size of the emitting region is actually smaller (e.g. 1/3 of the deconvolved size), we get . However, even under this assumption, the result requires a high but not extreme value of the Doppler factor at the base of the radio jet. In fact, this is not surprising, since the brightness temperature depends only on the physical length of the maximum baseline and on the observed brightness. Therefore, observations with similar array at a frequency near the spectral peak can yield higher .

We show in Fig. 8 a spectral plot for both the (average) total flux density on kiloparsec scale as measured by single dish telescopes, and for the VLBI core, including our new data point at 86 GHz. The spectrum of the VLBI core between 1.6 and 22 GHz has been presented in G04: the core has a turnover at about 8 GHz, and then the flux density falls as a power law of index . Our new data point follows the optically thin part of the core spectrum. Note that as 86 GHz flux density we do not just adopt the flux measure of the unresolved core in our image but we also include the jet like structure and the diffuse component discussed before; this is because observations at lower frequency do not have the angular resolution to distinguish the different components. This implies that the turnover frequency at GHz is related to the whole structure and not to the 86 GHz core, whose self-absorption peak is probably located at higher frequency.
We also plot in Fig. 8 (dashed line) the difference between the total single dish flux density and the VLBI core one. Apart from some fluctuations (due to variability and non simultaneous data), the extended emission from the kiloparsec scale jet and lobes region must substantially contribute to the flux density even at high frequency. Such extended emission has a rather flat spectrum, with index between 1.4 and 86 GHz, and fluctuations; this odd behavior is likely brought about as a consequence of variability of the core.
The detection of a possible jet knot at is in agreement with images at lower frequency. Comparing the GMVA data (Table 2) with modelfits at 15 and 22 GHz by Edwards & Piner (2002) and G04, the tentative jet knot can be identified with the region labelled as C4, which is found at the same distance and position angle. Edwards & Piner (2002) found this region to be apparently stationary between 1995 and 1999, and the positional coincidence lends support to this interpretation. At this resolution, the jet has therefore a still different orientation with respect to that seen at lower resolutions (see G04 and Sect. 3.2): the jet PA is at mas and at mas.
3.4 Polarization

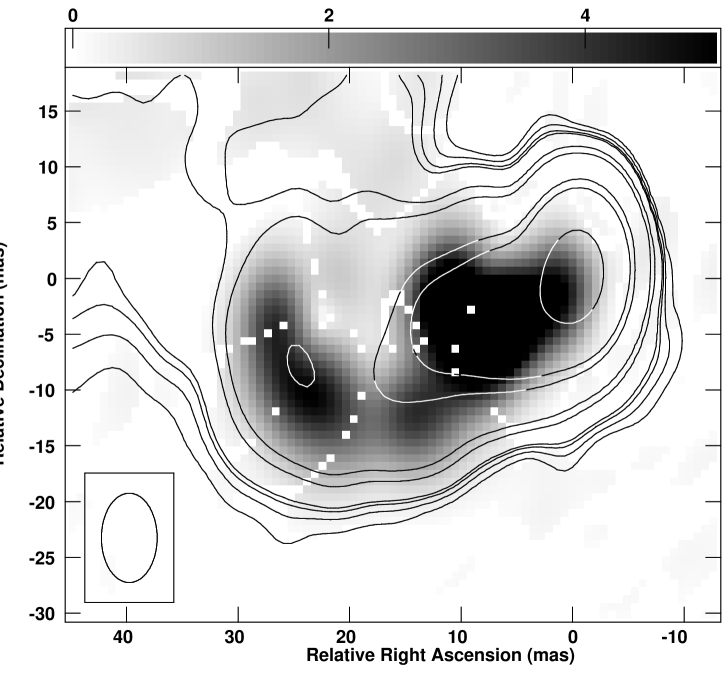
In polarized intensity, previous VLBI observations of Mrk 501 have revealed flux densities of a few milliJansky, i.e., a few percent of the total intensity (Pushkarev et al. 2005). Our new HSA observations confirm the presence of a significant fraction of polarized flux and reveal interesting details (see Figs. 9 and 10). The total flux density in polarization images is almost 100 mJy (98.7 mJy), with a peak of 18 mJy beam-1. We plot electric vector polarization angle sticks, assuming a Faraday rotation measure of 0 rad m-2.
In the inner 10 mas (Fig. 9), we have a large cone of polarized flux, with polarization vectors aligned with the jet direction. Further downstream, the polarized flux lies predominantly toward the southern edge of the jet, in a structure similar to the ‘spine–sheath’ detected in polarization by Pushkarev et al. (2005) and in total intensity by G04. At the large bending at 20 mas, we then find a knot of polarization and a rotation in the EVPA position angle. This suggests a strong interaction between the radio plasma and an external structure. This interaction could be the reason of the change in the source direction, which is further amplified by geometrical effects.
After the large bend (see Fig. 10), the polarization angle becomes well aligned with the jet again at mas from the core. At larger distances, the polarized signal becomes weak, with a modest preference for a distribution on the south-east side and an orientation orthogonal to the jet direction. Finally, the data from the VLA only (Fig. 2) confirm an orientation of the electric vector parallel to the jet direction in the extended jet, turning slightly clockwise at .
4 DISCUSSION
In §3, we have presented our main new results about the core and jet of Mrk 501. We now discuss their relevance for our understanding of the physics of this source and of AGNs and jets in general.
4.1 The inner core: radio core spectrum and GMVA structure
The nuclear region of Mrk 501 consists of (1) an unresolved component: the radio ‘core’, point-like at our resolution (deconvolved size smaller than as or pc or ), and (2) a faint resolved jet-like structure with a large opening angle, similar (taking into account the significant difference in flux density and linear resolution) to the inner structure of M87 (Ly et al. 2007).
The unresolved component with a total flux density of about 45 mJy, is characterized by a relatively low in contrast with the higher of M87. However, we note that because of the different distance from us of these two sources, our ‘core’ includes the whole M87 structure visible in images at 86 GHz (Krichbaum et al. 2006b). Therefore, the of Mrk 501 is the average of a resolved structure where the jet velocity could be only mildly relativistic, as suggested by the detection of a counter-jet in the more misaligned M87 (Ly et al. 2007; Kovalev et al. 2007).
The diffuse low brightness emission with a total flux density of about 65 mJy is interpreted as the continuation of the inner jet with spine–shear layer structure. Better sensitivity images are necessary to properly map this low brightness feature.
The lack of a dominant unresolved component is in agreement with the spectrum shown in Fig. 8, where we can assume that the observational data refers to both regions (1) and (2) discussed above. Of course, uncertainties related to the variability are always present, but because of the regularity of the spectrum we can use it to estimate the extension of the radio emitting region, by simply inverting the following formula (Marscher 1987):
We assume a local average magnetic field G and a Doppler factor (as discussed by Tavecchio & Maraschi 2001). The low ( GHz) self-absorption frequency requires that the emitting region has a size of the order of 0.1 mas, in agreement with Fig. 6, and that a point-like source, if present, is not dominant. Note that the angular size is proportional to the magnetic field to the 1/4th power, therefore a relatively small (even a factor 10) increase of the value of the magnetic field does not affect these conclusions.
In our GMVA image, we also find a remarkable feature at . In fact, lower resolution VLBI observations have shown so far that the jet of Mrk 501 does not have compact jet knots on a few parsecs scale (G04). If the new component is indeed a jet knot, it will be important to re-observe the source and test if it has a proper motion that can be followed. Alternatively, as suggested by the positional coincidence with a feature in previous images, it could be a standing shock at the position of a change in jet direction, due to unknown reasons. Since this is not far from the first bend in the jet, it may be the result of a standing shock from the disturbance causing the bend.
Moreover, beside this compact feature, a significant amount of flux density in the GMVA data remains difficult to image and/or modelfit. This is mainly due to the scarce coverage of the plane arising from some telescope failures.
4.2 Jet structure and polarization

Limb brightening in the jet of Mrk 501 seems to be present on scales as small as 0.1 mas, but also after the two main bends at and mas, where the jet has significantly expanded transversely. Under a given viewing angle, different Doppler factors can arise from different velocities; therefore, a common explanation for limb brightening in jets lies in the existence of a velocity structure transverse to the jet, with an inner spine and an outer shear.
The issue of the presence of transverse velocity structures is widely debated at the moment, in the light of both analytical models and of numeric simulations (Hardee 2007; Mizuno et al. 2007; Perucho et al. 2007; Gopal-Krishna et al. 2007; Ghisellini et al. 2005). Chiaberge et al. (2000) also suggested the presence of transverse velocity structures to reconcile observational results with the usually adopted AGN unification model. Direct evidence of limb brightening has recently been confirmed, e.g. on the sub-parsec scales in M87 at 43 GHz (Ly et al. 2007) and on a few parsecs scale in 1144+35 (Giovannini et al. 2007). Mrk 501 is unique in the fact that the limb brightened structure is visible on scales over three orders of magnitude, and in sections of the jet that are differently oriented on the plane of the sky. In particular, the limb brightening in the mm-VLBI image indicates that a spine/shear structure could be present from the very inner part of the jet, close to the region where the higher frequency optical emission is produced. Our image provides support for the transverse dual velocity structure hypothesized by Chiaberge et al. (2000) on the basis of the correlation between the radio and the optical core luminosity in radio galaxies and BL Lacs.
We note that despite the large changes in jet PA, the jet direction appears to be constant in time; i.e., we do not have evidence of a change in the direction of jet launch, of precession, or of variable activity. Only the sharp brightness decrease at mas from the core could be due to a discontinuity in the jet activity but the evidence is marginal at most. Conway & Wrobel (1995) tried to interpret this strucutre in terms of a geometrical saturating helix model. However, the sensitive HSA image reveals that the emission comes from a conical surface out to more that 700 mas, much further out than the transition to cylindrical surface required in the saturating helix model; moreover, in our image as well as in other sensitive low frequency images (Giroletti et al. 2004a; Pushkarev et al. 2005), the presence of the counter-jet feature described by Conway & Wrobel (1995) and predicted by their model is excluded at high confidence levels. Clearly, helicity remains an interesting explanation for the large position angle changes in the jet ridge line (see, e.g., the binary black hole system described by Villata et al. 1999). However, the necessary parameters can not be constrained by the available images and the physical reality has to be more complex than the geometrical model. Laing et al. (2006) have also ruled out a helical magnetic field configuration in the nearby, low-luminosity radio galaxy 3C 296. The role played by interactions with the surrounding medium is surely non negligible.
The polarization structure (Fig. 9) is also suggestive of spine-sheath structures. The most prominent feature in our images is the polarized cone departing from the inner region in E-W direction. We note that because of the lower resolution, this cone extends over the full region resolved in the images at higher frequency (Pushkarev et al. 2005). In our images, polarization vectors are predominantly aligned with the jet axis, in contrast with the dominant polarization in the external shear perpendicular to the jet found by Pushkarev et al. (2005). Because of different frequency and resolution, a comparison of the datasets is not obvious; one can assume that the difference in the polarization vector orientation is mainly due to Faraday Rotation or that at 1.4 GHz the dominant polarized flux is from the jet inner spine, and this polarized flux has vectors oriented along the jet direction.
In our image, vectors are aligned with the jet direction also in the extended jet structure in NS direction (after the large bending at about 50 mas from the core). In this region, the central spine is again polarized with vectors aligned with the jet axis and in the external shear a marginal evidence of polarized flux oriented perpendicular to the jet is present. Only in the bending region vectors have a peculiar circular trend but here projection effects can be dominant; moreover, in this region a strong interaction with the ISM is present and it is the most likely region of the change of the jet PA.
We note that also vectors in the VLA map show a similar orientation if we consider that the peak in the VLA polarization map is not at the core position but is located in the main pc scale region at about or more 100 mas from the core. We conclude that at relatively low resolution and at 1.4 GHz the dominant magnetic field structure is perpendicular to the jet axis (E vectors aligned with the jet direction).
4.3 Jet velocity and orientation


Our results show that the jet in Mrk 501 is characterized by different properties on the various scales from a few hundreds to several millions Schwarzschild radii. The jet orientation and velocity, and the ratio between spine and shear contributions must significantly change over these scales. It is therefore impossible to describe it with constant parameters.
Since a counter-jet is not detected, however, the jet has to be in a relativistic regime even in its faintest and most extended region seen in the A configuration VLA observation. The arcsecond scale structure is symmetric, so we argue that the transition to non relativistic velocity has to occur somewhere between projected distances of 1 to 10 kpc.
The jet opening angle remains constant () for several 100 parsecs and any possible re-collimation can take place only in the region where the jet becomes confused with the noise. Under our estimated viewing angle for this part of the jet (), we derive an intrinsic opening angle of . Jets with larger opening angles are found to have lower apparent speeds and Doppler factors in analytical models (Gopal-Krishna et al. 2007). This may explain why Mrk 501 and other TeV blazars do not tend to show strong superluminal motions (Piner & Edwards 2004). However, it is to be noted that the HSA jet of Mrk 501 is several beams wide and does not show evidence of any features such as the knots considered in the analytical modeling of Gopal-Krishna et al. (2007).
The results from the fits of an adiabatic model to the observed jet radius and peak brightness presented in Sect. 3.2 can be used to constrain the bulk velocity, the orientation, and the magnetic field orientation in the various parts of the jet. As we have discussed in the section about the polarization properties (4.2), we have evidence that the magnetic field is predominantly orthogonal to the jet axis.
First, we recall that from Giroletti et al. (2004a) it was shown that low initial Lorentz factors () are ruled out, regardless of the magnetic field orientation, since they disagree with both the observed limb-brightened structure and the jet/counter-jet ratio; moreover, they require a jet deceleration between the ray region and radio jet region that is too strong.
In Fig. 11 we use the new HSA data to show the estimated jet velocity in the case of parallel and perpendicular magnetic field, assuming an initial and an injection spectral index (in accordance with G04). In each plot, we draw five lines, corresponding to angles to the line of sight of 5∘, 10∘, …, 25∘ (i.e., in the range of values allowed by the jet sidedness and core dominance).
With these data, we now also rule out models starting with with magnetic field parallel to the jet axis, since our lower limit on the jet/counter-jet brightness ratio near the core (), and at large distance ( at 120 mas) is inconsistent with the velocity decrease predicted by a parallel magnetic field adiabatic model at mas. This conclusion is also in agreement with the results derived on the polarization properties, i.e., a magnetic field in the jet spine orthogonal to the jet direction (EVPA parallel to the jet axis).
The fit with perpendicular magnetic field and an initial Lorentz factor is in general consistent with the other observational constraints. Only in the case of the smallest viewing angle (i.e. ) the jet velocity falls off rapidly after the main jet bend; in the extended part of the jet, narrow viewing angles are therefore not acceptable. However, it is possible that the jet is more closely aligned in its inner part and then it becomes oriented at a larger after the turn. For all the other viewing angles, the fit velocities behave in rather similar ways. After an initial decrease (, ), the jet velocity remains relativistic, with small oscillation. This is also in agreement with the fact that the jet is still one-sided even on scales of a few kiloparsecs.
Finally, we note that the jet FWHM is probably underestimated at large . For this reason, we have also tried a fit with an input FWHM twice the measured one in the outer jet. The results are qualitatively similar to the previous ones: a parallel magnetic field is not acceptable and the perpendicular field implies an initial deceleration and a more or less constant velocity further out. Although the jet velocity is slightly smaller (), it still remains in the relativistic regime.
5 CONCLUSIONS
We have successfully explored new regions in the remarkable jet of Mrk 501. Thanks to the great sensitivity of the HSA, we reveal that the VLBI jet is one-sided (and therefore in the relativistic regime) out to at least 500 parsecs from the core. The polarization vectors are clearly aligned with the jet spine, suggesting that the magnetic field is orthogonal to the jet main axis. This is also in agreement with the results of the adiabatic fit to the jet brightness and width as a function of distance from the core. Limb brightening – already detected on intermediate scales by VSOP observations (G04) – is now visible on HSA transverse profiles at mas from the core, and is likely present even on the sub-parsec scales imaged by the GMVA.
Despite its presumed weakness, Mrk 501 has in fact been clearly detected by the GMVA on sub-milliarcsecond scales. This result is encouraging given the performance of the existing mm-VLBI array and suggests that not only the brightest AGN can be studied on the smallest scales. Present and future upgrades of the array (e.g., the installation of new receivers at Plateau de Bure, inclusion of new or existing telescopes such as the 40 m at Yebes, Spain) are expected to make the instrument even more sensitive and reliable. The brightness temperature of the most compact component is about K. This region has a linear size of pc or, in terms of gravitational radii, . Significant emission is also revealed in the short baselines between the most sensitive telescopes, and awaits proper imaging with increased fidelity.
Acknowledgements.
We thank Dr. Luigina Feretti for useful discussions. We also thank the personnel of the observatories participating in the Global mm-VLBI array and particularly T. Krichbaum for his advice during the data reduction. MAPT research is funded through a Ramon y Cajal Fellowship from the Spanish Ministery of Education. The National Radio Astronomy Observatory is operated by Associated Universities, Inc., under cooperative agreement with the National Science Foundation. This research has made use of NASA’s Astrophysics Data System Bibliographic Services and of NASA/IPAC Extragalactic Database (NED) which is operated by the Jet Propulsion Laboratory, California Institute of Technology, under contract with the National Aeronautics and Space Administration.References
- Aller et al. (1999) Aller, M. F., Aller, H. D., Hughes, P. A., & Latimer, G. E. 1999, ApJ, 512, 601
- Baum et al. (1997) Baum, S. A. et al. 1997, ApJ, 483, 178
- Cassaro et al. (1999) Cassaro, P., Stanghellini, C., Bondi, M. et al. 1999, A&AS, 139, 601
- Chiaberge et al. (2000) Chiaberge, M., Celotti, A., Capetti, A., & Ghisellini, G. 2000, A&A, 358, 104
- Conway & Wrobel (1995) Conway, J. E. & Wrobel, J. M. 1995, ApJ, 439, 98
- Cotton (2008) Cotton, W. D. 2008, PASP, 120, 439
- Edwards & Piner (2002) Edwards, P. G. & Piner, B. G. 2002, ApJ, 579, L67
- Ghisellini et al. (2005) Ghisellini, G., Tavecchio, F., & Chiaberge, M. 2005, A&A, 432, 401
- Giovannini et al. (2001) Giovannini, G., Cotton, W.D., Feretti, L. et al. 2001, ApJ, 552, 508
- Giovannini et al. (2007) Giovannini, G., Giroletti, M., & Taylor, G. B. 2007, A&A, 474, 409
- Giroletti & Giovannini (2006) Giroletti, M. & Giovannini, G. 2006, Proceedings of the 8th European VLBI Network Symposium. PoS(8thEVN)074
- Giroletti et al. (2004a) Giroletti M., Giovannini G., Feretti L., et al. 2004a, ApJ, 600, 127
- Giroletti et al. (2004b) Giroletti, M., Giovannini, G., Taylor, G. B., & Falomo, R. 2004b, ApJ, 613, 752
- Giroletti et al. (2006) Giroletti, M., Giovannini, G., Taylor, G. B., & Falomo, R. 2006, ApJ, 646, 801
- Gopal-Krishna et al. (2007) Gopal-Krishna, Dhurde, S., Sircar, P., & Wiita, P. J. 2007, MNRAS, 377, 446
- Hardee (2007) Hardee, P. E. 2007, ApJ, 664, 26
- Joyce & Simon (1976) Joyce, R. R., & Simon, M. 1976, PASP, 88, 870
- Kollgaard et al. (1992) Kollgaard, R. I., Wardle, J. F. C., Roberts, D. H., & Gabuzda, D. C. 1992, AJ, 104, 1687
- Kovalev et al. (2007) Kovalev, Y. Y., Lister, M. L., Homan, D. C., & Kellermann, K. I. 2007, ApJ, 668, L27
- Krichbaum et al. (2006a) Krichbaum, T. P., Agudo, I., Bach, U., Witzel, A., & Zensus, J. A. 2006a, Proceedings of the 8th European VLBI Network Symposium. PoS(8thEVN)002
- Krichbaum et al. (2006b) Krichbaum, T. P., Graham, D. A., Bremer, M. et al. 2006b, Journal of Physics Conference Series, 54, 328
- Laing et al. (2006) Laing, R. A., Canvin, J. R., Bridle, A. H., & Hardcastle, M. J. 2006, MNRAS, 372, 510
- Lister & Homan (2005) Lister, M. L., & Homan, D. C. 2005, AJ, 130, 1389
- Lobanov et al. (2000) Lobanov, A. P., et al. 2000, A&A, 364, 391
- Ly et al. (2007) Ly, C., Walker, R. C., & Junor, W. 2007, ApJ, 660, 200
- Marscher (1987) Marscher, A. P. 1987, in Superluminal Radio Sources, ed. A. Zensus & T. J. Pearson (Cambridge: Cambridge University Press), 280
- Mizuno et al. (2007) Mizuno, Y., Hardee, P., & Nishikawa, K.-I. 2007, ApJ, 662, 835
- Owen et al. (1978) Owen, F. N., Porcas, R. W., Mufson, S. L., & Moffett, T. J. 1978, AJ, 83, 685
- Perucho et al. (2007) Perucho, M., Hanasz, M., Martí, J.-M., & Miralles, J.-A. 2007, Phys. Rev. E, 75, 056312
- Piner & Edwards (2004) Piner, B. G., & Edwards, P. G. 2004, ApJ, 600, 115
- Pushkarev et al. (2005) Pushkarev, A. B., Gabuzda, D. C., Vetukhnovskaya, Y. N., & Yakimov, V. E. 2005, MNRAS, 356, 859
- Quinn et al. (1996) Quinn, J. et al. 1996, ApJ, 456, L83
- Rieger & Mannheim (2003) Rieger, F. M. & Mannheim, K. 2003, A&A, 397, 121
- Steppe et al. (1988) Steppe, H., Salter, C. J., Chini, R., Kreysa, E., Brunswig, W., & Lobato Perez, J. 1988, A&AS, 75, 317
- Tavecchio & Maraschi (2001) Tavecchio, F., & Maraschi, L. 2001, X-ray Astronomy: Stellar Endpoints, AGN, and the Diffuse X-ray Background, ed. N. E. White, G. Malaguti & G. G. C. Palumbo, AIP Conf. Proc., 599, 979
- Ulvestad et al. (1983) Ulvestad, J. S., Johnston, K. J. & Weiler, K. W. 1983, ApJ, 266, 18
- Venturi et al. (2001) Venturi, T. et al. 2001, A&A, 379, 755
- Villata et al. (1999) Villata, M. & Raiteri, C. M. 1999, A&A, 347, 30
- Wang et al. (2004) Wang, J., Li, H., & Xue, L. 2004, ApJ, 617, 113