Unveiling a Compact Cluster of Massive and Young Stars in IRAS 17233-3606
Abstract
We have analyzed sensitive high spatial resolution archival radio continuum data at 1.3, 2.0, 3.6 and 6.0 cm as well as the H2O maser molecular line data obtained using the Very Large Array (VLA) in its hybrid AB configuration toward the high-mass star-forming region IRAS 17233-3606 (G351.78-0.54). We find nine compact radio sources associated with this region, six of them are new radio detections. We discuss the characteristics of these sources based mostly on their spectral indices and find that most of them appear to be optically thin or thick ultra- and hyper-compact HII regions ionized by B ZAMS stars. Furthermore, in a few cases the radio emission may arise from optically thick dusty disks and/or cores, however more observations at different wavelengths are necessity to firmly confirm their true nature. In addition, we compared our centimeter maps with the mid-infrared images from the Spitzer Space Observatory GLIMPSE survey revealing a cluster of young protostars in the region together with multiple collimated outflows some of whom might be related with the compact centimeter objects. Finally, we find that one of these centimeter objects, VLA2d, is well centered in an apparent strong and compact north-south bipolar outflow traced by OH masers and we therefore suggest that this object maybe is energizing the latter.
Subject headings:
stars: pre-main sequence – ISM: Jets and outflows – ISM: Individual: (IRAS 17233-3606; G351.78-0.54) – ISM: Molecules, Radio Lines – ISM: Circumstellar Matter – ISM: Binary stars – ISM: Envelopes –1. Introduction
Attention to the high-mass star-forming region IRAS 17233-3606 (or G351.78-0.54) was first garnered by the detection of very strong maser emission from various species e.g. hydroxyl (OH) and water (H2O) (Caswell & Haynes, 1980, 1983). At the time of its detection (1980) it possibly contained the strongest known interstellar hydroxyl maser in the sky, with a peak intensity of 1000 Jy (Caswell & Haynes, 1980). Later on, intense class II methanol (CH3OH) maser emission was detected (Menten, 1991). From the IRAS fluxes and assuming a distance of 2 kpc it has been estimated that IRAS 17233-3606 has a bolometric luminosity of 1.5 105 L⊙ (Hughes & MacLeod, 1993). However, more recent measurements with a better estimation of its kinematic near distance (of about 1 kpc) suggest a luminosity of 2.5 104 L⊙ (MacLeod et al., 1998). We here adopt a distance to IRAS 17233-3606 of 1 kpc, the near kinematic distance to the object reported by MacLeod et al. (1998). The reason that the far distance appears unlikely is because the source is located at an angular separation of more than 0.5∘ from the Galactic plane.
Argon et al. (2000), Argon et al. (2002) and Fish et al. (2005) using VLA and VLBA radio observations of all the four hyperfine structure lines of hydroxyl (OH) around 1.6 GHz revealed that the maser spots clearly show a velocity gradient with a north-south orientation and in a range between -10.4 to 7 km s-1. The masers are centered in the position R.A. = 17h26m42.7s, decl.= -36∘09′17.4′′ (J2000.0). (Fish et al., 2005). The large broad velocity gradient displayed by the OH masers, several times larger than in most sources (Argon et al., 2000) indicates that they could may be tracing a compact bipolar outflow.
Norris et al. (1998) found methanol maser spots coincident with the location of the OH masers that also appear to display a well-defined north-south velocity gradient. Forster & Caswell (1989) and Forster et al. (1990) detected water maser spots about 3′′ west of the hydroxyl and methanol maser location. The water masers cover a much broader velocity range, between to +22 km s-1 and seem to be tracing an “expanding ring” surrounding possibly a central massive protostar. Forster & Caswell (1989) proposed that the compact size ( 2′′), wide velocity spread in the masers, and a lack of strong continuum emission indicate that this “ring” might be produced by a star in its early expansion phase. However, they also suggested that the geometry could be due to one or multiple outflows.
A few radio sources have been found in this region, Haynes et al. (1979) and Caswell & Haynes (1980) reported for the first time the possible presence of an HII region using observations at 2 cm. Subsequent observations at 2 cm by Fix et al. (1982) confirmed this detection and found that this continuum source is extended and bright (310 mJy at 2 cm) and that it is located almost 10′′ east of the OH/CH3OH/H2O maser zone. Later radio observations at 3.6 cm with a better angular resolution also detected this extended continuum source and slightly resolved it in a compact HII region with a cometary morphology (Walsh et al., 1999a). Fix et al. (1982) and Hughes & MacLeod (1993) report the detection of a very weak radio continuum source near to the location of the OH/CH3OH/H2O masers. The observations at 2 cm made by Hughes & MacLeod (1993) with a resolution of revealed that this object is actually a radio binary and that it is located very close to the maser positions.
Fix et al. (1982) and Walsh et al. (1999b) detected 2.0 m infrared sources toward IRAS 17233-3606. Fix et al. (1982) reported an infrared object close to the location of the masers. Images by Walsh et al. (1999b) find a source coincident with the OH/CH3OH/H2O masers and a source coincident with the extended HII region to the east. Finally, De Buizer et al. (2000) detected a compact and faint infrared object at 10 m located about 10′′ east of the position of the masers. They also detected very diffuse and extended 18 m infrared emission about 3′′ northeast of the OH/CH3OH/H2O maser location.
In this paper we present radio continuum observations made with the Very Large Array (VLA) toward the massive star forming region IRAS 17233-3606. We report the detection of new radio sources associated with this zone which are distributed among a cluster of strong infrared sources detected by the Spitzer Space Telescope. We discuss the nature of these radio objects based mainly on their radio spectral indices and counterparts at other wavelengths. In addition, we present imaging of H2O maser emission associated with IRAS 17233-3606.
| Angular Resolutionb | Rms | Largest Angular | ||
|---|---|---|---|---|
| Beam | P.A. | Noise | Scale | |
| Band | [arcsec] | [degrees] | [mJy Beam-1] | [arcsec] |
| 1.3cm | 0.270.25 | 7.1 | 0.45 | 4 |
| 2.0cm | 0.510.42 | 9.7 | 0.28 | 7 |
| 3.6cm | 1.480.43 | 40.3 | 0.06 | 15 |
| 6.0cm | 1.390.88 | 43.7 | 0.03 | 20 |
| Mas.a | 0.350.20 | 34.9 | 10 | 4 |
Note. — (a): The rms-noise is in a velocity channel.
(b): Mayor axis minor axis; position angle of mayor axis.
2. Observations
From the NRAO111The National Radio Astronomy Observatory is a facility of the National Science Foundation operated under cooperative agreement by Associated Universities, Inc. VLA archival database we retrieved continuum data of the IRAS 17233-3606 region at wavelengths of 1.3, 2.0, 3.6, and 6.0 cm and spectral line data of the 22.2 GHz water maser transition (Project number AG502). The data were taken with the VLA in its hybrid AB configuration. The region was observed between 1997 January 26 and 28 using the 27 antennas of the array. The phase center was R.A. = 17h26m42.5s, decl.= -36∘09′17.38′′ (J2000.0). The amplitude calibrator was 1328+307 (3C286) and the phase calibrator was 1622-297 in all bands. The flux densities for 1328+307 were 2.5 Jy (1.3 cm), 3.4 Jy (2 cm), 5.2 Jy (3.6 cm) and 7.4 Jy (6.0 cm), while the bootstrapped flux densities for 1622-297 were 2.3 0.1 Jy (1.3 cm), 2.66 0.05 Jy (2.0 cm), 2.5 0.1 Jy (3.6 cm) and 2.78 0.05 (6.0cm).
For the maser observations the frequency was centered on the H2O =1 =61,6-52,3 =6-5 at 22.235077 GHz, while the correlator was configured in line mode with a band of 64 channels over 6.25 MHz, which provided 97.6 kHz (1.3 km s-1) resolution.
The data were analyzed in the standard manner using the AIPS package of the NRAO. The data were also self-calibrated in phase and amplitude for each band and for the H2O maser data. Most of the images were made with the ROBUST parameter of the task IMAGR set to 0, to obtain an optimal compromise between sensitivity and angular resolution. However, in some cases we used ROBUST set to -5, to get a better angular resolution sacrificing some sensitivity. The resulting rms noise levels and angular resolution for each band are listed in Table 1. In this table we also include the largest scale structure to which the array is sensitive. We assume that the systemic LSR velocity of the molecular cloud associated with IRAS 17233-3606 is km s-1.
| IRAC | Position | Sizea | P.A.b | |
|---|---|---|---|---|
| [arcsec] | [deg.] | |||
| 1 | 17 26 42.845 | -36 08 35.23 | 3.3 2.9 | 16∘ |
| 2 | 17 26 42.529 | -36 09 46.16 | 9.2 7.3 | 49∘ |
| 3 | 17 26 42.946 | -36 09 40.65 | 6.1 5.2 | 22∘ |
| 4 | 17 26 42.950 | -36 09 37.69 | 6.3 4.6 | 164∘ |
| 5 | 17 26 43.040 | -36 09 18.38 | 3.6 3.1 | 155∘ |
| 6 | 17 26 43.075 | -36 09 14.02 | 3.2 3.2 | 82∘ |
| 7 | 17 26 43.082 | -36 09 46.48 | 12.5 9.8 | 27∘ |
| 8 | 17 26 43.555 | -36 09 18.48 | 7.4 5.8 | 69∘ |
| 9 | 17 26 43.708 | -36 09 17.94 | 5.8 5.2 | 14∘ |
| 10 | 17 26 43.920 | -36 09 10.84 | 6.0 5.7 | 12∘ |
Note. — Units of right ascension are hours, minutes, and seconds, and units of declination are degrees, arcminutes, and arcseconds.
(a): Mayor axis minor axis (b): Position angle of mayor axis.
| Wavelength | Position | Flux Density | Deconvolved Sizea | P.A.b | ||
|---|---|---|---|---|---|---|
| cm | [mJy beam-1] | [arcsec] | [deg.] | |||
| VLA1a | ||||||
| 6.0 | 17 26 42.446 | -36 09 14.89 | 7.30.3 | 5.40.1 1 | 421 | |
| 3.6 | 17 26 42.378 | -36 09 15.80 | 4.80.3 | 4.40.5 0.240.05 | 411 | |
| 2.0 | - | - | 1 | – | – | |
| 1.3 | - | - | 2 | – | – | |
| VLA1b | ||||||
| 6.0 | 17 26 42.543 | -36 09 17.92 | 11.40.1 | 1.00.1 0.310.05 | 401 | |
| 3.6 | 17 26 42.418 | -36 09 15.24 | 3.20.3 | 1.80.5 0.340.05 | 411 | |
| 2.0 | - | - | 1 | – | – | |
| 1.3 | - | - | 2 | – | – | |
| VLA2a | ||||||
| 6.0 | 17 26 42.540 | -36 09 17.95 | 4.00.3 | 2 | – | |
| 3.6 | 17 26 42.529 | -36 09 18.14 | 12.30.3 | 1.10.5 0.350.05 | 431 | |
| 2.0 | 17 26 42.514 | -36 09 18.10 | 10.10.5 | 0.280.05 0.190.05 | 5941 | |
| 1.3 | 17 26 42.508 | -36 09 18.04 | 11.80.7 | 0.100.05 0.05 | – | |
| VLA2b | ||||||
| 6.0 | 17 26 42.540 | -36 09 17.95 | 4.00.3 | 2 | – | |
| 3.6 | 17 26 42.526 | -36 09 18.18 | 2.70.3 | 2 | – | |
| 2.0 | 17 26 42.518 | -36 09 18.10 | 3.40.5 | 0.530.05 0.250.05 | 4918 | |
| 1.3 | 17 26 42.547 | -36 09 17.67 | 3.00.5 | 0.340.05 0.100.03 | 15363 | |
| VLA2c | ||||||
| 6.0 | - | - | 0.1 | – | – | |
| 3.6 | - | - | 0.2 | – | – | |
| 2.0 | - | - | 1 | – | – | |
| 1.3 | 17 26 42.609 | -36 09 17.35 | 3.70.8 | 0.290.05 0.1 | 3411 | |
| VLA2d | ||||||
| 6.0 | - | - | 0.1 | – | – | |
| 3.6 | - | - | 0.2 | – | – | |
| 2.0 | - | - | 1 | – | – | |
| 1.3 | 17 26 42.686 | -36 09 17.05 | 2.70.7 | 0.180.05 0.1 | 4624 | |
| VLA3 | ||||||
| 6.0 | 17 26 42.934 | -36 09 39.87 | 11.20.3 | 2.20.1 2.00.1 | 5313 | |
| 3.6 | 17 26 42.922 | -36 09 39.97 | 5.30.3 | 1.90.5 1.00.1 | 426 | |
| 2.0 | - | - | 1 | – | – | |
| 1.3 | - | - | 2 | – | – | |
| VLA4 | ||||||
| 6.0 | 17 26 42.940 | -36 09 09.31 | 9.80.1 | 1.20.2 1 | 655.5 | |
| 3.6 | 17 26 42.933 | -36 09 09.48 | 0.80.05 | 0.900.05 0.300.05 | 3817 | |
| 2.0 | - | - | 1 | – | – | |
| 1.3 | - | - | 2 | – | – | |
| VLA5 | ||||||
| 6.0 | 17 26 43.621 | -36 09 16.31 | 3305 | 3.10.1 2.90.1 | 1121 | |
| 3.6 | 17 26 43.691 | -36 09 16.46 | 2525 | 3.10.1 2.90.1 | 1032 | |
| 2.0 | 17 26 43.699 | -36 09 16.37 | 2115 | 3.10.1 2.20.1 | 1053 | |
| 1.3 | 17 26 43.696 | -36 09 16.27 | 3005 | 3 | – | |
| ——————– | ||||||
| Possible Nature | ||||||
| VLA1a | ? | |||||
| VLA1b | ? | |||||
| VLA2a | HCHII region? | |||||
| VLA2b | HCHII region? | |||||
| VLA2c | HCHII region or Dusty Disk? | |||||
| VLA2d | HCHII region or Dusty Disk? | |||||
| VLA3 | Optically Thin UCHII region | |||||
| VLA4 | Optically Thin UCHII region? | |||||
| VLA5 | Optically Thin UCHII region | |||||
Note. — Units of right ascension are hours, minutes, and seconds, and units of declination are degrees, arcminutes, and arcseconds.
(a): Mayor axis minor axis
(b): Position angle of mayor axis.
3. Results and Discussion
In a region of about 1′ 1′, we detected a total of 5 compact sources in one or more of the individual bands, as well as 16 water maser spots; see Figures 1, 2, and 3. However, two of the radio sources, VLA1 and VLA2, were resolved into 2 (VLA1a,b) and 4 (VLA2a,b,c,d) compact sources, respectively, see Figures 2 and 3. The observed parameters were determined from a linearized least-square fit to an elliptical Gaussian using the task IMFIT of AIPS.
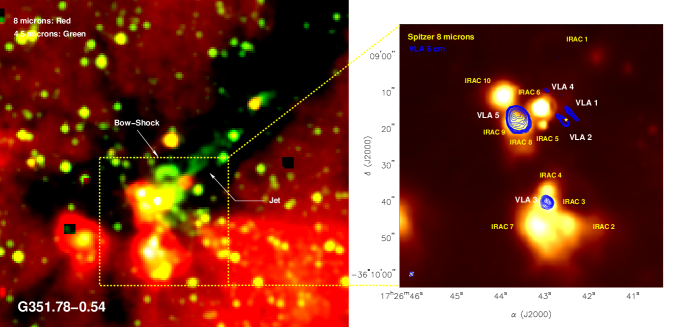
Infrared two color band (8 and 4.5 m) images from the Spitzer Space Observatory’s GLIMPSE survey (Benjamin et al., 2003) overlaid with our 6 cm radio image of the IRAS 17233-3606 (both with similar angular reslotions) are presented in Figure 1. In this image a cluster of 10 bright 8 m infrared sources is detected. We give the positions and sizes of the sources in Table 2 obtained using the task IMFIT of AIPS. These infrared sources are possibly associated with the objects detected by Fix et al. (1982), Walsh et al. (1999b) and De Buizer et al. (2000) at IR wavelengths. In a similar manner we give the observed parameters of the radio sources and the masers in Tables 3 and 4.
As it can be seen, some of these infrared sources appear to be related with the centimeter objects, however, the nature of these infrared objects will not be discussed in this article, they are presented here only for a reference.
In what follows, we discuss separately each of the 9 radio sources detected in this region. Our discussion of the spectral indices is based on the assumption that the flux densities did not change between the 1997 January 26 and 28 observations. Furthermore, due to the spectral index measurements presented here can be very sensitive to the largest angular size and the angular resolution of the observations, matching-beam observations of the sources at several frequencies are thus needed to discuss them in a very reliable way.
3.1. Classical Ultra-compact HII Regions
3.1.1 VLA5
As already mentioned in the introduction this source was discovered and reported as a faint HII region for the first time by Haynes et al. (1979) and Caswell & Haynes (1980). Later observations with a better signal to noise and angular resolution by Fix et al. (1982), Walsh et al. (1999a), and Argon et al. (2000) confirm its detection. However, this source is not related with the center of the OH, CH3OH and H2O masers (the maser zone), but rather it is offset by about 10′′ east , see Figures 2, 3, and the images from Walsh et al. (1999a) and Argon et al. (2000).
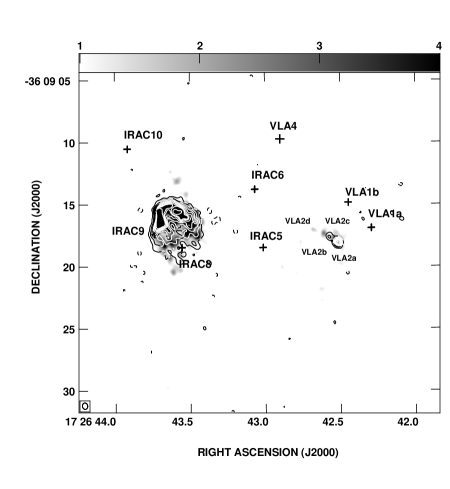
Figure 2 shows the 1.3 and 2 cm continuum emission from the central portion of the IRAS 17233-3606 region, the HII region and the radio binary system reported by Hughes & MacLeod (1993) are shown in this image. The HII region is resolved and shows a very clumpy cometary morphology. We give its deconvolved dimensions and flux densities for all bands in Table 3.


The total 2 cm flux densities for this source reported by Fix et al. (1982) and us (see Table 3) are 310 and 330 mJy, respectively. We consider the agreement very good. Furthermore, the 3.6 cm peak flux densities reported by Walsh et al. (1999a), and Argon et al. (2000) also seem to be consistent with our measurements.
Taking the flux densities at 2 and 1.3 cm from Table 3, which both have a similar angular resolution (see Table 1), we estimated a very flat spectral index for this object, equal to 0.06, indicating thus that the emission might come from an optically thin UCHII region.
Following the derivation of van der Tak & Menten (2005), and assuming that the free-free emission at 2 cm is optically thin (which must be the case for the above calculation), that the ionized gas has a temperature of 104 K, that this source is located a distance of 1 kpc, and taken the values of the number of ionizing photons corresponding to the spectral type for a young star from Panagia (1973), we estimate that possibly the UCHII region is ionized by a B0.5 ZAMS star. This is again in very good agreement with the values and spectral types reported in Walsh et al. (1999a) and Hughes & MacLeod (1993) .
From Figure 1 we can see that this HII region is coincident with the compact infrared sources, IRAC 8 and 9, suggesting that maybe they are the stars responsible for its ionization. However, both infrared sources seem to lie south and east of the UCHII region.
3.1.2 VLA3
This source is first detected here and is imaged at 6 cm in Figure 1. We note that VLA 3 at this wavelength is resolved and turns out to be an UCHII region with a shell-like morphology. We give its deconvolved dimensions and flux densities for all bands in Table 3.
In a similar way than VLA 5, taking the flux densities at 2 and 1.3 cm from Table 3 for VLA3 (both measurements with similar angular resolution), we estimated a spectral index for this object of 1.1, consistent with the emission also coming from an optically thin HII region.
In addition, assuming again that the free-free emission at 2 cm is optically thin, that the ionized gas has a temperature of 104 K, and that this source is located a distance of 1 kpc, we estimate that this HII region is possibly ionized by a B2 type ZAMS star.
From Figure 1, we also see that this UCHII region is coincident with one compact infrared source, IRAC 3.
3.2. On the Nature of VLA1 and VLA4
These sources were only detected in our more sensitive maps, at 6 and 3.6 cm, see Figure 1 for an image at 6 cm. VLA4 is very compact and faint, while VLA1 is quite elongated in northeast-southwest orientation at 6 cm. Furthermore, VLA1 is resolved into two sources (VLA1a,b) in our 3.6 cm map with a better angular resolution. We give their flux densities and deconvolved sizes at this wavelength in Table 3.
From the values of the flux densities at 6 and 3.6 cm presented in Table 3, which also both have a similar angular resolution (see Table 1), we estimate a spectral index for VLA4 of 1.0, and for VLA1a and b of -0.8 suggesting that possibly the emission arises from optically thin HII regions or from ionized stellar winds (the latter case is more likely for VLA4). The radio emission from VLA1a and b also might be associated with synchrotron emission. This kind of emission is believed to trace gyrosynchrotron emission from active magnetospheres of young, low-mass stars. However, similar negative spectral indices also have found in sources associated with high- and low-mass stars and are believed to be produced in strong shocks, see Garay et al. (1996).
However, these flattened spectral indices could also be due to missing flux density in the higher angular resolution and higher frequency observations, see Table 1 where we include the largest scale structure to which the array is sensitive.
None of these radio sources have a counterpart at infrared wavelengths (8.0 and 4.5 ), see Figure 1.
| Maser | Position | Central Vel. | Deconvolved Sizea | P.A.b | Sν dv | |
|---|---|---|---|---|---|---|
| Feature | [Km s-1] | [arcsec] | [deg.] | [Jy beam-1 km s-1] | ||
| 1 | 17 26 42.155 | -36 09 11.76 | -1.0 | 0.140.03 0.2 | 17380 | 2.10.2 |
| 2 | 17 26 42.239 | -36 09 19.77 | -1.0 | 0.400.01 0.2 | 301 | 11.00.2 |
| 3 | 17 26 42.280 | -36 09 17.57 | 0.5 | 0.490.02 0.160.01 | 159.60.2 | 181.20.3 |
| 4 | 17 26 42.284 | -36 09 17.68 | -0.5 | 0.330.01 0.3 | 140.80.3 | 154.30.3 |
| 5 | 17 26 42.326 | -36 09 16.46 | -1.5 | 0.060.03 0.010.06 | 1592 | 89.80.2 |
| 6 | 17 26 42.343 | -36 09 15.98 | 8/1.5/-19.5 | 0.280.01 0.020.01 | 262 | 13.60.2 |
| 7 | 17 26 42.392 | -36 09 18.69 | -2.0 | 0.5 0.5 | – | 23.00.5 |
| 8 | 17 26 42.395 | -36 09 18.67 | 22.5/0.5/-10 | 0.3300.002 0.0520.007 | 63.40.5 | 64.30.6 |
| 9 | 17 26 42.428 | -36 09 16.21 | -14.0 | 0.050.01 0.02 | 355 | 58.20.2 |
| 10 | 17 26 42.438 | -36 09 18.57 | -2.5 | 0.370.01 0.050.01 | 90.40.3 | 138.30.3 |
| 11 | 17 26 42.511 | -36 09 18.49 | -4.0 | 0.130.01 0.080.01 | 272 | 34.00.2 |
| 12 | 17 26 42.539 | -36 09 17.28 | -3.5 | 0.130.01 0.020.01 | 168.60.5 | 119.00.2 |
| 13 | 17 26 42.538 | -36 09 17.31 | -8.5/-13.5 | 0.5 0.5 | – | 21.00.5 |
| 14 | 17 26 42.798 | -36 09 20.35 | -11.5 | 0.3 0.1 | – | 3.70.5 |
| 15 | 17 26 42.902 | -36 09 09.06 | -5.5 | 0.3 0.2 | – | 5.90.5 |
| 16 | 17 26 42.955 | -36 09 09.15 | -4.5 | 0.3 0.2 | – | 3.30.5 |
Note. — Units of right ascension are hours, minutes, and seconds, and units of declination are degrees, arcminutes, and arcseconds.
(a): Mayor axis minor axis
(b): Position angle of mayor axis.
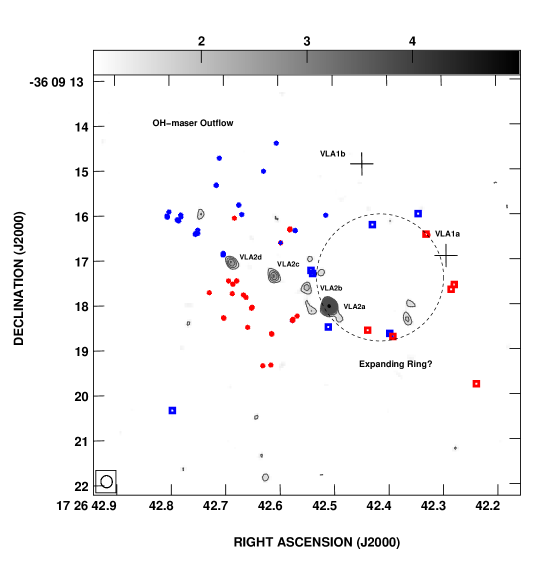
3.3. Radio Objects Associated with The Maser Zone
In Figure 3 we show the 1.3 cm radio emission together with the position of the OH, CH3OH and H2O masers spots reported by Fish et al. (2005), Forster et al. (1990) and Caswell (1997). We found six compact radio sources in this region, VLA2a,b,c,d (VLA2a,b were detected for the first time by Hughes & MacLeod (1993) at 6 cm) and VLA1a,b. In Figure 2 we also show the radio sources detected by Hughes & MacLeod (1993), VLA2a and VLA2b, they appear to form a binary system with a spatial separation of about 800 AU. However, the new observations show that possibly these sources are part of a multiple system. The sources VLA2c and d are only detected in our 1.3 cm images.
Figure 4 shows the SEDs for the centimeter compact sources VLA2a,b,c, and d. The flux densities values for the four wavelenghts were obtained from Table 3, however the values at 2 and 1.3 cm were obtained using a convolved map at a resolution of 1′′, i.e. with a angular resolution similar to those at 3.6 and 6 cm (see Table 1). We convolved the maps using the parameter ”UVTAPER” from the task ”IMAGER” of AIPS. This parameter set a Gaussian taper to weight down long baseline data points.
VLA2c and d have steeper spectral indices, 2.2 consistent with either optically thick hyper-compact HII regions or with optically thick thermal dust emission from massive dusty cores and/or disks. If the emission is arising from thermal dust, the spatial sizes (about 300 AU) of these sources indicate that they are more likely to be compact circumstellar disks rather than dusty cores. VLA2b shows a negative spectral index -0.15, possibly associated with synchrotron emission. The spectrum of the source VLA2a also can be modeled by a two-component spectrum where for the centimeter wavelengths is dominated for a classical HII region, while on the millimeter wavelengths is dominated by a component that rises rapidly with frequency. This component is likely to be associated with dust emission from a core or disk, see Figure 4.
From Figure 3 we note that the radio source VLA2d is well centered in an apparent compact bipolar north-south outflow traced by the OH maser spots. This again suggests that VLA2d maybe is a compact circumstellar disk rather than an hyper-compact HII region. We also note that there is a strong bow-shock about 40′′ north of this compact outflow and which is quite well aligned to this compact outflow traced by OH masers, see Figure 1. Possibly this bow-shock is part of an older ejection of this compact outflow. If this is the case, the outflow should have a dynamical age of the order of 104 years, assuming a velocity of 10 km s-1. Furthermore, Leurini et al. (2008) found a strong north-south 12CO outflow using the Atacama Pathfinder EXperiment (APEX) radiotelescope and that is emanating from the maser zone, it is likely that this molecular compact outflow forms part of this bow-shock and the very compact outflow traced by the OH maser.
Finally, there is another highly collimated northwest-southeast jet that seems to be emanating from this region (see Figure 1), possibly also associated with these compact radio objects.
We do not find any 8 m infrared source associated with these four radio objects, indicating that maybe they are highly embedded in the molecular cloud. The extended 4.5 m source associated with this zone (see Figure 1) seems to be more likely associated with shocked gas possibly from the multiple outflows originating here
3.4. An Expanding Ring?
As first suggested by Forster & Caswell (1989) and as can be observed in Figure 3 the water maser spots located to the east of the OH masers appear to be tracing a “ring” centered on the position R.A. = 17h26m42.4s decl.= -36∘09′17.5′′ (J2000.0) with a radius of approximately 1.5′′. The maser spots associated with the “ring” are displaying broad red-shifted (-4 to 22.5 km s-1) and blue-shifted velocities (-4.5 to -19.5 km s-1), see Table 4. Moreover, systematically the blueshifted maser spots are located to the northeast, while the redshifted masers lie to the southwest. The velocities and size are in good agreement with those reported by Forster & Caswell (1989) and Forster et al. (1990). However, we think that such large radial velocity gradients (V 40 km s-1) observed in the masers are too large to be explained in terms of a ring in expansion produced by an energetic stellar homogenous wind that compresses the ambient medium and drives a shock into it, and particularly since there is no a radio or infrared source. A possibility is that they are due to multiple outflows. Torrelles et al. (2001) and Uscanga et al. (2005) reported the presence of ”rings” in expansion (on much smaller scales) traced by water masers in the high mass star forming regions Cepheus and W75N, respectively. The radial velocities of the masers are close to the ambient cloud velocity.
We therefore suggest that possibly the radio sources VLA2a and VLA1a that are well centered on the positions of the water masers might be exciting them. These radio sources thus perhaps are driving northeast-southwest compact outflows.
4. Summary
We have analyzed 1.3, 2, 3.6 and 6 cm continuum and water maser line archival data from the VLA toward the massive star forming region IRAS 17233-3606. Comparing our results with mid-infrared images from the Spitzer Observatory’s GLIMPSE survey revealed a cluster of young protostars associated with this region and multiple outflows, some of them possibly related with the compact centimeter objects. We have summarized the tentative nature of every radio source in Table 3.
The specific results and conclusions of this study are as follows.
-
•
We report the detection of nine compact radio sources, six of them new detections. We found that they are embedded in a cluster of infrared sources associated with multiple outflows. Most of these radio objects appear to be ultra- and hyper-compact optically thin and thick HII regions ionized by early B type ZAMS stars, however, in a few cases (VLA2c and VLA2d) they could be optically thick compact ( 300 AU) and dusty circumstellar disks that might be powering a strong bow-shock and a collimated outflow observed in the infrared wavelengths and that appear to emanate from this region.
-
•
We found that the object VLA2d is well centered in a putative low velocity, strong and compact north-south bipolar outflow that is traced by OH masers, and we suggest that this object would be powering it.
-
•
We suggest that the sources VLA2a and VLA1a might be energizing two northeast-southwest outflows traced by H2O maser emission and which appear to form an “expanding ring”.
References
- Argon et al. (2000) Argon, A. L., Reid, M. J., & Menten, K. M. 2000, ApJS, 129, 159
- Argon et al. (2002) Argon, A. L., Reid, M. J., & Menten, K. M. 2002, in IAU Symposium, Vol. 206, Cosmic Masers: From Proto-Stars to Black Holes, ed. V. Migenes & M. J. Reid, 367–+
- Benjamin et al. (2003) Benjamin, R. A. et al. 2003, PASP, 115, 953, arXiv:astro-ph/0306274
- Caswell (1997) Caswell, J. L. 1997, MNRAS, 289, 203
- Caswell & Haynes (1980) Caswell, J. L., & Haynes, R. F. 1980, IAU Circ., 3509, 2
- Caswell & Haynes (1983) ——. 1983, Australian Journal of Physics, 36, 361
- De Buizer et al. (2000) De Buizer, J. M., Piña, R. K., & Telesco, C. M. 2000, ApJS, 130, 437
- Fish et al. (2005) Fish, V. L., Reid, M. J., Argon, A. L., & Zheng, X.-W. 2005, ApJS, 160, 220, arXiv:astro-ph/0505148
- Fix et al. (1982) Fix, J. D., Mutel, R. L., Gaume, R. A., & Claussen, M. J. 1982, ApJ, 259, 657
- Forster & Caswell (1989) Forster, J. R., & Caswell, J. L. 1989, A&A, 213, 339
- Forster et al. (1990) Forster, J. R., Caswell, J. L., Okumura, S. K., Ishiguro, M., & Hasegawa, T. 1990, A&A, 231, 473
- Garay et al. (1996) Garay, G., Ramirez, S., Rodriguez, L. F., Curiel, S., & Torrelles, J. M. 1996, ApJ, 459, 193
- Haynes et al. (1979) Haynes, R. F., Caswell, J. L., & Simons, L. W. J. 1979, Australian Journal of Physics Astrophysical Supplement, 48, 1
- Hughes & MacLeod (1993) Hughes, V. A., & MacLeod, G. C. 1993, AJ, 105, 1495
- Leurini et al. (2008) Leurini, S., Hieret, C., Thorwirth, S., Wyrowski, F., Schilke, P., Menten, K. M., Guesten, R., & Zapata, L. 2008, ArXiv e-prints, 804, 0804.4495
- MacLeod et al. (1998) MacLeod, G. C., Scalise, E. J., Saedt, S., Galt, J. A., & Gaylard, M. J. 1998, AJ, 116, 1897
- Menten (1991) Menten, K. M. 1991, ApJ, 380, L75
- Norris et al. (1998) Norris, R. P. et al. 1998, ApJ, 508, 275, arXiv:astro-ph/9806284
- Panagia (1973) Panagia, N. 1973, AJ, 78, 929
- Smith & Rosen (2005) Smith, M. D., & Rosen, A. 2005, MNRAS, 357, 1370
- Torrelles et al. (2001) Torrelles, J. M. et al. 2001, Nature, 411, 277
- Uscanga et al. (2005) Uscanga, L., Cantó, J., Curiel, S., Anglada, G., Torrelles, J. M., Patel, N. A., Gómez, J. F., & Raga, A. C. 2005, ApJ, 634, 468
- van der Tak & Menten (2005) van der Tak, F. F. S., & Menten, K. M. 2005, A&A, 437, 947, arXiv:astro-ph/0504026
- Walsh et al. (1999a) Walsh, A. J., Burton, M. G., Hyland, A. R., & Robinson, G. 1999a, MNRAS, 309, 905
- Walsh et al. (1999b) ——. 1999b, MNRAS, 309, 905