Nonequilibrium carriers in an intrinsic graphene under interband photoexcitation
Abstract
We study nonequilibrium carriers (electrons and holes) in an intrinsic graphene at low temperatures under far- and mid-infrared (IR) radiation in a wide range of its intensities. The energy distributions of carriers are calculated using a quasiclassic kinetic equation which accounts for the energy relaxation due to acoustic phonons and the radiative generation-recombination processes associated with thermal radiation and the carrier photoexcitation by incident radiation. It is found that the nonequilibrium distributions are determined by an interplay between weak energy relaxation on acoustic phonons and generation-recombination processes as well as by the effect of pumping saturation. Due to the effect of saturation, the carrier distribution functions can exhibit plateaus around the pumping region at elevated intensities. As shown, at sufficiently strong mid-IR pumping, the population inversion can occur below the pumping energy. The graphene dc conductivity as a function of the pumping intensity exhibits a pronounced nonlinearity with a sub-linear region at fairly low intensities and a saturation at a strong pumping. However, an increase in the pumping intensity in very wide range leads only to a modest increase in the carrier concentration and, particularly, the dc conductivity. The graphene conductivity at mid-IR irradiation exhibit strong sensitivity to mechanisms of carrier momentum relaxation.
pacs:
73.50.Pz, 73.63.-b, 81.05.UwI Introduction
The features of the dynamics of carriers (electrons and holes) in graphene and the mechanisms of their relaxation 1 result in the exceptional properties of graphene and a new device prospects (see 2 for review). The studies of optical phenomena, including the Raman scattering (see3 and references therein), ultrafast spectroscopy, 4 ; 5 and magnetooptics, 6 can be used to reveal both the energy spectrum parameters and the mechanisms of carrier scattering. The gapless energy spectrum of graphene, with the characteristic velocity cm/s which corresponds to the neutrinolike bandstructure (Weyl-Wallace model) 7 , provides its nontrivial optical properties due to effective interband transitions in the far- and mid-infrared (IR) spectral regions. The linear response of epitaxial graphene 8 and graphite 9 was measured and the pertinent calculations were performed in Ref.10 . Recently, 11 a fairly low threashold of the nonlinear response under far- or mid-IR excitation have been found and the photoconductivity of an intrinsic graphene was calculated for a low-pumping region. But an essentially nonlinear regime of response was not calculated and no experimental data concerning nonlinear properties of graphene in this spectral region are available. Thus, an investigation of the nonlinear response of graphene is timely now.
In this paper, we consider the nonequilibrium energy distributions of the carriers under interband photoexcitation by far- or mid-IR pumping in a wide range of the intensities. Using the obtained distributions, we analyze the nonlinear dependencies of the carrier concentration and the dc conductivity on the pumping intensity and frequency at different temperatures. The dynamic conductivity of graphene photoexcited by far- or mid-IR radiation is calculated as well.
As shown below, the energy distribution of carriers are determined by an interplay between quasielastic energy relaxation, which is ineffective at low energies, and generation-recombination processes. There is a marked increase in the carrier population in the range of energies where the phonon and radiative mechanisms of relaxation are virtually compensated. The interband absorption saturation also affects the energy distribution of carriers. The graphene dc conductivity as a function of the pumping intensity exhibits a pronounced nonlinearity with a sub-linear region at fairly low intensities and a saturation at a strong pumping. It is also found that in a certain energy range of the pumping power the real part of the interband contribution to the dynamic conductivity becomes negative, i.e. the negative absorption takes place.
The paper is organized in the following way. The model under consideration is described in Sec. II. In Sec. III, we present the nonequilibrium carrier distribution as function of pumping intensity for a few pumping frequencies. The results of calculations of the photoconductivity and the dynamic conductivity, as a response on a weak dc electric field or a probe high-frequency field, are discussed in Sec. IV. The brief discussion of the assumptions used in calculations and concluding remarks are given in the last section.
II Model
In order to obtain the energy distributions of the carriers in intrinsic graphene we use the quasiclassic kinetic equation derived and analytically analyzed previously 11 for the case of low intensity pumping. The kinetic equation under consideration accounts for the energy relaxation due to scattering on acoustic phonons, the radiative generation-recombination processes associated with thermal radiation, and the far- or mid-IR pumping. We disregard the inter-carrier scattering since at low temperatures the carrier concentration can be small even at relatively strong interband pumping. Since the scattering mechanisms in - and -bands are symmetric, the electron and hole distributions in the intrinsic material are identical and we consider below the carrier distribution function . Taking into account the abovementioned mechanisms, the kinetic equation under consideration, which governs the distribution function , is presented in the following form:
| (1) |
Here the collision integrals and are associated with the relaxation of carriers caused by the acoustic phonons and the equilibrium thermal radiation, respectively, the term describes the interband carrier excitation. Since the interband transition due to the acoustic phonon scattering are forbidden (the sound velocity is weak in comparison to ), the concentration balance equation takes form
| (2) |
and it can be considered as the normalization condition for . Another condition for streams from the requirement =0, so that any term in Eq. (1) is equal to zero at , i.e. the zero acoustic flow at high energies takes place, =0.
Considering the quasielastic scattering of carriers on acoustic phonons, one can use the Fokker-Planck form of 12 and Eq. (1) can be presented as 11
| (3) | |||
Here is the characteristic thermal momentum ( is the temperature in the energy units), is the Planck distribution function, and the form-factor describes the broadening of interband transitions. So that is the momentum of just photogenerated carriers corresponding to the pumping frequency and the broadening is described by which is proportional to if the scattering rates are proportional to the density of states. It was assumed below that and 0.1 13 . The dimensionless parameter and are the relative strength of the energy relaxation with respect to the generation-recombination efficiency and the characteristic value of the pumping intensity, respectively. It is important below, that a following dependencies on , and the pumping intensity, , take place:
| (4) |
so that the acoustic contribution increases with while the excitation efficiency decreases with and . The explicit expressions of and can be found in Ref. 11 . Using the typical parameters of graphene 14 , at =77 K one obtains 0.32. At the same temperature at =1W/cm2 and =120 meV one can get 2.8.
Numerical procedure for the problem described can be simplified if one takes into account that the equilibrium distribution remains valid at . The condition =1/2 (it is the Fermi function at zero energy) can be explicitly derived considering that vanishes at (if ) and equations and are satisfied by the equilibrium distribution. Taking this into account, one can write the boundary condition at , as the requirement that the factor under derivative in the first term in the left-hand side of Eq. (3) turns to zero. As a consequence, for numerical solution of Eq. (2), one can use the following requirements as the boundary conditions for the distribution function:
| (5) |
while the balance condition (2) should be used for checking of a numerical results obtained. The numerical solution of Eq. (3) is performed below using a finite difference method and the pertinent iteration procedure.
III Nonequilibrium distribution
We present here the results of numerical solution of Eq. (3) with conditions (5) and discuss the obtained distribution functions at different excitation conditions (frequency and intensity of pumping) and temperature for the typical parameters of graphene 14 . The variation of the sheet carrier concentration with varying excitation conditions is also considered.
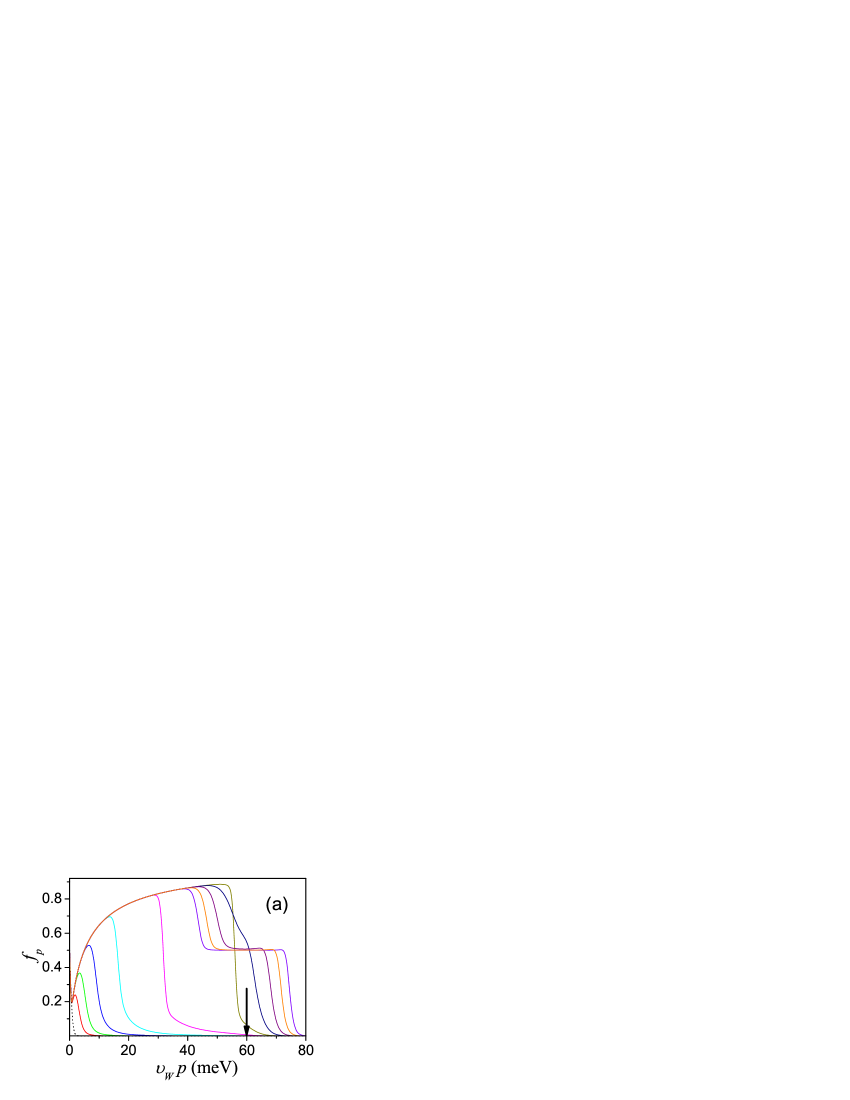
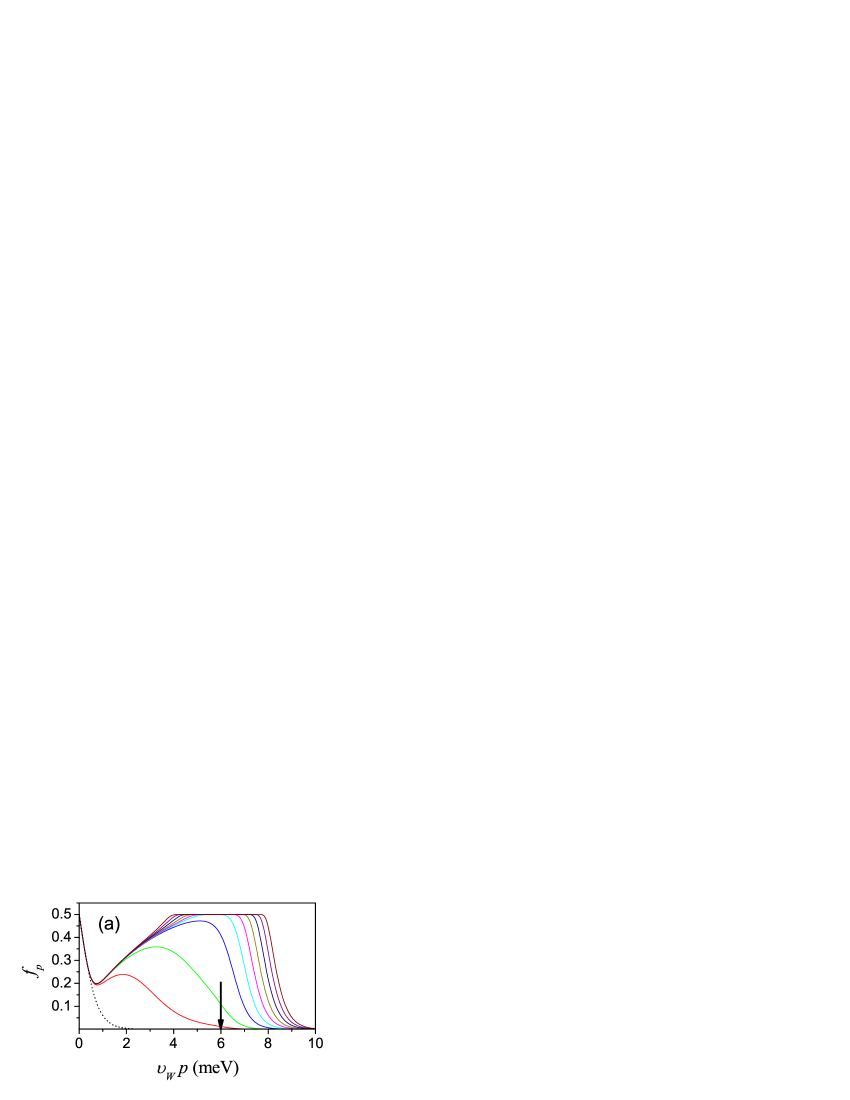
The obtained distribution functions under the far-IR pumping with the photon energy 12 meV are shown in Fig. 1 with the one-order step in pumping intensities from W/cm2 to W/cm2. First of all, one can see a visible modification of the carrier distributions at low intensities (up to W/cm2 at =4.2 K and for W/cm2 at =77 K). Next, the peak of the distribution function shifts towards . Such a behavior is in agreement with the previous analytical consideration 11 . Further, at sufficiently strong pumping, tends also to the values close to , so that plateau-like energy distibutions are formed. The range of carrier energies, where , widens with increasing pumping intensity starting W/cm2 at =4.2 K and W/cm2 at =77 K. Since remains equilibrium at (all terms of Eq.(1) are equal zero separately), one can see a deepening of in the region .
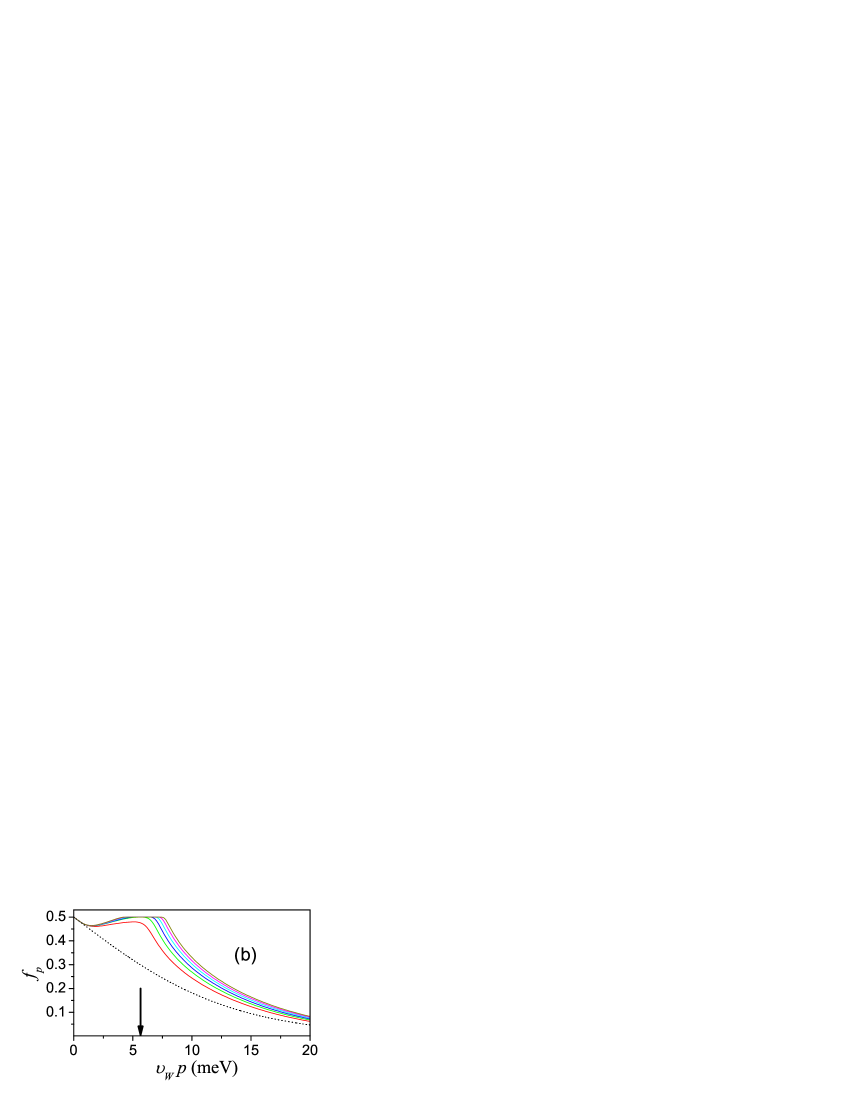
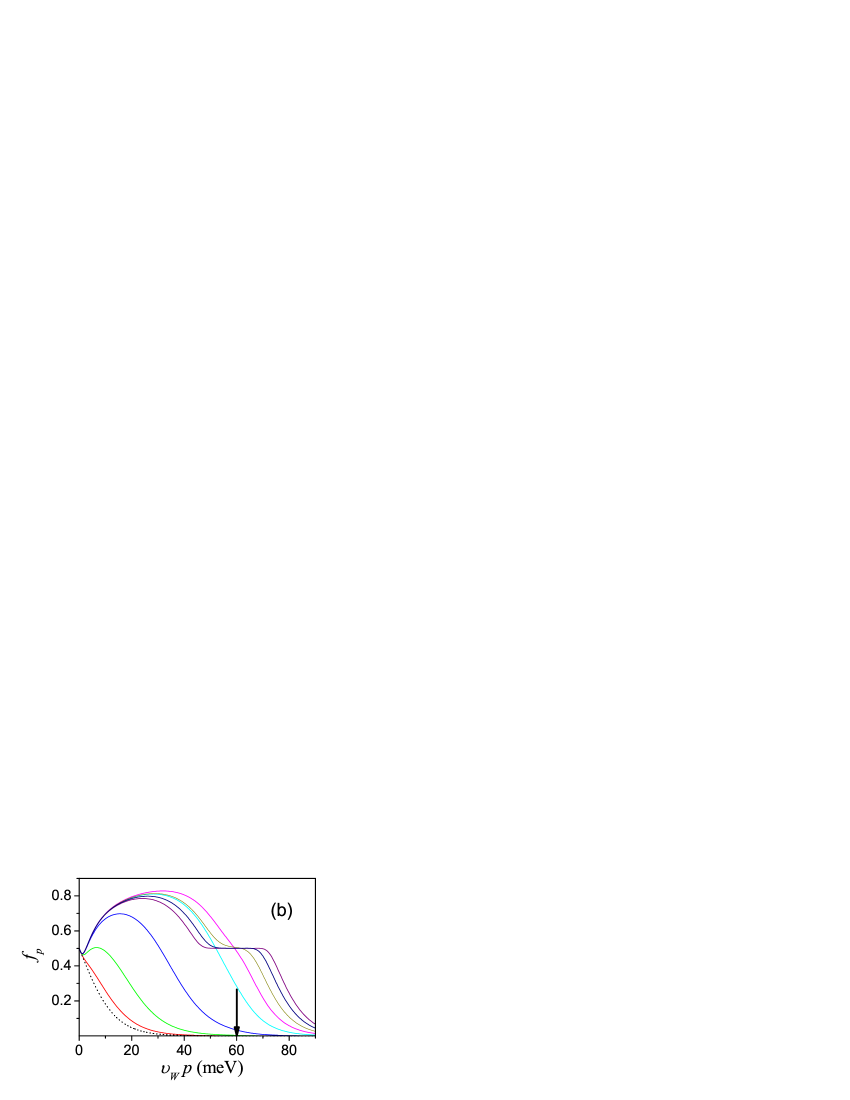
Under mid-IR excitation, 60 meV, a similar character of the low-pumping regime of response takes place, see Fig. 2. With increased pumping intensity, a peak of distribution appears, moreover, the peak distribution function can markedly exceed , i.e. the population inversion occurs if W/cm2 at =4.2 K and W/cm2 at =77 K. Further, in the pumping region when W/cm2 at =4.2 K (or W/cm2 at =77 K) tends to , so that a plateau of is formed around the energy . As increases and the plateau region widens, the peak amplitude below somewhat decreases but a maximal value of exceeds 1/2. Since the equilibrium distribution is predetermined by Eqs. (3) and (5) at , a non-monotonic distribution with a deepening at , a peak under the energy , and a plateau around is realized.
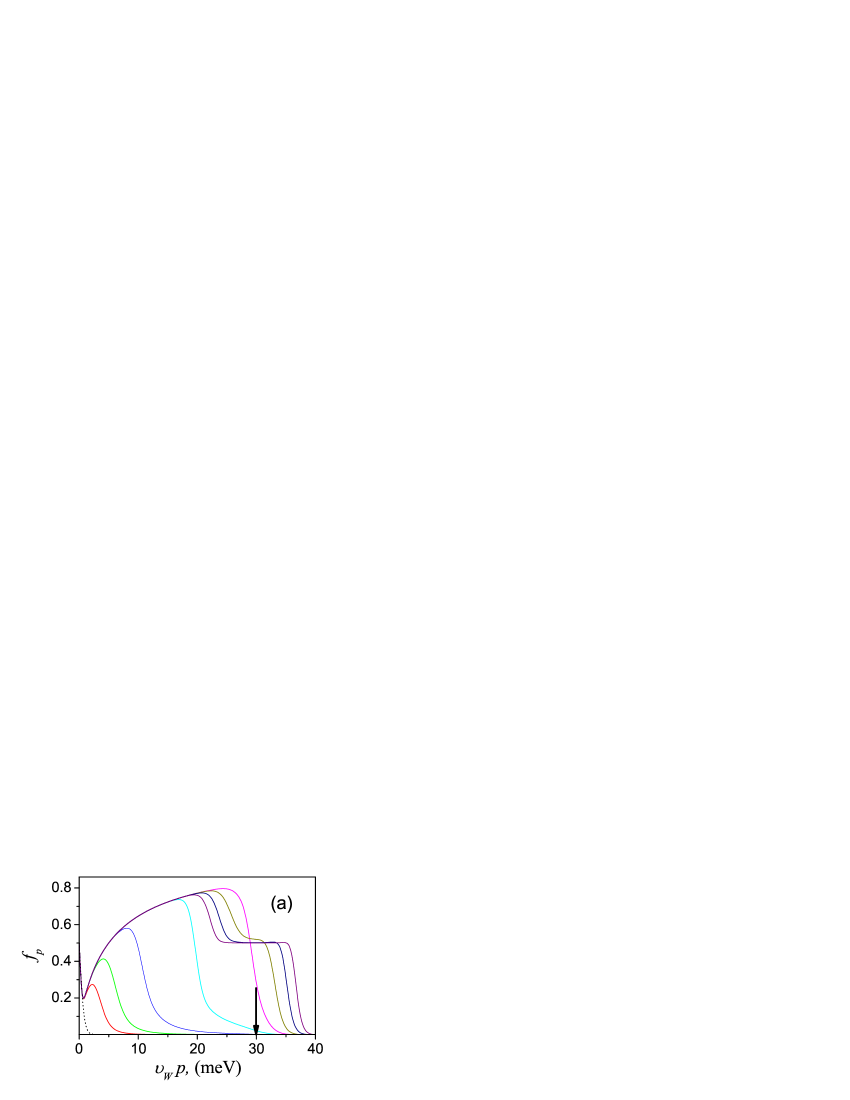
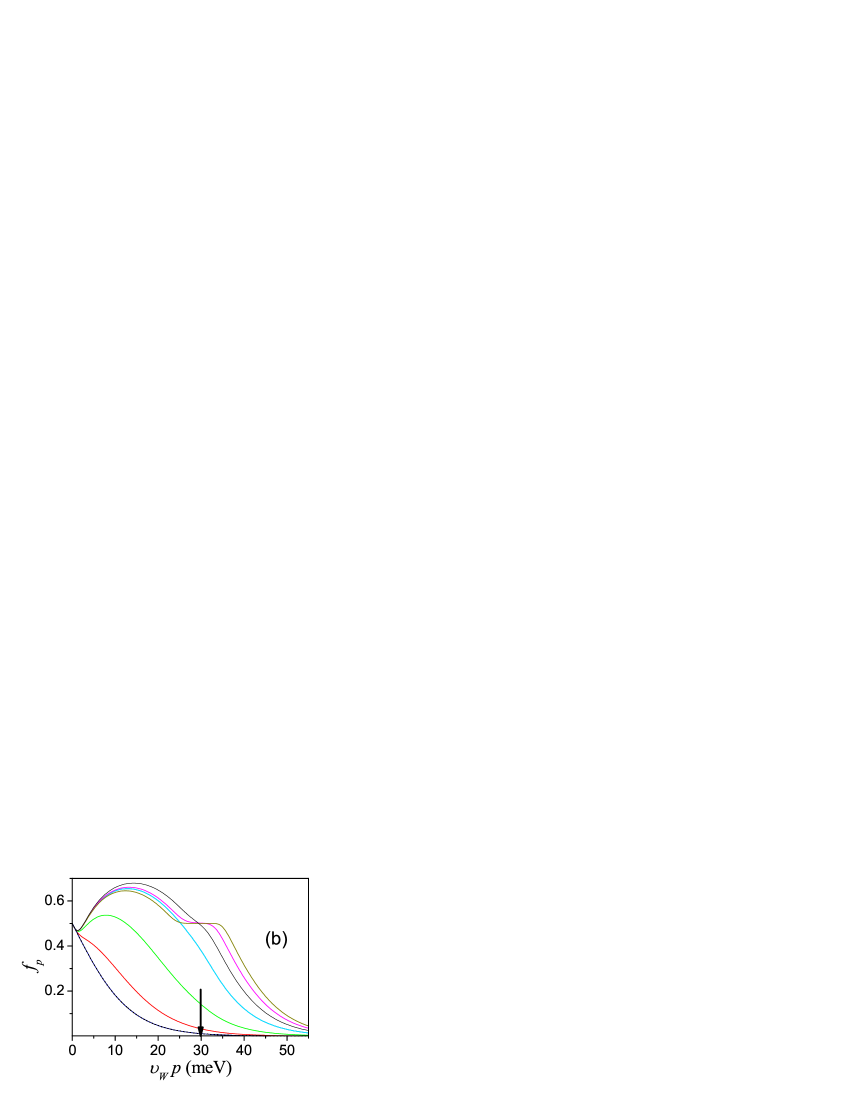
Similar character of distribution takes place as increases: the same peculiarities are shifted to higher intensities according to Eq. (5). In Figs. 3a and 3b we plot under the CO2 laser pumping, 120 meV. One can see that the population inversion regime begins for W/cm2 at =4.2 K (or for W/cm2 at =77 K) and the saturation region around takes place if W/cm2 at =4.2 K and 77 K. These peculiarities are retained for higher intensities, up to W/cm2.
The obtained distribution functions allows to calculate the sheet carrier concentration at different pumping conditions and temperatures according to the standard formula:
| (6) |
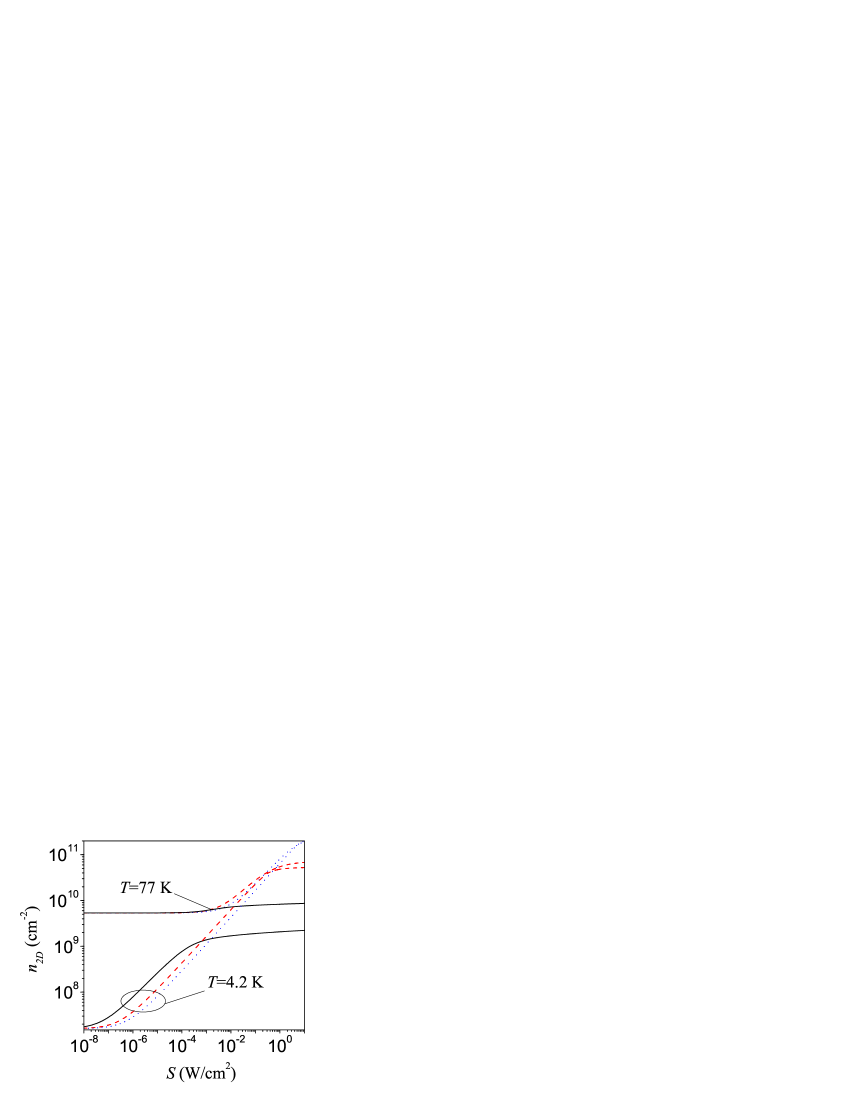
Figure 4 demonstrates the dependences of the sheet concentration in graphene as a function of the pumping intensity corresponding to the energy distributions shown in Figs. 1-3. As follows from the numerical calculation of the integral (6) at =4.2 K, increases with in an intermediate pumping region and tends to saturation under higher pumping intensities. The power dependence with 0.57 takes place at between W/cm2 and 0.5 W/cm2 for the mid-IR pumping or between W/cm2 and W/cm2 for the far-IR pumping (see Figs. 4a and 4b, respectively). Under mid-IR pumping at =77 K, the concentration increases according to the same power law and saturates at the same pumping intensities. However, the nonlinear regime begins starting mW/cm2. This is because the equilibrium concentration is proportional to . Note that in the case of pumping by CO2 laser, the saturation occurs at cm-2. In this situation, the inter-carrier scattering might be important.
IV DC and dynamic conductivities
Here we turn to the consideration of the response of the nonequilibrium carriers with the distribution functions obtained above to a weak dc electric field or a probe radiation. Taking into account that the momentum relaxation of carriers is caused by elastic scattering mechanisms, one can use the following formula for the dc conductivity 15 :
| (7) |
Here is the correlation length of static disorder scattering, , where the first order Bessel function of imaginary argument, and is the conductivity in the case of short-range disorder scattering, when 15 . According to Eq.(5) , for the short-range scattering case, when ( is the average momentum), the dc conductivity is determined by the low energy carriers so that appears to be independent of optical pumping intensity despite a significant concentration of the photogenerated carriers, . For the definiteness, it was assumed that = 10, 20, and 30 nm.
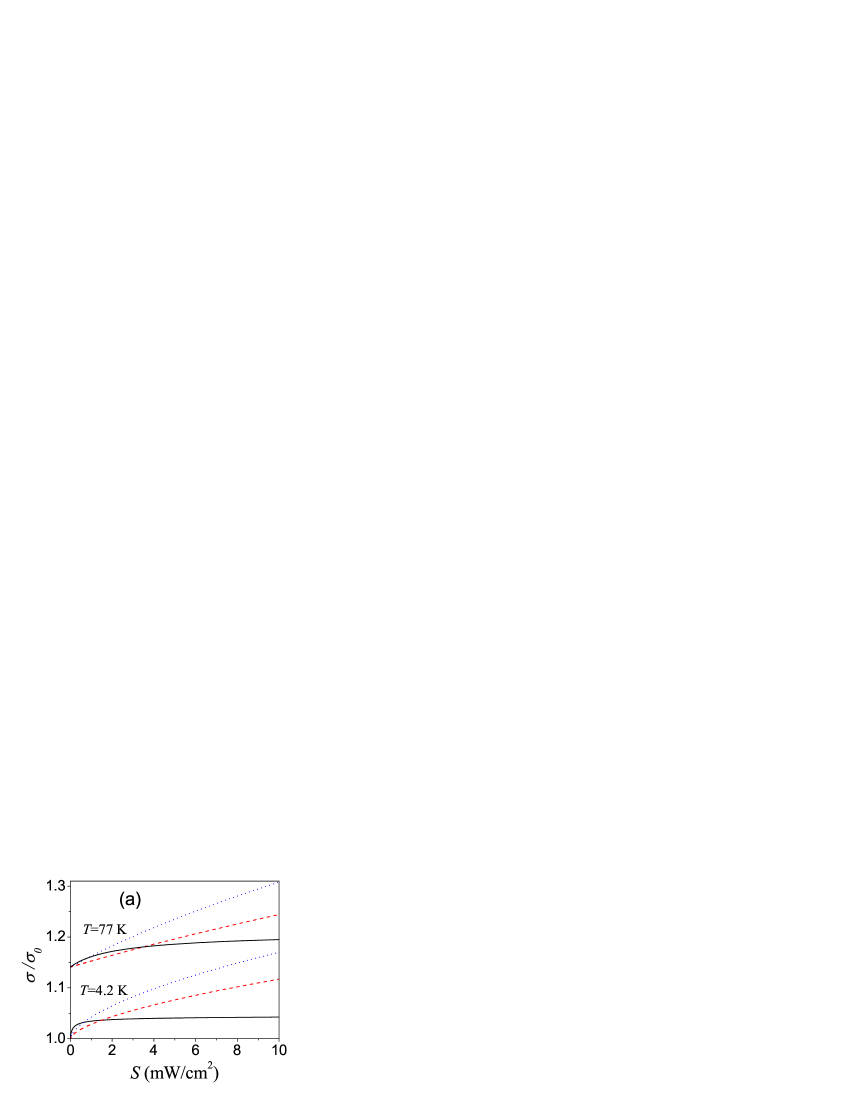
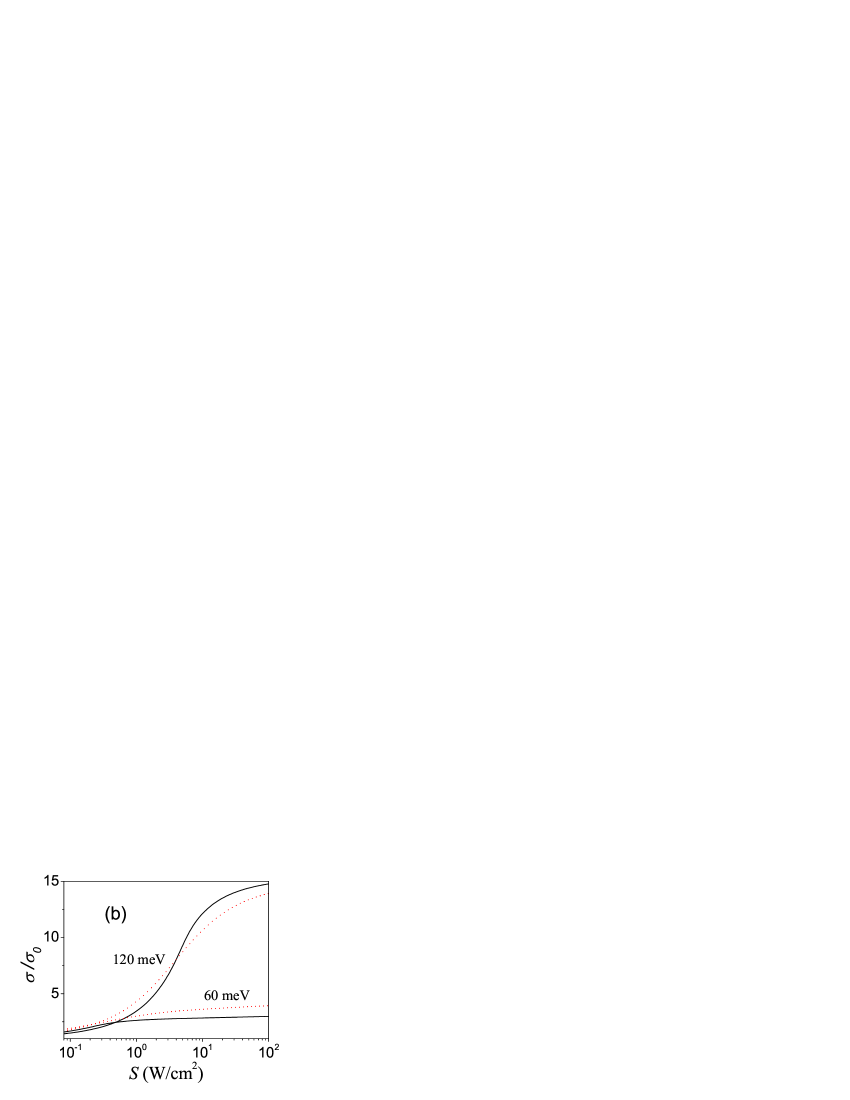
Figure 5 shows the dependences of the dc conductivity normalized by its characteristic value on the pumping power calculated using Eq. (7) with the distribution functions obtained in Sec. III for K and K and different pumping energies . The dependences are markedly nonlinear beginning from rather low pumping intensities (see the pertinent curves in Fig. 5a). The nonlinearity of the dc conductivity at low (1 mW/cm2) is particularly strong in the case K and far-IR pumping, meV, but the variation of conductivity does not exceed and becomes saturated at 5 mW/cm2. In the range of intermediate intensities of mid-IR pumping, see Fig. 5b, there is a power increase in the dc conductivity, which is followed by the saturation region. It is instructing that an increase in the pumping intensity by several orders of magnitude leads to a modest increase in .
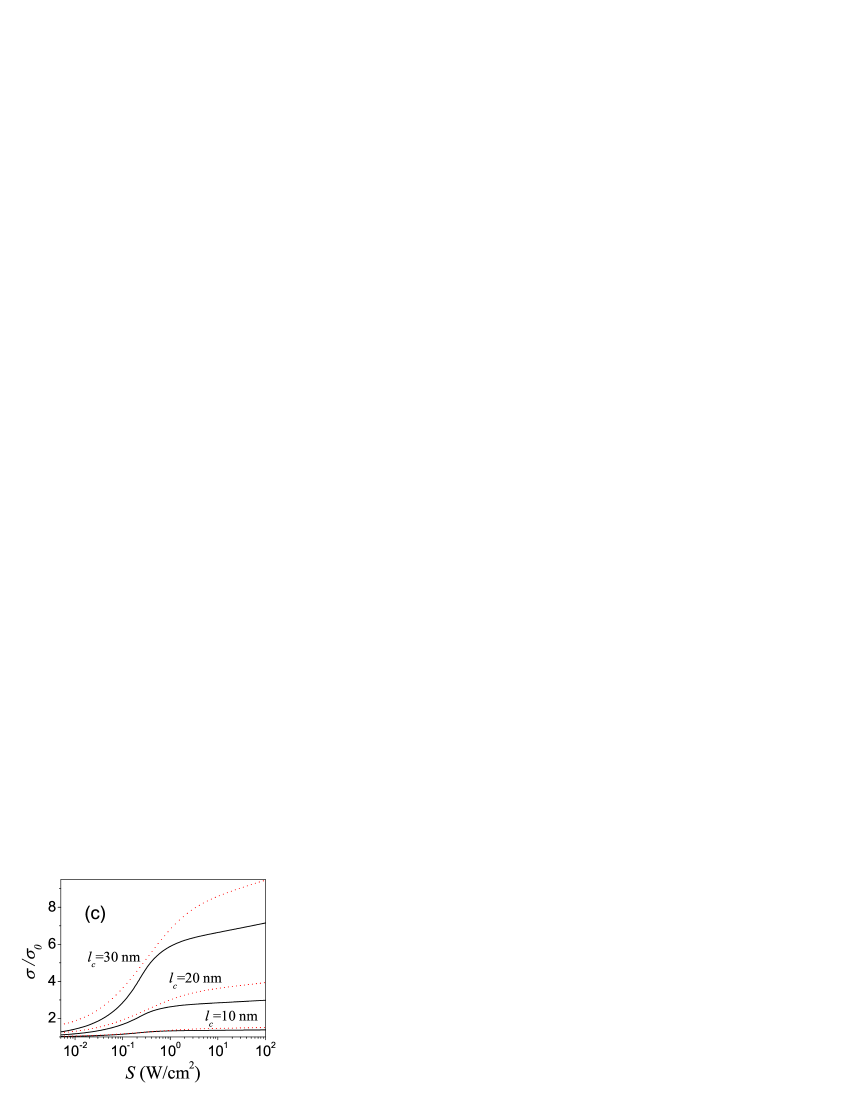
In Fig. 5c, the normalized dc conductivity as a function of the pumping intensity calculated for different values of the correlation length of the disorder scattering, . One can see that the conductivity becomes more sensitive to the pumping when parameter increases. If tends to zero, a quenching of photoconductivity takes place. Since the dc conductivity depends on , it, as a function of the pumping intensity, saturatates at higher intensities that the carrier concentration (compare Figs. 5 and 4).
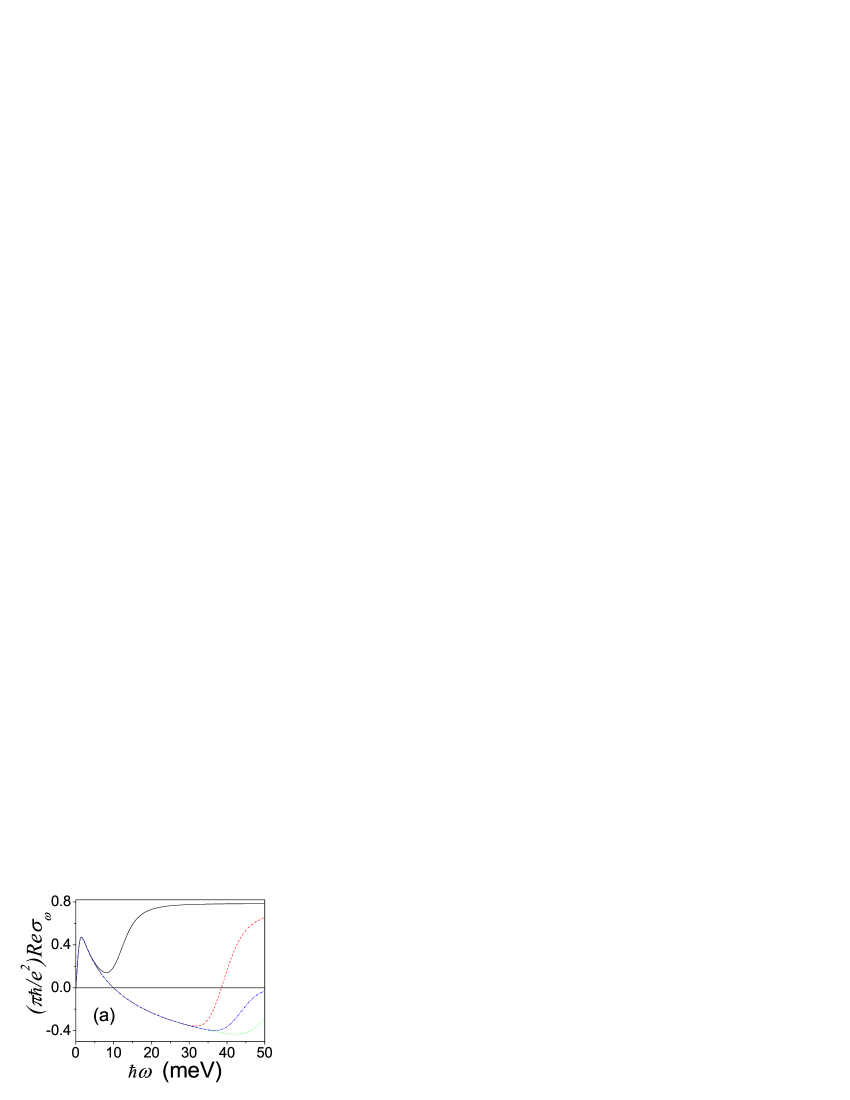
As seen from Figs. 2 and 3, the distribution function can be larger than in a certain energy range if the pumping power is sufficiently high. This corresponds to the population inversion of carriers and might be used for far infrared lasing. The real part of the interband contribution to the dynamic conductivity which is given by 9
| (8) |
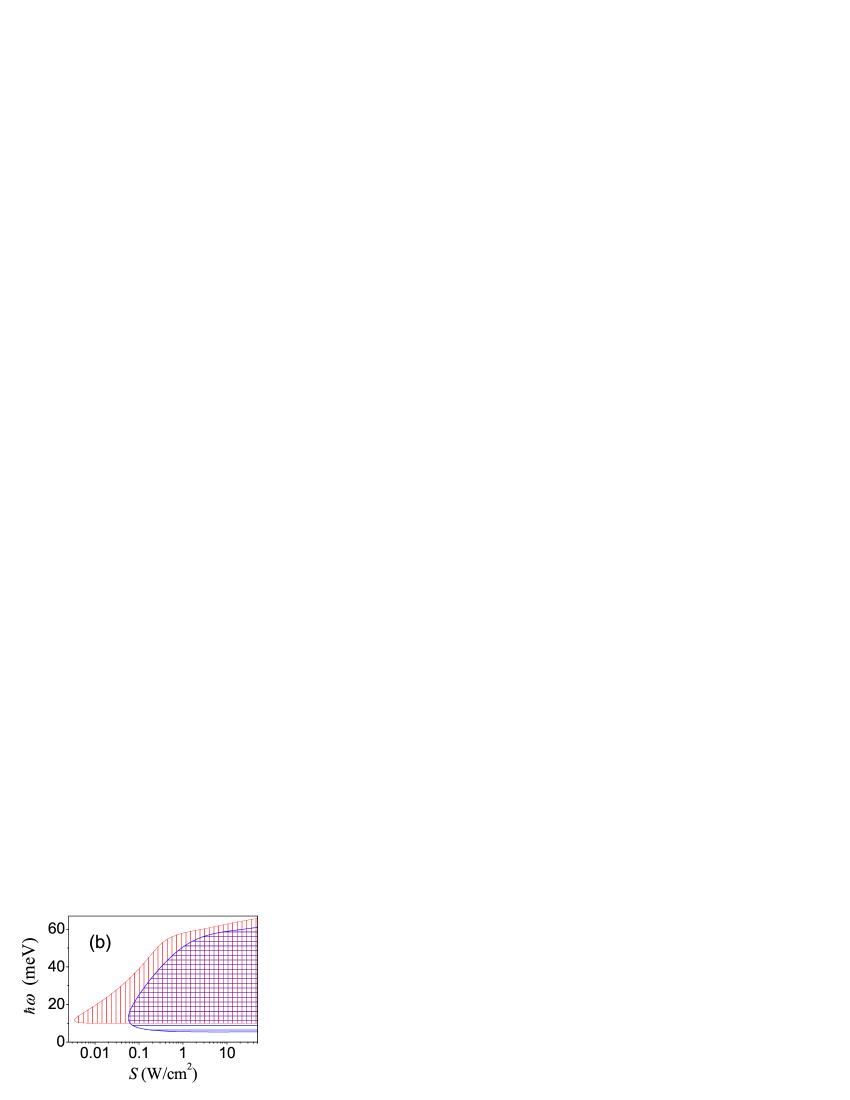
can be negative. Here and are introduced in a similar way to and in Eq. (3).13 . At 0 one obtains , if . Figure 6a shows the dependences of the real part of the interband dynamic conductivity (normalized by factor ) on the probe frequency at different pumping intensities . In contrast to the pumping scheme when the pumping energy exceeds the energy of optical photons, so that a cascade of optical phonons is emitted and the photogenerated electrons (holes) are accumulated near the conduction band bottom (valence band top), the negative dynamic interband conductivity in the case under consideration corresponds to the interband transitions with relatively high energies (compare with 16 ). Figure 6 shows the regions (shaded) on the pumping intensity - probe frequency plane corresponding to the negative dynamic interband conductivity at different temperatures. The dependence of the real part of net dynamic conductivity on the probe frequency , can be markedly modified by the contribution of the intraband transitions (which correspond to the Drude conductivity). However, the latter contribution can be effective only in the range of rather small frequencies .16
V Discussion and Conclusions
The main restriction the model used above is the neglect of the Coulomb interaction of carriers, so that the obtained results are valid at their sufficiently low concentrations. As can be found from Fig. 4, in the case of an intrinsic graphene, this assumption limits the validity of our model by the temperatures K, whereas the limitation imposed on the pumping intensity is fairly liberal. The latter is owing to the effect of saturation of the interband absorption associated with the Pauli principle. In our consideration we also disregarded more complex processes, namely, the carrier interactions with the substrate vibrations and the effect of disorder on the generation-recombination processes. The mechanism included in the model describe the general features of the relaxation processes considered, so that their refinement should not lead to a qualitative change of the pattern of the phenomena studied above. As for the photogeneration of carriers by incident far- or mid-infrared radiation, only the single-photon interband processes were taken into account. Hence, possible nonlinear frequency multiplication and renormalization of the energy spectra were disregarded. Our estimates show that the latter correspond to the limitations of the pumping intensity by the values MW/cm2 (at meV) and MW/cm2 (at meV). The other assumptions of our model (the isotropic energy spectra of carriers, the valley degeneration, and exclusion of the interaction with optical phonons in the range of energy under consideration) appears to be rather natural.
In summary, we calculated the energy distributions of carriers in an intrinsic graphene at low temperatures under far- and mid-IR ( meV) pumping in a wide range of its intensities (from zero to kW/cm2). It was shown that these distributions are determined by interplay between weak energy relaxation on acoustic phonons and radiative generation-recombination processes as well as by the effect of pumping saturation due to the Pauli principle. The obtained energy distributions at elevated pumping intensities can exhibit the plateau regions and the regions corresponding to the population inversion. The graphene dc conductivity as a function of the pumping intensity demonstrates a pronounced nonlinearity at fairly weak pumping (particularly at helium temperature), a steep increase in a certain range of intermediate intensities, and a saturation at sufficiently strong pumping. Due to this, the graphene dc conductivity varies through 1-2 orders of magnitude when the pumping intensity is varied many orders. We showed that the alteration of the graphene dc conductivity with far- and mid-IR irradiation, i.e., the effect of the photoconductivity is sensitive to the correlation length of disorder scattering.
Acknowledgments
The authors (A. S. and V. R.) are grateful to Professor T. Otsuji for stimulating discussions. This work was partially supported by the Japan Science and Technology Agency, CREST, Japan.
References
- (1) C. Berger et al., J. Phys. Chem. 108, 19912 (2004); K.S. Novoselov, et al., Nature 438, 197 (2005).
- (2) F. Guinea and N.M. Peres, Physics World 19 33 (2006); A.K. Geim and A.H. MacDonald, Physics Today 60, 35 (2007); A.H. Castro Neto et al., arXiv:0709.1163.
- (3) J.M. Dawlaty, et al., arXiv:0712.0119; T. Stauber et al., arXiv:0803.1802.
- (4) J.-C. Charlier et al., Topics Appl. Physics 111, 673 (2008).
- (5) J.M. Dawlaty et al., arXiv:0801.3303; D. Sun et al., arXiv:0803.2883, P.George et al., arXiv:0805.4647; S. Butscher et al., Appl. Phys. Lett. 91, 203103 (2007).
- (6) Z. Jiang et al., Phys. Rev. Lett. 98, 197403 (2007); R.S. Deacon et al., Phys. Rev. B 76, 081406(R) (2007).
- (7) E.M. Lifshitz, L.P. Pitaevskii, and V.B. Berestetskii, Quantum Electrodynamics, (Butterworth-Heinemann, Oxford 1982); P.R. Wallace, Phys. Rev. 71, 622 (1947).
- (8) P. Plochocka, et al., arXiv:0709.1324.
- (9) A. B. Kuzmenko et al., arXiv:0712.0835; T.G. Pedersen, Phys. Rev. B 67, 113106 (2003).
- (10) L. A. Falkovsky and A. A. Varlamov, Eur. Phys. J. B 56, 281 (2007); L. A. Falkovsky, arXiv:0806.3663; V. P. Gusynin et al., Int. Jour. of Mod. Phys. B 21, 4611 (2007).
- (11) F.T. Vasko and V. Ryzhii, Phys. Rev. B 77, 195433 (2008).
- (12) E.M. Lifshitz and L.P. Pitaevskii, Physical Kinetics, (Pergamon, Oxford 1981); F.T. Vasko and O.E. Raichev, Quantum Kinetic Theory and Applications (Springer, N.Y. 2005).
- (13) One can estimate the broadening energy as , so that . Here the characteristic velocity was introduced in Ref. 15 through the momentum relaxation time for the short-range scattering mechanism, .
- (14) The characteristic values of the energy relaxation and pumping, and , are introduced in Eq. (3) with the use of the energy relaxation, the generation-recombination, and the photoexcitation rates given by Eqs. (13), (10), and (7) of Ref. 11. Under numerical calculations we used the following parameyers of graphene: the deformation potential 12 eV, the sheet density 7 g/cm2, the sound velocity 7.3 cm/s and the dielectric permittivity (SiO2 - graphene structure).
- (15) F.T. Vasko and V. Ryzhii, Phys. Rev. B 76, 233404 (2007).
- (16) V. Ryzhii, M. Ryzhii, and T. Otsuji, J. Appl. Phys. 101, 083114 (2007); Phys. Stat. Sol.(c) 5, 261 (2008).
- (17) F. Rana, IEEE Trans. Nanotechnology 7, 91 (2008).
- (18) V. Ryzhii et al., Appl. Phys. Express 1, 063002 (2008).