1–4
Searching for transit timing variations in transiting exoplanet systems
Abstract
Searching for transit timing variations in the known transiting exoplanet systems can reveal the presence of other bodies in the system. Here we report such searches for two transiting exoplanet systems, TrES-1 and WASP-2. Their new transits were observed with the 4.2m William Herschel Telescope located on La Palma, Spain. In a continuing programme, three consecutive transits were observed for TrES-1, and one for WASP-2 during September 2007. We used the Markov Chain Monte Carlo simulations to derive transit times and their uncertainties. The resulting transit times are consistent with the most recent ephemerides and no conclusive proof of additional bodies in either system was found.
keywords:
Planetary systems, stars: individual (TrES-1, WASP-2), techniques: photometric1 Introduction
Transiting planets provide a wealth of information about exoplanetary systems. Short-term variations in the mid-eclipse times of the transits may reveal the presence of moons, trojans or other planets ([Holman & Murray (2005), Holman & Murray 2005], [Agol et al. (2005), Agol et al. 2005], [Ford & Holman (2007), Ford & Holman 2007]), whereas long-term variations could result from orbital precession ([Miralda–Escudé (2002), Miralda–Escudé 2002]). This provides further constraints on theories of planetary system formation and evolution, as well on theories of planetary atmospheres and their composition.
2 Observations and Data Reduction
We observed three transits of TrES-1 on UT 2007 September 12, 15, and 18, corresponding to epochs , 153, and 154 of the ephemeris given by [Winn et al. (2007), Winn et al. (2007)]:
| (1) |
and one transit of WASP-2 on UT 2007 September 13, corresponding to epoch of the ephemeris given by [Charbonneau et al. (2007), Charbonneau et al. (2007)]:
| (2) |
We used AG2, a frame-transfer CCD mounted at the folded Cassegrain focus of the William Herschel Telescope of the Isaac Newton Group, La Palma, Spain. AG2 is an ING-designed autoguider head with E2V CCD having a field of view (FOV) and a pixel scale of . We used a Kitt Peak R filter in order to minimize the effect of color-dependent atmospheric extinction on the differential photometry and the effect of limb-darkening on the transit light curve.
We observed under nearly perfect conditions on the nights of UT September 12, 13, and 18. On the night of UT September 15, we observed under scattered clouds in the second half of the night. On all nights, autoguiding ensured the positions of all stars on the CCD varied by no more than 3 pixels over the course of each night. We strongly defocused the telescope in order to minimize the effect of the pixel-to-pixel sensitivity variations, and also to enhance the duty cycle. The full-width at half-maximum (FWHM) of stellar images was 7 pixels for WASP-2 and ranged from 8 to 13 pixels for TrES-1. For TrES-1 for the three nights, we acquired 5, 10 and 10 second exposures, while for WASP-2 we used 7 second exposures.
We used standard IRAF111The Image Reduction and Analysis Facility (IRAF) is distributed by the National Optical Astronomy Observatories, which are operated by the Association of Universities for Research in Astronomy, Inc., under cooperative agreement with the National Science Foundation. procedures for the overscan correction, bias subtraction and performing the differential photometry. We did not use flat-fields to minimise the impact of position-angle dependent scattered light entering the aperture. Different aperture sizes were tried in order to find out the one that produced the minimum noise in the out-of-transit data. For TrES-1 for the three nights, the optimum aperture radii were 31, 31, and 34 pixels, while for WASP-2 it was 30 pixels. The sky background was subtracted, using an estimate of its brightness determined within an annulus centered on each star. Because of the strong defocusing and other field stars, we set an inner radius of the annulus equal to the aperture radius and used the width of 10 pixels. The comparison stars used were 2MASS: J19041058+3638409, J19040934+3639195, and J19040792+3640116 for TrES-1, and 2MASS: J20304846+0627355, and J20305168+0628008 for WASP-2. For each night, differential photometry was obtained by taking the ratio of the signal of the variable to the mean of the comparisons, both normalized by a smooth function of time.
To estimate appropriate error bars for our data, we used a procedure similar to that by [Narita et al. (2007), Narita et al. (2007)]. We first fitted the light curves with the analytic formulae of [Mandel & Agol (2002), Mandel & Agol (2002)] to find the differences between the data and the best-fitting model. We rescaled the error bars to satisfy , where is the number of the measurements in each light curve. For the three nights of TrES-1 we found that the true errors are higher by factors of 2.2, 1.6 and 1.9 respectively than the errors including only the Poisson noise, and for the one night of WASP-2 by a factor of 2.2. Differential photometry with these rescaled error bars and the best-fitting model (solid line) are shown in Fig. 1.
In order to estimate the amount of the time-correlated red noise, we solved the equations given e.g. by [Narita et al. (2007), Narita et al. (2007)]:
| (3) |
| (4) |
where is the standard deviation of each residual and is the standard deviation of the average of the successive points. We selected to correspond to about 20-50 minutes depending on the length of the interval with the correlated errors. is the white noise, which is uncorrelated and averages down as , is the red noise, which is correlated and remains constant for specified . We adjusted the error bars by multiplying and used these rescaled uncertainties for the subsequent fitting procedure.


| System | Epoch | Mid-transit time | Uncertainty |
|---|---|---|---|
| TrES-1 | 152 | BJD 2454356.41417 | 0.00010 |
| TrES-1 | 153 | BJD 2454359.44431 | 0.00015 |
| TrES-1 | 154 | BJD 2454362.47424 | 0.00020 |
| WASP-2 | 162 | BJD 2454357.39254 | 0.00016 |
3 The Model
We used the Markov Chain Monte Carlo simulations with the Metropolis-Hastings algorithm ([Ford (2005), Ford 2005]) to estimate the statistical uncertainties of the resulting parameters. We assumed a quadratic law of the limb darkening. For TrES-1, we fixed the system parameters according to [Winn et al. (2007), Winn et al. (2007)] and solved only for the transit times. For WASP-2, we fixed the parameters derived by [Charbonneau et al. (2007), Charbonneau et al. (2007)] and fitted the limb-darkening coefficients and the transit time. For each night, we created 10 independent chains, with the length typically 100,000 points in each chain. We checked the convergence of generated chains using the [Gelman & Rubin (1992), Gelman & Rubin (1992)] R statistic.
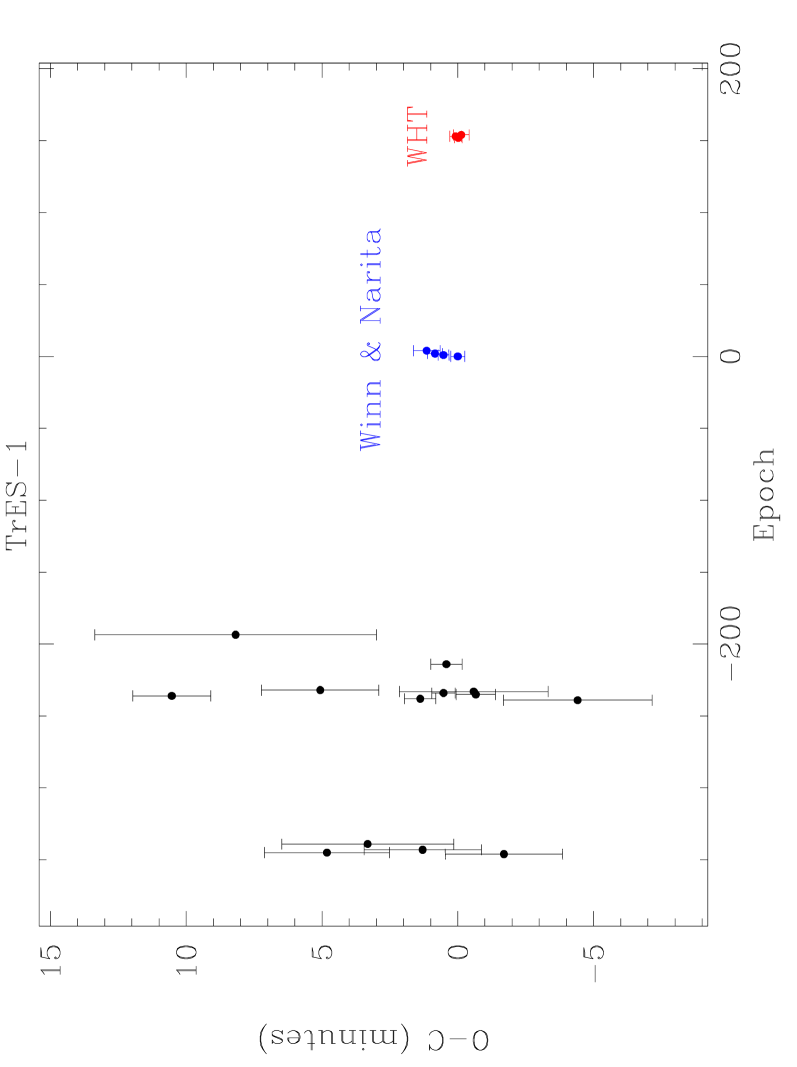
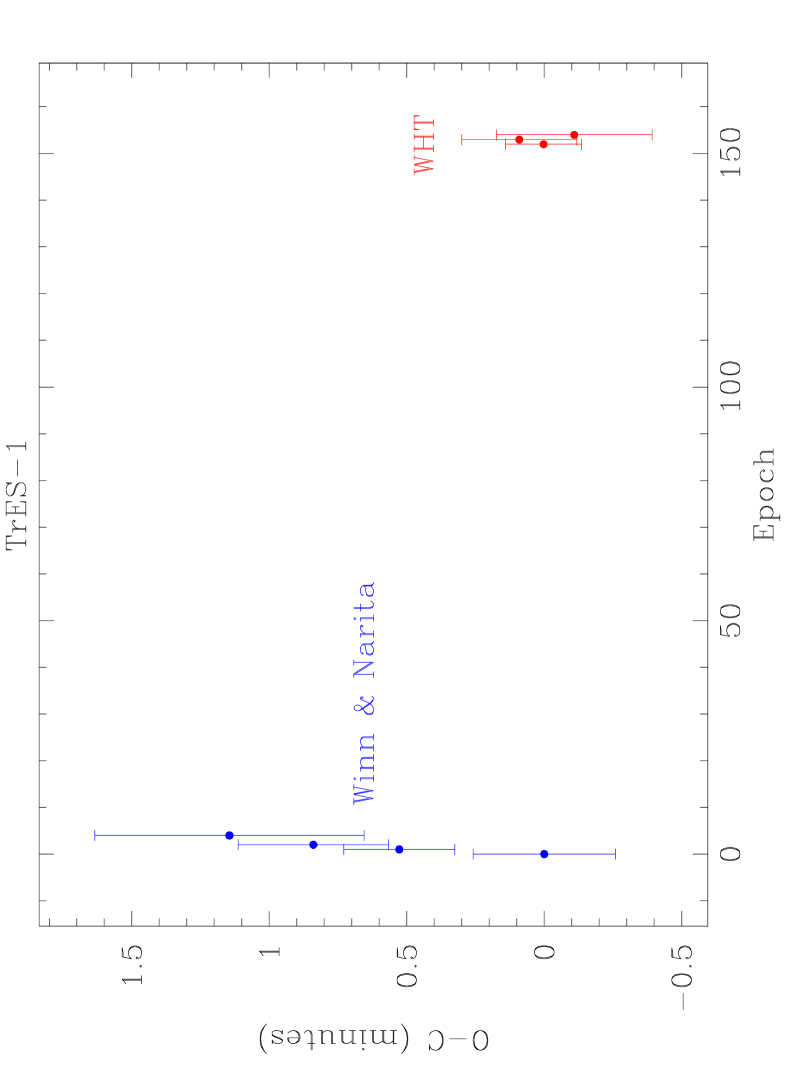
4 Results
The resulting barycentric transit times can be found in Table 1. Their uncertainties are given by the 68% confidence limits. The resulting residuals are plotted in Fig. 2 for TrES-1, and in Fig. 3 for WASP-2, using the ephemerides (1), and (2), respectively. In summary, our data provide no conclusive evidence of other bodies in either system but the systematic trend of residuals for TrES-1, found by [Winn et al. (2007), Winn et al. (2007)], is worthy of further study. For TrES-1, our 3 new transit times plus 1 by [Narita et al. (2007), Narita et al. (2007)] extend the interval covered by data for more than 150 cycles. We therefore used a weighted linear fit to the transit times as a function of epoch (weights inversely proportional to the squares of rms errors of individual transit times) to derive a more accurate ephemeris for the future transit predictions:
| (5) |

Acknowledgements.
The research was supported by the grants 205/08/H005 and 205/06/0304 of the Czech Science Foundation and also from the Research Program MSM0021620860 of the Ministry of Education of the Czech Republic.References
- [Agol et al. (2005)] Agol, E., Steffen, J., Sari, R., & Clarkson, W. 2005, MNRAS, 359, 567
- [Charbonneau et al. (2005)] Charbonneau, D., Allen, L. E., Megeath, S. T., Torres, G., Alonso, R., Brown, T. M., Gilliland, R. L., Latham, D. W., Mandushev, G., O’Donovan, F. T., & Sozzetti, A. 2005, ApJ, 626, 523
- [Charbonneau et al. (2007)] Charbonneau, D., Winn, J. N., Everett, M. E., Latham, D. W., Holman, M. J., Esquerdo, G. A., & O’Donovan, F. T. 2007, ApJ, 658, 1322
- [Ford (2005)] Ford, E. B. 2005, AJ, 129, 1706
- [Ford & Holman (2007)] Ford, E. B., & Holman, M. J. 2007, ApJ, 664, 51
- [Gelman & Rubin (1992)] Gelman, A., & Rubin, D. B. 1992, Stat. Sci., 7, 457
- [Holman & Murray (2005)] Holman, M. J., & Murray, N. W. 2005, Science, 307, 1288
- [Mandel & Agol (2002)] Mandel, K., & Agol, E. 2002, ApJ, 580, 171
- [Miralda–Escudé (2002)] Miralda–Escudé, J., 2002, ApJ, 564, 1019
- [Narita et al. (2007)] Narita, N., Enya, K., Sato, B., Ohta, Y., Winn, J. N., Suto, Y., Taruya, A., Turner, E. L., Aoki, W., Tamura, M., Yamada, T., & Yoshii, Y. 2007, PASJ, 59, 763
- [Winn et al. (2007)] Winn, J. N., Holman, M. J., & Roussanova, A. 2007, ApJ, 657, 1098