Probing feedback in protogalaxies: Multiphase gas in a DLA at
Abstract
We investigate the physical processes occuring in the multiphase gas of a damped Ly system (DLA). We base our analysis on a high quality Keck HIRES spectrum of the QSO J1211+0422 in which a DLA is detected at . There is little contamination of the high-ion (O VI, N V, C IV, Si IV) absorption, allowing us to explore the properties of the highly ionized gas and its connection to other gas-phases. The metallicity (), H I column density (H I), full-width velocity ( ) and relative abundances ( and ) of this DLA are not unusual. However, we derive the lowest C II* cooling rate in a DLA, erg s-1 per H atom (3). Using this stringent limit, we show that the neutral gas (confined at ) must be warm and the star formation rate is M⊙ yr-1 kpc-2. Surprisingly, the gas shows strong, complex absorption profiles from highly ionized gas whose kinematics appear connected to each other and the low ions. The total amount of highly and weakly ionized gas is very large with H IIH I. At , the gas is fully and highly ionized (HH , C IVC II, Si IVSi II). Based on ionization models, O VI and N V are generally difficult to produce by hard photons, while Si IV and C IV can be photoionized to a large extent. There is, however, no evidence of O VI-bearing gas at K associated with this DLA. In contrast, there is some evidence for narrow O VI, N V, and C IV components (unexplained by photoionization), implying too low temperatures ( K) for simple collisional ionization models to produce their observed column densities. Stellar feedback is a possible source for producing the high ions, but we cannot rule out accretion of non-pristine material onto the protogalaxy.
keywords:
cosmology: observations – quasars: absorption lines – galaxies: high-redshift – galaxies: haloes – galaxies: kinematics and dynamics1 Introduction
Damped Ly absorbers (DLAs) are defined as absorbers with H I (Wolfe, Gawiser, & Prochaska, 2005, and references therein). As such these absorbers are often treated as dominantly neutral entities. This characteristic separates the DLAs from the other intervening absorbers seen in the QSO sightlines, the so-called Ly forest (H I) and Lyman limit systems (H I ) where the neutral gas is a minor or non-existent phase. The presence of neutral, cold, and molecular gas is crucial to link the DLAs to star-forming galaxies (Wolfe, Prochaska, & Gawiser, 2003; Wolfe, Gawiser, & Prochaska, 2005; Howk, Wolfe, & Prochaska, 2005; Ledoux, Petitjean, & Srianand, 2003; Noterdaeme et al., 2008), although the exact nature of the DLAs and their relation to present-day galaxies is still under debate and study (Wolfe, Gawiser, & Prochaska, 2005; Wolfe & Chen, 2006; Rauch et al., 2008; Meiksin, 2008).
Surveys of DLAs have also shown systematic absorption from weakly (e.g., Al III) and highly (Si IV, C IV, N V, O VI) ionized species in DLAs (Lu et al., 1996; Wolfe & Prochaska, 2000a; Fox et al., 2007a, b), demonstrating a complex interstellar structure as observed in present-day galaxies. The detection of ionized gas, and more specifically highly ionized gas, is important because while high ions can be produced by hard photoionization, their ionization potentials are also high enough to be directly associated with galactic feedback following supernovae and stellar winds from massive stars (e.g., Kawata & Rauch, 2007).
Stellar feedback is important since it may produce galactic outflows that are the dominant mechanisms for enriching the intergalactic medium (IGM) with metals, as other dynamical processes, including ram-pressure stripping or tidal interactions between galaxies, are rather inefficient at polluting the IGM on large scales (e.g., Aguirre et al., 2001). Energetic feedback from stellar winds and supernovae not only pollutes the IGM but is also believed to serve as a regulator of star formation, even cutting it off altogether by super heating or removing (almost) all the gas from a galaxy. Hence stellar feedback is an essential ingredient for cosmological models of the formation and evolution of galaxies (e.g., Mashchenko, Wadsley, & Couchman, 2008; Dalla Vecchia & Schaye, 2008). For example, White & Frenk (1991) showed that without feedback, star formation is far too efficient compared to the observations. However, feedback is extremely difficult to model because it requires enough resolution to resolve individual supernova and the ability to model the complex hydrodynamic processes in a highly multiphase interstellar gas (e.g. Dalla Vecchia & Schaye, 2008). Characterizing feedback signatures via observations of the low and high Universe is therefore critical.
At all redshifts, evidence for outflows resulting from feedback processes has been discovered. High- Lyman break galaxies (LBGs) show signs of outflows (Pettini et al., 2001; Shapley et al., 2003), analogous to the complex, multiphase outflows seen in low- and intermediate- starburst galaxies (Heckman et al., 2000; Martin, 2006; Tremonti, Moustakas, & Diamond-Stanic, 2007; Weiner et al., 2008). At low redshift, winds have been found in even some modestly star forming galaxies such as the Large Magellanic Cloud (Lehner & Howk, 2007) and the Milky Way (Zech et al., 2008; Yao & Wang, 2007; Bland-Hawthorn & Cohen, 2003).
At , two important DLA surveys undertaken by Fox et al. (2007a, b) have revealed the statistical properties of the high ions associated with DLAs. They presented circumstantial evidence that C IV and O VI absorption at high velocities relative to the DLAs is associated with protogalactic outflows. However, there is not yet a detailed analysis of the high ions (O VI, N V, C IV, and Si IV) in DLAs in order to test their origin(s) (although for detailed analysis of a DLA with C IV and Si IV absorption, see Prochaska & Wolfe, 2002). Part of the difficulty is that, while C IV and Si IV have generally little contamination, N V absorption is weak and O VI is often mixed up in the Ly forest. Among the 9 QSOs with intervening DLAs presented by Fox et al. (2007b), there is not a single intervening DLA where these four ions and both transitions of each doublet are simultaneously detected, complicating the physical interpretation of their profiles. In particular, it is not clear if the apparent differences in breadth between the O VI and C IV component-profiles are because O VI probes truly hot gas or the O VI profiles are significantly blended with intervening Ly absorbers.
In this work, we analyze a Keck/HIRES spectrum of the QSO J1211+0422 (SDSS J121117.59+042222.3, ) in order to study the DLA at observed along this sightline. This DLA, not surprisingly, shows high-ion absorption. Remarkably, however, the profiles of the high ions, as well as other tracers of neutral and weakly ionized gas, have little contamination from other intervening absorbers, allowing us to pursue detailed modeling of their profiles. Notably, both lines of the N V doublet, while weak, are well detected. The O VI doublet is partially tainted by Ly forest, but there is enough information in each transition to interpret the O VI. With our detailed modeling, the main issues we address in this work are the connection of the highly ionized with the neutral and weakly ionized gas, the origin(s) of the highly ionized gas in DLAs at , and a search for possible feedback signatures.
The outline of this paper is as follows: in §2 we describe the observation, give an overview of the velocity structure in the DLA, present the analysis techniques and results (kinematics, column densities, and -values of the high ions). In §3 we present and discuss the results for the low-velocity gas ( ), while in §4 the higher-velocity ( ), fully ionized gas is presented. In §5 we discuss some of the properties of this DLA in the context of other studies. Our main results are summarized in §6.
2 Observations and Analysis
2.1 Data reduction
The data presented here were collected using the upgraded High Resolution Echelle Spectrometer (HIRES; Vogt et al. 1994) on the Keck I telescope on 3 May 2005. The total exposure time was 2.5 hours. The HIRES upgrade that took place in 2004 replaced the previous single CCD with a new three CCD mosaic, including two CCDs with enhanced blue sensitivity compared with the earlier instrument. The MIT/Lincoln Labs CCDs (15 µm pixels) were binned by 2 pixels () in the spatial direction and have 1.3 pixels in the dispersion direction. All data were collected using the UV cross disperser and the C1 decker, which has a slit width, giving a spectral resolution of or 6.6 km/s for a source filling the slit. The seeing was approximately .
The reduction and extraction of the raw data used the HIRedux package (v2.2) of J.X. Prochaska, which is distributed with the XIDL routines.111Available through: http://www.ucolick.org/xavier/IDL/. We refer the reader to the documentation for details. In short, the two-dimensional echelle images were bias-subtracted, flat-fielded, and wavelength-calibrated using the HIRES ThAr and quartz (flat field) lamps. One-dimensional spectra are extracted using an optimal extraction routine, and individual exposures and orders were co-added with an inverse variance weighting. A continuum was fit to each order before coaddition to remove the effects of the blaze. The signal-to-noise per resolution element is between 35 and 45. For the figures showing the profiles and apparent column densities, the spectra were binned by 3 pixels (however, the profile fitting and apparent optical depth measurements described below were realized with the fully sampled spectra).
2.2 Kinematics overview
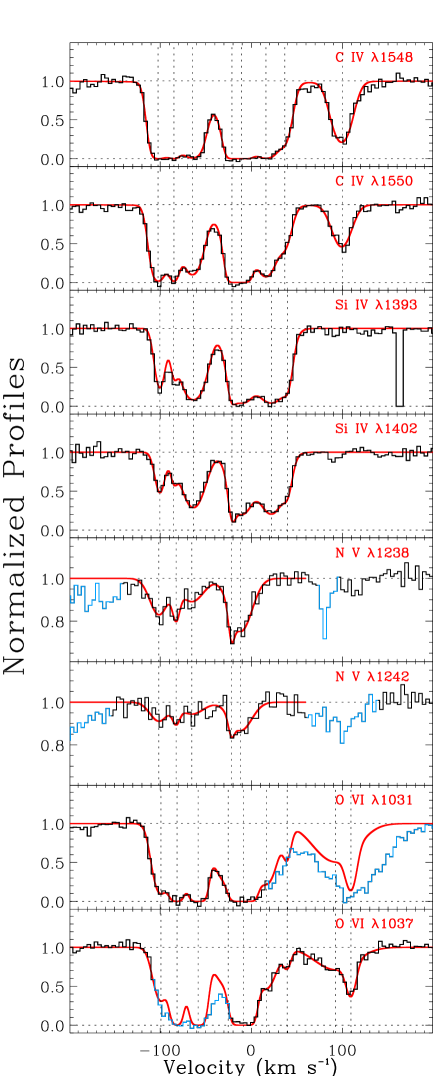
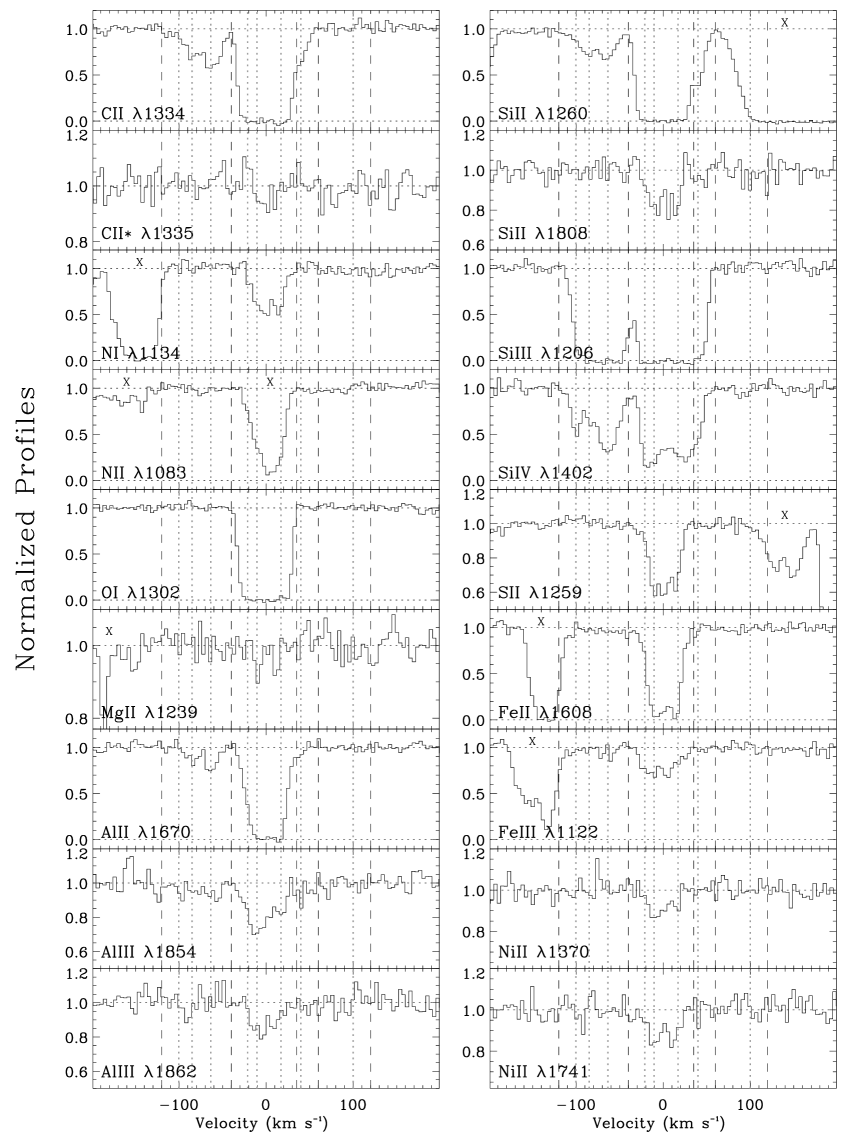
The normalized profiles of C IV, Si IV, N V, O VI are shown in Fig. 1 against the rest-frame velocity at (determined from Si II 1808 and O I 1039,1302), while in Fig. 2, we show the normalized profiles of the neutral and weakly ionized species. The profiles show complex kinematics that we separate into four main absorption components according to their velocity spread: the negative high-velocity component (NHVC) with , the low velocity component (LVC) with , the component, and the positive high-velocity component (PHVC) with .
The LVC is associated with the main DLA component, which is in part neutral (strong saturated O I), but has also weakly and highly ionized species present. The NHVC is more ionized than the LVC since no O I or N I absorption is detected and is also highly ionized since C IV absorption is saturated and the strong transition of C II 1334 is not. For similar reasons, the component also appears nearly fully and highly ionized. Finally, the PHVC is very highly ionized with only detection of C IV and O VI (and possibly N V). In this work, we would like to understand the relationship (if any) of the observed highly ionized species with the other neutral and low ionized species (in particular, if relatively simple ionization models can reproduce the observed properties of the ionized gas), and discern the origin(s) of these different components and the relationship with each other (if any). This requires that we first model the high-ion absorption, which we detail in the next section.
2.3 Kinematics and column densities of the high ions
To determine the basic properties of the high ions, our approach is twofold: (1) a detailed modeling of the absorption assuming the gas can be modeled by Voigt profiles, (2) a simpler approach using the apparent optical depth method.222To estimate the column densities in this work, we use the atomic parameters compiled by Morton (2003), except Ni II 1370 that is from Jenkins & Tripp (2006).
The absorption profiles of the high ions have several components, which we model using the Voigt component fitting software of Fitzpatrick & Spitzer (1997) where the instrumental line spread function was modeled with a Gaussian with a full-width at half maximum of 6.6 . Each doublet was fitted simultaneously, but each ionic species was fitted independently (except for two strong C IV components where we fix their velocities from Si IV, see below). We started by fitting the Si IV doublet because it is strong enough to see most of the components but not so strong that saturation is a problem. Our strategy was first to determine the obvious components ( ) and then add additional components, keeping them if the of the fit improved significantly. This resulted in the first 7 components summarized in Table 1. We note that the fit has some discrepancies in the core of the NHVC components in the Si IV 1393 profile but not observed in Si IV 1402, which we attribute to possible contamination from another intervening absorber (we therefore put more weight on Si IV 1402 profile for the fit, but see below). There is also some discrepancy between the fit and the data near and , but adding more components did not improve the fit to the data. Yet since the main component of the DLA is near 0 , this could suggest the need to add an additional component near this velocity; doing so the fit produced a component at 3.6 , but with very uncertain -value and column density ( dex) (note that adding this component did not change significantly the parameters for the other components). The reduced- also only changed marginally from 1.08 to 1.04. Thus, we adopt the result in Table 1 as our best model. While the results of this fit may not be unique, they are robust since if we modify the input parameters, the solution of the fit converges to the one summarized in Table 1. However, it is important to bear in mind that the results from fitting complex profiles assume no hidden components (e.g., narrow or broad components) and the errors produced from the fitting code are only valid for the adopted number of components. That is a reason it is important to also investigate the profiles with another method (see below).
The profiles of the C IV doublet are more complicated because the absorption is very strong in both lines. In particular, the flux from to for both lines reaches zero, and therefore we force the centroid-velocities found from Si IV in this velocity range. The column densities and -values in this velocity range remain, however, largely unknown. Except for those two velocities, all the other parameters () were allowed to vary. The C IV profiles reveal an additional component not observed in Si IV, the so-called PHVC at about . We fitted the PHVC with one component because while the over sampled profiles present some asymmetry, there is no real evidence for more than one component (see below). The overall fit to C IV is not as good as the model of Si IV because the C IV profiles are stronger. The fit reveals, however, a very close correspondence in the kinematics between C IV and Si IV at least for the NHVC and the component at about 20 and 40 .
The N V doublet is much weaker but is clearly observed in both lines between and . Although there is little information on the -values, the component-centroids are coincident with those of Si IV and C IV. The PHVC is partially contaminated in N V 1238 and fully contaminated in N V 1242. The column density reported in Table 1 for the PHVC is estimated from the direct integration of the profiles (using the apparent optical depth method, see below) where the narrow and weak absorption at was removed.
Finally, the O VI 1031, 1037 profiles are certainly the most complicated to model because they are so strong and because both lines are partially corrupted by other intervening absorbers. In regions where the profiles are contaminated (blue part of the spectra in Fig. 1), we use only one transition of the doublet and we assume that the used transition is not contaminated by intervening Ly forest absorbers. The velocity-centroids match quite well the velocities of the other high ions for . At , O VI 1031 is blended with a strong absorber and it is not clear if O VI 1037 could be partially blended as well since the velocity structure is different than that of C IV. We report in Table 1 a two-component fit to the PHVC, but owing to the uncertainty of possible blending, we will adopt the result from the apparent optical depth method (see below). However, it is worth noting that the component is too narrow to be a Lyman intervening feature (see, e.g., Kirkman & Tytler, 1997).
| Ion | Note | |||
|---|---|---|---|---|
| () | () | (cm-2) | ||
| Si IV | ||||
| C IV | ||||
| N V | ||||
| O VI | ||||
Note: The colons after a value or a 1 error indicate that the measurements are likely more uncertain than the formal errors derived by the profile fitting. : The 3 error is estimated using Si IV 1393 based on the centroid and width of the C IV profile at this velocity. : The “” indicates that the absorption reaches zero flux in both lines and therefore those are likely lower limits and in all cases remain very uncertain. : For these components, we fix the velocity centroids to those of Si IV. : The 3 error is estimated using N V 1238 based on the centroid and width of the C IV profile at this velocity (see § 2.3 for more details). : The ”” symbol indicates that N V 1238 is partially contaminated; N V 1242 is completely contaminated and cannot be used. : It is possible that O VI 1037 is partially contaminated by an intervening system, which is emphasized by the “” sign (see § 2.3 for more details).
The -value derived from the profile fitting can be used to estimate the temperatures of the high ions for each component. In Table 2, we list the temperature of the gas derived from the observed broadening of the absorption Si IV and/or C IV lines. If C IVSi IV) then can be determined from , where is the non-thermal component and the other symbols have their usual meaning. If C IVSi IV) only an upper limit on the temperature can be derived because we cannot estimate the non-thermal broadening. We assume here that C IV and Si IV reside in the same gas (we will discuss in §§3, 4 that this may not be always the case). We did not use N V or O VI, as their -values are generally more uncertain and these ions possibly exist in different phases (i.e. at different temperatures) than C IV or Si IV. Indeed the excitation potentials are 113.9 eV, 77.5 eV, 47.9 eV, and 33.5 eV for O VI, N V, C IV, and Si IV, respectively. Therefore, O VI and N V are a priori better diagnostics of shock-heated gas than C IV and Si IV, while photoionization is likely more important for C IV and Si IV. Half of the component sample may imply temperatures of a few times K gas if thermal broadening dominates. The other half implies temperatures much cooler, a few times K or less.
| Component | Name | ( K) |
|---|---|---|
| NHVC | ||
| NHVC | ||
| NHVC | ||
| LVC | ||
| LVC | ||
| LVC | ||
| PHVC |
Note: : Temperature estimated from the broadening of Si IV and/or C IV (, where and are in ).
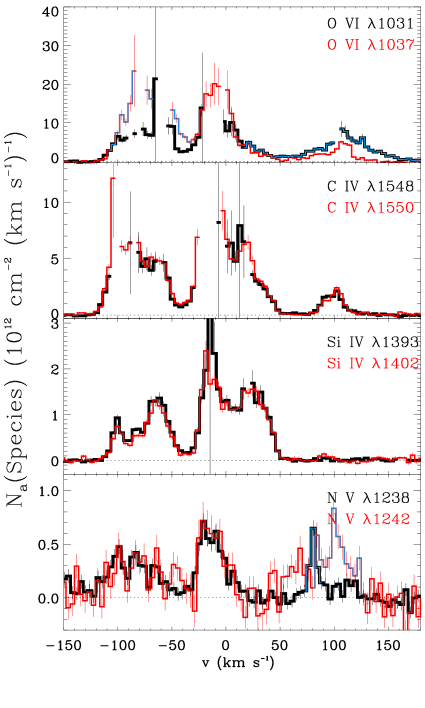
We also explore the high-ions profiles with a method that does not rely on knowing the velocity distribution in these profiles. The apparent optical depth (AOD) method (see Savage & Sembach 1991) provides such a method. In this method, the absorption profiles are converted into apparent column densities per unit velocity , where is the continuum flux, is the observed flux as a function of velocity, is the oscillator strength of the absorption and is in Å. This method also allows us to directly check the saturation in the profiles by comparing the line of the same species with different , and in case the absorption is not saturated, provides a direct estimate of the true column density. Another advantage of this method is that it is straightforward to check for any variation in the ratio of with velocities for various species.
In Fig. 3, we show the apparent column density profiles for each doublet. There is a good overall agreement between the profiles of Si IV 1393 and 1402, except in the cores of the various components, where Si IV 1393 appears stronger; but this contamination is small since since and cm-2 and and cm-2 for Si IV 1393 and 1402, respectively. This shows that, despite the absorption being quite strong, the profiles of Si IV have essentially no unresolved saturation. The N V doublet is weak and fully resolved between and . For , N V 1242 is lost in another intervening absorber. For C IV, only parts of the profiles are resolved. For O VI, we further see that we need to rely on only one line in several portions of the absorption.
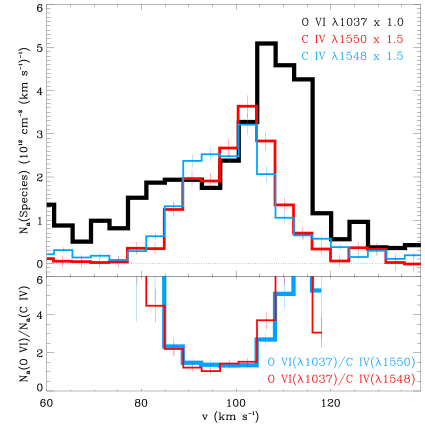
In Fig. 4, we zoom in on the profiles near the PHVC. The profiles of the C IV doublet agree very well in the wing of the profiles. There is some discrepancy between and 107 , but not in a systematic manner, and within the noise level both lines give a similar column density since and cm-2 for C IV 1548 and 1550, respectively (note that the AOD result is fully consistent with the column density derived from the one component fit). This figure also shows clearly the difference between O VI and C IV with an increase in the O VI/C IV ratio at the edge of the C IV profiles where the O VI absorption is still important. It is not clear if those differences at and are real since O VI 1037 may be partially blended.
Finally, in Fig. 5, we compare the column density ratios of the high ions obtained from the AOD and profile fitting. We use Si IV as the reference ion. For the AOD, we only plot part of the profiles that do not reach zero flux and we use weak lines of the doublet for C IV and Si IV, the strong line of the N V doublet, and non-contaminated part of the O VI doublet. In view of the complexity of the profiles, there is a good overall agreement between the two methods (when the lines are not saturated), giving us confidence in the results of our fits outside the regions where the profiles are completely saturated. However, we emphasize that the column densities reported in Table 1 at and for C IV and O VI, respectively, are totally uncertain. In the remaining of the text, we will only use the lower limits reported in Table 4 that are based on AOD estimates.

3 The low-velocity multiphase gas
3.1 Overview
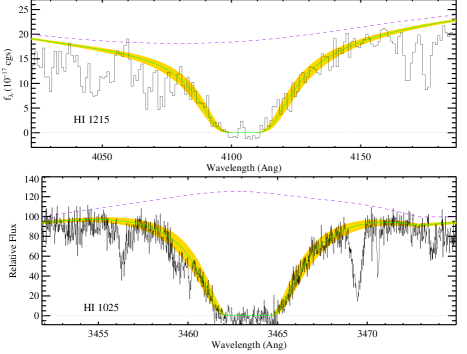
We define the LVC as being the absorption observed between about and where most of the neutral gas is found. The O I profile in Fig. 2 traces the velocity distribution of neutral gas, noting that O I is one of the best tracers of neutral hydrogen since its ionization potential and charge exchange reactions with hydrogen ensure that H I and O I are strongly coupled. The LVC has a complex multiphase structure of neutral gas (O I, N I), ionized gas (N II, Al III, Fe III), and highly ionized gas (O VI, N V). The LVC differentiates itself from the other components at higher absolute velocities by the fact that it is only between and that strong atomic absorption (O I, N I) is observed; in contrast the components at higher absolute velocities are nearly fully ionized as we show in §4. The presence of neutral gas allows us to directly estimate the metallicity of the gas probed (see §3.2). In Table 3, we summarize our column density and abundance estimates for the LVC where for the species other than H I, the column densities were estimated via the AOD method (see §2.3). The H I column density is derived from a simultaneous fit to the damped wings of Ly (from SDSS) and Ly (following Herbert-Fort et al., 2006), and we show the fit to those lines in Fig. 6.
For the high ions, the LVC has at least 3 components derived from the fits. Inspection to the S II profile also reveals that the main absorption can be broken-up in 3 components with velocities centered at . Such structure cannot be seen in O I because the profile is completely saturated, but the velocity structure of N I is consistent with S II. O I reveals another component at , which is also seen in the high ions. In Fig. 2, we show that except for the component at 0 the velocity- centroids of the high ions match quite well those of the low ions, suggesting some kinematic relation between the weakly and highly ionized phases. The zero velocity component is not included in our fits to the high ions, but as we discussed in §2.3, the fit for the high ions may not be unique and can certainly accommodate a component at .
3.2 Absolute and relative abundances
To derive the metallicity, it is usually best to use neutral or singly-ionized species that follow the neutral hydrogen to avoid large ionization correction since only H I can be directly estimated. The O I absorption is so strong that only a firm lower limit can be placed on the oxygen abundance of the DLA (see Table 3). Because of the nucleosynthetic evolution, nitrogen is often deficient with respect to the other elements (Lu, Sargent, & Barlow, 1998; Prochaska et al., 2002a; Henry, Edmunds, Köppen, 2000; Henry, Nava, & Prochaska, 2006; Petitjean, Ledoux, & Srianand, 2008, and see below), and this is observed in this DLA since N, where the -element is here Si (see Table 3 and also §3.3). Nitrogen therefore does not provide a good metallicity indicator.
In the next section, we show that the singly-ionized species (excluding N II) predominantly arise in the neutral gas, and therefore these ions can be directly compared to H I. Sulfur appears not to be depleted into dust and silicon is usually very mildly depleted in DLAs, and in this DLA suggests as well no dust depletion of Si. Using these two elements, we derive the metallicity of the DLA, , based on the -elements S and Si.
| Species X | X | XH |
|---|---|---|
| H I 1025,1215 | ||
| C I 1560 | () | |
| C II 1036 | ||
| C II* 1335 | () | |
| C IV 1550 | ||
| N I 1134 | ||
| N II 1083 | ||
| O I 1039 | ||
| Mg II 1239 | ||
| Al II 1670 | ||
| Al III 1854,1862 | () | |
| Si II 1808 | ||
| Si III 1206 | () | |
| Si IV 1402 | () | |
| S I 1425 | () | |
| S II 1250,1259 | ||
| Ar I 1066 | ||
| Fe II 1063,1144,1608 | ||
| Fe III 1122 | () | |
| Ni II 1370,1709,1741 |
Note: Errors are 1. Upper limits (“”) are 3 estimated over , full velocity-width of the weak absorption (e.g., Si II 1808). : Throughout the text we use the following notation (solar abundances are from Asplund et al. 2006); if is a dominant ionization stage in neutral gas, XH indicates the abundance of a given species X. Estimates within parentheses do not represent a species in a dominant ionization stage, and therefore not the overall abundance of the gas (see text for more details). “” indicates that N II is likely contaminated.
Nucleosynthesis and dust depletion both play a role in the gas-phase abundances of the elements in DLAs (e.g., Lu et al., 1996; Pettini et al., 1999; Prochaska & Wolfe, 2002), but disentangling these effects is extremely difficult and requires more elements than available here. However, the low N ratio implies that nucleosynthesis is important since N is not depleted into dust and N I is not affected by ionization in this case. This low N ratio is often explained as a time delay between the production and injection of N into the gas compared with -elements. The -elements (including O, Si, S) are mainly produced by short-lived massive stars () through explosions of Type II supernovae (SNe), while N in low metallicity gas is believed to be principally formed in intermediate-mass stars () and injected into the interstellar gas through stellar mass loss. The same low and intermediate-mass stars also produce the bulk of the Fe-group elements through Type Ia SNe. Therefore the -element to Fe-peak element ratio should be systematically enhanced in low metallicity environments. This is observed in low metallicity stars in our Galaxy, where (e.g. Nissen et al., 2007). In the present DLA, and (where Si II, but as noted above the use of S II would not have changed the results). These values are consistent with others in DLAs, although on the low side. The enhancement coupled with and N is consistent with a Type II SN enrichment (Prochaska & Wolfe, 2002; Henry & Prochaska, 2007), i.e. the relative abundances in this DLA could be explained by nucleosynthesis alone.
On the other hand, in our Galaxy, elements become less and less depleted as the gas changes from cold to warm phases (see, e.g., Savage & Sembach, 1996). Assuming now that nucleosynthetic effects are negligible, the low depletion of Fe and Ni with respect to those in other DLAs with similar metallicities suggests that the neutral gas is likely to be mostly warm. As we show below the Cloudy simulation and the absence of C II* absorption also support that the neutral gas is warm. An intrinsic solar at may imply that the star formation occured slowly, allowing a large Fe pollution from type Ia SNe (Matteucci, 2001), but this contradicts the extremely low ratio. More likely, the regions where star formation occurs are very localized and are not directly probed by the J1211+0422 sightline. Hence the gas may be indeed warm with little dust along the line of sight. Both effects from nucleosynthesis and dust depletion may be present, but it is not possible to disentangle these subtle effects at the 20% (0.1 dex) level (without mentioning possible uncertainties in the atomic parameters or ionization correction, see §3.3). The recent non-LTE abundances of S and Fe of Galactic halo stars with seem to imply that (Nissen et al., 2007), allowing both some Fe and Ni depletion and nucleosynthesis effects to occur if the DLA nucleosynthetic history follows that of Galactic halo stars. In §3.4, we assume that the Fe depletion is dex (see discussion in Wolfe, Prochaska, & Gawiser, 2003; Wolfe et al., 2004), which still allows for an -element enhancement over Fe of 0.1 dex attributable to nucleosynthesis at the 1 level.
| Species | |||
|---|---|---|---|
| C I | 11.9 | 11.7 | |
| C II | 15.8 | 15.8 | |
| C II* | 12.5 | 12.4 | |
| C IV | 12.9 | 13.4 | |
| N I | 15.2 | 15.2 | |
| N II | 14.2 | 14.2 | |
| N V | 10.6 | 11.2 | |
| O I | 16.1 | 16.1 | |
| O VI | 8.8 | 9.7 | |
| Mg II | 14.9 | 14.9 | |
| Al II | 13.8 | 13.8 | |
| Al III | 12.8 | 12.9 | |
| Si II | 14.9 | 14.9 | |
| Si III | 13.8 | 14.1 | |
| Si IV | 12.8 | 13.2 | |
| S II | 14.4 | 14.4 | |
| Ar I | 13.1 | 13.0 | |
| Fe II | 14.9 | 14.9 | |
| Fe III | 13.8 | 13.9 | |
| Ni II | 13.6 | 13.6 |
3.3 Ionization
The comparison of the apparent column densities of Si IV and Si II shows that the gas traced by singly ionized species is far more important between about and . In contrast the ratios of doubly-ionized species (Al III and Fe III) to Si IV show only little variations between to , suggesting some connection between these ions and that ionization may be important. The N V/Si IV ratio also steadily increases from to , implying that the gas becomes more highly ionized at more negative velocities. Although the O VI absorption is too strong to directly use for the column density ratios, the O VI absorption is also far stronger at than at (see Figs. 1 and 3).
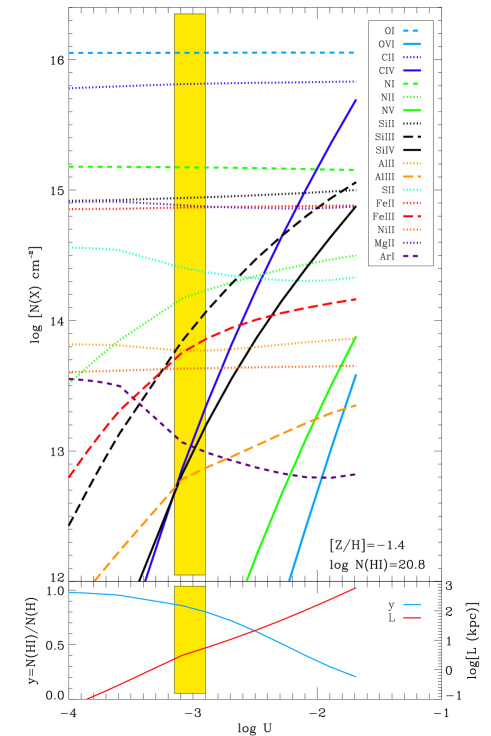
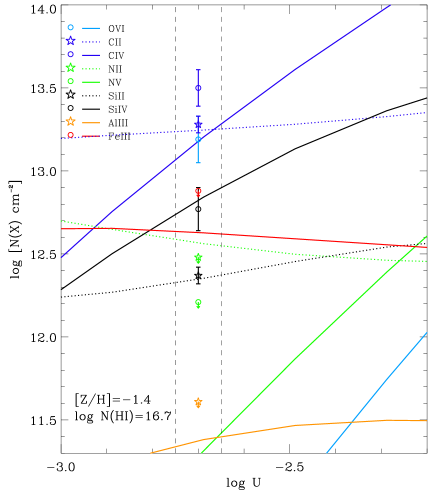
We first investigate whether photoionization can explain the observed properties of the absorbers. We used the photoionization code Cloudy version C07.02 (Ferland et al., 1998) with the standard assumptions there has been enough time for thermal and ionization balance to prevail. We model the column densities of the different ions through a slab illuminated (on both sides) by the Haardt & Madau (2008, in prep.) UV background ionizing radiation field from quasars and galaxies and the cosmic background radiation appropriate for the redshift and maintained in this case at constant pressure (condition not set for the Cloudy simulations of the higher-velocity components). The Cloudy simulations also assume a priori solar relative heavy element abundances from Asplund, Grevesse, & Sauval (2006). We then vary the ionization parameter, H ionizing photon density/total hydrogen number density [neutral + ionized], to search for models that are consistent with the constraints set by the column densities and -values.
We show in Fig. 7 the result of such a Cloudy simulation for the LVC where (see §3.2) and where the H I column density matches the measured value. We use the total column densities rather than modeling each component because i) the ratios of Fe III/Si IV and Al III/Si IV show little variation over the LVC velocity range, ii) the total column densities are likely less uncertain than the column densities of the individual components since they do not rely on a particular kinematic model, and iii) the H I column density in the individual components is unknown. The yellow region shows the range of possible solutions () that fits the column densities of the neutral, singly- and doubly-ionized species within –0.2 dex. For and , column densities for the various species are reported in Table 4, showing an overall agreement between the model and the observations, except for N I. The low abundance of N can be understood in terms of nucleosynthetic evolution (see above): using N I, we find N (N II is contaminated by an unknown amount and is anyway important only in ionized gas). From Table 4, we also note some discrepancies with Fe II and Ni II (although it is within dex), which can be interpreted as these species being in part depleted into dust or as a nucleosynthetic effect (see §3.2). However, if in the ionized phase Fe is depleted into dust or deficient relative to -elements as a result of nucleosynthesis, the discrepancy between the model and observations would increase for Fe III, possibly pointing to the need of another ionizing source (see below).
The overall good agreement between the model and the observation is quite remarkable in view of the complexity of the profiles and the possible effects of dust and nucleosynthesis. We note that although the agreement would be better for S II if , smaller ionization parameters are inadequate because too much Ar I would be produced. Ar I (where here is Si II) favors the present model rather than a softer stellar spectrum. Indeed, since Ar is not depleted into dust and is an -element, the observed Ar I deficiency is due to photoionization (Sofia & Jenkins, 1998; Prochaska & Wolfe, 2002). In our own Galaxy, partially photoionized gas leads to a deficiency of the neutral form of Ar (Sofia & Jenkins, 1998; Jenkins et al., 2000; Lehner et al., 2003), but it is generally mild compared to the high redshift systems (Vladilo et al., 2003). A harder spectrum (i.e. a UV background from QSOs only) would, however, produce a more discrepant model, e.g., S II and Fe III would be more difficult to match simultaneously.
This model implies that the singly-ionized species (C II, Si II, Mg II, Fe II, Ni II, and S II, although the latter may be more subject to ionization correction as illustrated in Fig. 7) principally trace the neutral gas. The ionization fraction (H II/H) is about 12–20% (not taken into account the high ions, see below). The “average” linear size, , of the layer of gas in this model is 2–6 kpc, which seems acceptable for a protogalaxy at (note that for absorbers with multiple components, given by Cloudy should be treated as an upper limit). We noted a close kinematic correspondence between the ionized and neutral gas is consistent with the picture of an external UV source that ionizes the external layer of the neutral gas.
The Cloudy photoionization simulation, however, fails to produce enough Si IV, C IV, N V and O VI (by orders of magnitude for C IV, N V and O VI see Table 4), which implies that these ions must be produced by other means, such as collisional ionization processes. Such a conclusion was also drawn by Fox et al. (2007b) in another DLA. We note if , the modeled and observed column densities of Fe III and Si IV would be similar. This solution would also contribute to a significant amount of C IV, but would require Al to be deficient by dex compared to Si and Fe. Sulfur would be underproduced by about 0.2 dex. Such a solution would also require a very large path length (40 kpc) and would nevertheless fail to produce enough O VI and N V columns. Therefore this solution is less compelling than the solution.
Collisional equilibrium (CIE) and non-equilibrium collisional ionization (NECI) may also be important sources of ionization, particularly for producing high ions (Sutherland & Dopita, 1993). Recently, Gnat & Sternberg (2007) have produced new calculations of CIE and time-dependent radiative cooling gas as a function of metallicity using updated atomic data. In galactic environments, highly ionized species may also be produced via shocks (Dopita & Sutherland, 1996), or in interfaces between cool ( K) and hot ( K) gas, e.g., in conductive heating models (Boehringer & Hartquist, 1987; Borkowski, Balbus, & Fristrom, 1990) or turbulent mixing models (Slavin, Shull, & Begelman, 1993). In view of the calculations of Gnat & Sternberg (2007), metallicity can be an important ingredient; most of the models above assume solar metallicity gas.
To constrain the collisional ionization model, the high-ion column density ratios combined with the line-widths of the high-ion components may a priori help us to discern between these various models (e.g., Spitzer, 1996). Unfortunately, the results from the profile fitting are somewhat uncertain for the LVC since the absorption is so strong (see §2.3). From the Si IV and N V profiles, there are some suggestions of a mixture of hot ( K in the components) and cool ( K in the component) gas (see Table 2, §2.3, and Fig. 1). As we argue above, there is also room for an extra component at , at least in the Si IV and C IV profiles, and hence the components at and could be narrower. The profiles of N V and O VI show that most of the absorption is at and in particular the absorption peaks at and (see Fig. 3). This contrasts from the Si IV absorption, where the profiles peak at but also at . The profile of C IV appears to be somewhat intermediate between Si IV on one hand and N V and O VI on the other hand. The profiles of the high ions therefore suggest that at , the highly ionized (in particular Si IV) gas may be more subject to photoionization, but at , collisional ionization becomes more important. However, we emphasize that both mechanims likely occur at any . For the component at , assuming that a large fraction of Si IV is photoionized,333The velocity centroid of Si IV is , slightly different from the other high ions, consistent with the idea that the origins of these ions may be different. the ratios of C IV/O VI and N V/O VI (taken into account the intrinsic deficiency of N) in the models of Gnat & Sternberg (2007) do not fit the observed ratios, but models such as conductive interfaces or shock ionizations can produce the observed high-ion ratios. For the other components, the high-ion ratios are too poorly determined to draw any firm conclusions about their origin(s), although we note that the line width of the component at implies a very low temperature for C IV and Si IV (see Table 2) and probably for N V (see Fig. 1), suggesting an additional photoionization source (possibly from stars) or some NECI process with efficient cooling.
According to our profile fitting, there is also a close kinematic relationship between the high ions and the low ions and atoms. A simple explanation for this may involve interface layers between a hot ( K) and a cooler ( K) gas. Such interfaces are believed to be common in our much evolved Galaxy. However, the column densities of the high ions (in particular O VI) in model interfaces are much smaller than observed in individual interfaces (Savage & Lehner, 2006) and modeled (Borkowski, Balbus, & Fristrom, 1990; Slavin, Shull, & Begelman, 1993), requiring (too) many interfaces (and this discrepancy is probably worse in the DLA, which has a much lower metallicity than the Galaxy). Other interstellar models of high-ion production (e.g., radiatively cooling clouds, bubbles blown by supernovae or stellar winds) predict large high-ion column densities. However, as discussed by Tripp et al. (2008), the physics of the interfaces may be oversimplified and not so well understood, especially in the context of high redshift, low metallicity systems.
From the above, we conclude that the kinematic and ionization properties of this DLA are consistent with a highly ionized halo that co-rotates with a neutral proto-galactic disk. This picture is quite similar to our own Galaxy, which is surrounded by a hot highly ionized and a warm ionized halo, revealed by the same high and intermediate ions as those at high redshifts (e.g., Zsargó et al., 2003; Savage et al., 2003; Howk, Sembach, & Savage, 2003). However, since several components are observed, it is also possible that we are simply seeing several sheets of neutral gas separated by weakly and highly ionized gas. In galaxies, a major source for heating and ionizing the interstellar medium is massive stars. It is well known that these stars inject large amounts of energy in the interstellar medium over large scales via their supernovae and stellar winds. This environment may cool and/or produce interfaces between cool ( K) and hot ( K) gas. We have shown that the UV background plays an important role in ionizing and heating the present DLA, but it cannot explain by itself the origin of the high ions, especially O VI, N V, but also C IV, and even part of Si IV. Below we argue and show that there is room for stars to be present in this DLA-protogalaxy, hence stellar feedback is a possible origin for the high-ion absorption.
3.4 Nature of the neutral gas and star formation
Above we show that the UV background plays an important role in ionizing and heating the present DLA. There is, however, some leeway for the existence of other (internal) sources of ionization and heating; e.g., those might help to better model the column densities of Fe III and Si IV. We further investigate the nature of the neutral gas in this DLA and the implication for the star formation rate (SFR) using the limit on C II* absorption and the technique described by Wolfe, Prochaska, & Gawiser (2003) amd Wolfe et al. (2004). In this technique, we allow the heating and cooling to be balanced in a two phase medium (cold and warm neutral medium, hereafter CNM and WNM). The heating is mostly due to grain photoelectron emission, assuming a Fe depletion . The cooling in the CNM and WNM is dominated by C II at 158 m and Ly emisions, respectively (for more details, see Wolfe, Prochaska, & Gawiser, 2003). The star formation per unit area can be directly related to the photoelectric heating rate. The predicted C II 158 m cooling rate is compared with that derived from the strength of the C II* absorption (e.g., Lehner, Wakker, & Savage, 2004):
| (1) |
With the column densities of C II* and H I presented in Table 5, we find that for LVC, (3). The upper limits of Wolfe et al. are 2, i.e. for our DLA, (2).444An integration of C II* profile over the velocity interval would give a 2.5 detection ( mÅ, ), which would imply , consistent with the 2 limit. We favor the upper limit because the velocity range is not justified in view of the other absorption profiles, but it is possible that the value of is not much smaller than the quoted 3 limit. This is the lowest known limit on the cooling rate so far found in a DLA (see the up-to-date sample of Wolfe et al., 2008). Extremely low C II radiative cooling rates can be found either in cold neutral gas where the SFR is low or in warm neutral gas (Wolfire et al., 2003; Wolfe, Prochaska, & Gawiser, 2003; Lehner, Wakker, & Savage, 2004). Below we show that this is the only known DLA where the neutral gas is unambiguously warm and where star formation may occur.
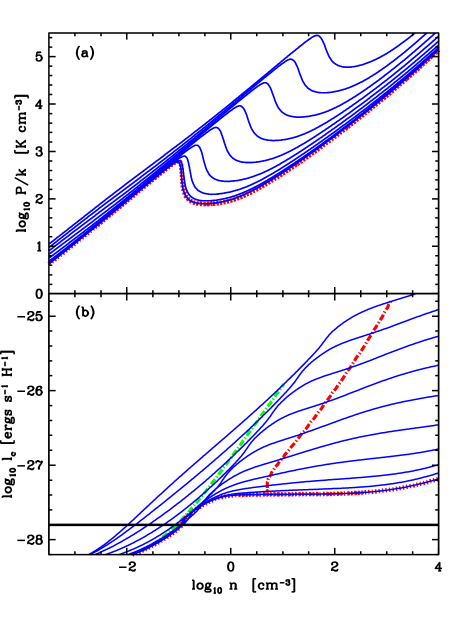
Fig. 8 shows the equilibrium solutions for gas subjected to internal and external sources of heating. The internal source is photoelectric heating by dust grains absorbing starlight produced locally (and an assumed cosmic-ray contribution), while the external heating is produced by the extragalactic background from galaxies and QSOs including UV and a higher energy component (see Wolfe, Prochaska, & Gawiser, 2003; Wolfe et al., 2004, for more details). We assume no enhancement in -element abundances in estimating the dust content (see Wolfe et al., 2004). The red dash-dottedcurve is the locus of all equilibrium CNM solutions and the green dash-dotted curve is the same for the WNM solutions. The solid horizontal line shows our 3 limit on , which rejects a CNM solution. Therefore the neutral gas is warm. The WNM solution also suggests that star formation may occur, but only at a rate M⊙ yr-1 kpc-2. This limit is about a factor twice larger than the local rate in the Milky Way. As we discuss in §3.2, there might be very little dust in this DLA. We therefore also ran a dust-free model where the only heating is by X-ray photoionization and cosmic rays. As in the previous model, their heating rates are proportional to the SFRs. The CNM solution is again ruled out and star formation is still posible in the WNM solution. A population of DLAs with warm neutral gas and possible ongoing star formation exists based on our findings. Hence many of the sightlines where only upper limits on are derived may actually probe WNM gas.
4 The fully ionized high-velocity gas
4.1 Overview
The strong O I 1302 transition is completely absent outside the velocity range (see Fig. 2). Absorption from singly-ionized species with large values, Si III, and highly ionized species is seen at higher absolute velocities. The NHVC, the component, and the PHVC (see Table 2) have O/Si. Since Si and O are both -elements (i.e., have similar nucleosynthetic history), we expect the intrinsic O/Si should be nearly solar. The strong underabundance of neutral oxygen compared with singly ionized silicon implies these clouds are strongly ionized (see, e.g., Lehner, Keenan, & Sembach, 2001). In all these components, we also find that the column densities of the highly ionized species are systematically larger than respective singly-ionized species, i.e., C IVC II and Si IVSi II, implying not only hydrogen fully ionized in the gas, but also the metals are highly ionized.
While these components could certainly arise in the IGM and be unrelated to the DLA at , the close velocity proximity to the DLA ( ) suggests some association, possibly via outflows or infalling material on the DLA protogalaxy or in form of a highly ionized halo about the protogalaxy that does not share the same overall motion. Further, “typical” diffuse IGM conditions would require simultaneously () and (e.g., Simcoe et al., 2006), and are unlikely to occur for these absorbers since the Hubble broadening (where we assume a standard cosmology at ) would be larger than the observed line widths of the individual components.
Following, Fox et al. (2007b), the escape velocity of a DLA may be estimated if the virial velocity, , of the DLA-protogalaxy is known and assuming a spherical geometry: . Haehnelt, Steinmetz, & Rauch (1998) found – (see also, Maller et al., 2001). For the DLA presented here , hence none of the high-velocity components could escape the gravitational potential of the DLA. However, the relation between and is not well known and the velocity width and virial velocity, while linearly correlated according to cosmological simulations, shows a large scatter around the median value. Also, in both Haehnelt, Steinmetz, & Rauch (1998) and Maller et al. (2001) simulations, the probability distribution of has a large scatter from to 1.5, enabling the high-velocity components to be also signatures of feedback-driven flows or even an escaping galactic wind from the protogalaxy. It could also be that our line-of-sight passes through a highly ionized halo of another galaxy (see, e.g., Fig. 1 in Maller et al., 2003) since clustering of galaxies near DLAs exists at both low and high redshifts (e.g., Chen & Lanzetta, 2003; Bouché & Lowenthal, 2004; Cooke et al., 2006a, b; Ellison et al., 2007). Yet it is unlikely that the fully ionized components probe the core of other galaxies (since there is no signature of neutral gas).
The amount of total hydrogen is unknown in these ionized components, making it impossible to determine the metallicity. We therefore assume that all have a metallicity similar to the LVC, i.e., we set a priori in our Cloudy simulations. This similarity in the metallicities might arise if the high-velocity ionized components have their origins in the protogalaxy or at least were polluted by the DLA itself or by another protogalaxy with a similar metallicity. Metallicity measurements in DLAs at show a large scatter at this redshift with ranging from about dex to dex, but with a mean around dex (Prochaska et al., 2003). Yet if the high-velocity gas was only slightly polluted by materials from protogalaxies and is being accreted by the present DLA, a much lower metallicity may be expected (e.g., see Simcoe, Sargent, & Rauch, 2004; Simcoe et al., 2006).
Below we review the properties of each high-velocity components and in particular explore the possible ionization mechanisms and the connection (if any) between the various ionized species. Our main aims are to understand (i) if “simple” photoionization and collisional ionization models can reproduce the observed properties (column density ratios and Doppler broadening) of the ionized gas; (ii) if O VI and N V necessarily probe hot collisionally ionized gas; (iii) the origin(s) of the highly ionized high-velocity components.
4.2 The negative high-velocity component
For the NHVC, the velocity centroids at and are quite similar for C II, Al II, Si IV, and N V (see Figs. 1 and 2), suggesting some relationship between all these ions. Inspecting the ratios of the apparent column densities of various ions with respect to Si IV, we find that, in the velocity range , there is little or no variation for the low, intermediate, and high ions with respect to Si IV, suggesting that the ionization conditions do not change much over this velocity range. There is, however, a drop in Si IV at more negative velocities than , which also corresponds to an increase of N VSi IV and C IVSi IV, implying that gas becomes more highly ionized at more negative velocities (which is the same pattern seen for the LVC).
In the components at and , the -values of Si IV and C IV imply a temperature for the gas bearing these ions of a few times K. In the component, higher temperatures may occur, with K. At K, collisional ionization models produce a fraction of C II larger than the fraction of C IV (see Gnat & Sternberg, 2007), inconsistent with our observations. Thus photoionization could play a role for the origin of C IV and Si IV in components at and . Below we therefore model the ionization of the NHVC by producing first a Cloudy photoionization simulation that matches the integrated columns of the NHVC, which we feel are a more reliable indicator of the average properties of this gas than the individual component columns (see §2.3).
| Species | |
|---|---|
| O I 1302 | |
| C II 1036,1334 | |
| C IV 1548,1550 | |
| N II 1083 | |
| N V 1238,1242 | |
| O VI 1031 | |
| Al II 1670 | |
| Al III 1854,1862 | |
| Si II 1260,1304,1524 | |
| Si III 1206 | |
| Si IV 1393,1402 | |
| Fe III 1122 |
Note: Upper limits are 3.
Fig. 9 shows the result of our Cloudy simulation using the Haardt & Madau UV background (see §3.3). In the left panel we show the predicted and observed column densities against the density. The metallicity is a priori assumed to be similar to the LVC. H I is chosen so that the model predicts enough column densities for the weakly ionized species. It is, however, quite possible, that other (NECI) mechanisms may produce both low and high ionization species (see below). We do not show O I and Si III in Fig. 9 because the estimated limits are not constraining.
In the panel on the right-hand side of Fig. 9, we show the column density ratios for multiple ionization stages for C, N, Si, and Al against the density. In this representation, nucleosynthetic effects do not play any role since the same elements in different ionization stages are considered. We do make the assumption, however, that ions in different ionization stages are all produced by the same ionization mechanism. With those assumptions, the best solution is found at where the observed ratios of Si II/Si IV and Al II/Al III and the limits on N II/N V and C II/C IV agree with the model within about 1.
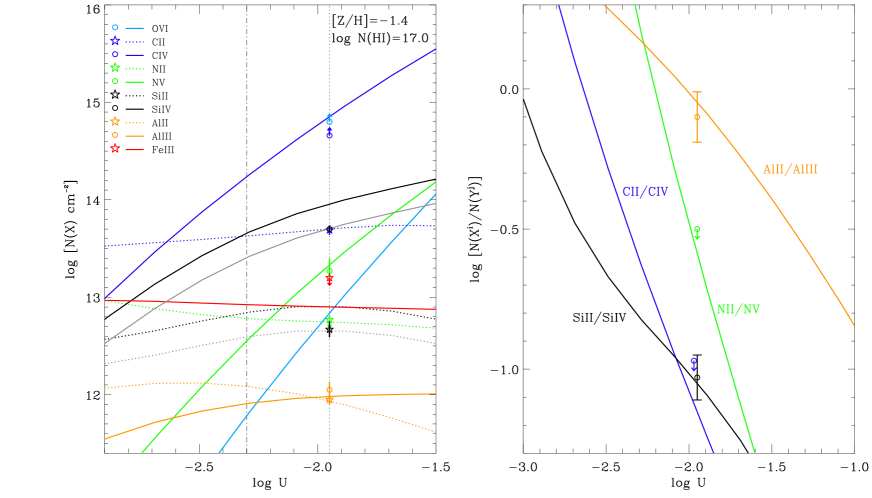
The vertical dotted line on the left panel of Fig. 9 shows this solution in the column density versus density plot. C IV, N V, N II, Al II, and Al III are consistent with such a solution (since N may be deficient by dex, see §3, this would require another mechanism to produce N V, see below), but both Si II and Si IV are over-produced by 0.25 dex. The gray dotted and solid lines show the column densities of Si II and Si IV, respectively, minus 0.25 dex, which fit the data quite well. Therefore, if Si/C and Al/C, this photoionization model provides a good description for ions with ionization potential less than about 50 eV. However, this relative abundance pattern is quite peculiar: neither depletion into dust nor standard nucleosynthesis yields can provide a simple explanation for such a relative abundance pattern. If the former plays a role, Al should also be deficient, while solar or supersolar Si/C are usually observed in low metallicity protogalaxies.
The assumption that all the ionization stages are produced by the same ionizing spectrum could be wrong. For example, if (shown in Fig. 9 by the dot-dashed line), there is a good agreement between the model and observation for Si IV, Al III, and C II within about 1. We note that this solution matches the Si II/Si IV ratio in the velocity range (i.e. the most negative velocity absorption is ignored where the gas becomes more highly ionized, see above). C IV would be under produced, but C IV can be also produced via collisional ionization (see below). However, with this latter solution, Al II and to lesser extent Si II would be overproduced and the Al II/Al III ratio does not fit the observations. The ionization potentials for C II, Si II, and Al III are in the range 11.3–24.4 eV, 8.2–16.4 eV, and 5.9–18.8 eV, respectively: the discrepancy between the model at and observations increases as the minimum ionization potentials become smaller. It is therefore possible that the model with the current UV background produces too many photons at low energies. We note that the typical size for would be kpc, more reasonable than at where kpc.
It is possible that both the shape and intensity of the UV background vary in the Universe. In addition, the escape of ionizing flux from protogalaxies is uncertain and could change both the shape and intensity of the ionizing radiation. The impact of an “internal” ionizing source could be similar. If the DLA is close to an AGN or a QSO, its ionizing radiation would have an important impact on the shape and intensity of the UV background. We therefore first investigated if a softer ionizing source would produce a better match to the observations, at least for the low ionized species. We considered ionization by a late O-type spectrum ( K) with an atmospheric metallicity Z/H and an atmosphere from the TLUSTY models (Hubeny & Lanz, 1995). We find that a model with H I fits fairly well the observed column densities of the singly ionized species C II, Si II, Al II, and N II (assuming that N is deficient by at least dex). On the other hand, column densities of the higher ionized gas (including Al III) cannot be reproduced by this model, falling short by several orders of magnitude. While such a model cannot be sufficient on its own, it is possible that the true ionizing spectrum is a combination of soft and hard UV spectra. We therefore considered a Haardt & Madau UV background from QSOs only, i.e. a UV background harder than considered previously. A solution with () can match the column densities of Si IV and N V (if nitrogen is deficient by dex) and the lower limits on C IV and O VI, while producing negligible Si II and Al II. But it fails to produce enough Al III. The QSOs only background also produces a solution at () that fits the Si II, Si IV, and C IV column densities. This model requires the relative abundance of Al to be deficient by dex to match Al III and, and in any case does not produce enough C IV, N V, and O VI.
We have therefore not found a satisfactory Cloudy photoionization model with a single source of ionization unless the NHVC has peculiar abundances or the UV background model that includes galaxies and QSOs overestimates the contribution from low energy photons. The latter model and explanation () appear plausible because it better fits the Si II/Si IV ratio over the velocities . We note that if increases in this model,555To first order, reducing/increasing the metallicity increases/decreases the hydrogen column density, but the effect is not solely linear and the shape of the ionization fractions as a function of temperature or density can change with . We also note that if we adopted H I dex (with matching metallicities), would only change by about dex. the discrepancy between model and observations for the singly-ionized species decreases, but modeled Si II and Al II column densities are still not in agreement with the observations even at , which is the current maximum metallicity observed in a DLA at . A hard spectrum would seem unlikely to produce the observed amount of N V and O VI (and some C IV) because the Hubble flow would broaden the absorption profiles too much. Therefore, other ionization mechanisms, including collisional ionization, may play a role in this gas.
The observed high-ion ratios, broadenings of the high ions, and C IVC II and Si IVSi II are incompatible with CIE or NECI models. Other models involving shocks or interfaces also require temperatures for the highly ionized gas of a few times K. Hence a combination of simple photoionization and collisional ionization models cannot reproduce all the observed properties, implying that the assumptions in these models are unlikely to hold for the NHVC, especially for the high ions. Therefore physical conditions are likely to be more complicated than these simplified scenarios (see §4.5).
4.3 The component at
As for the NHVC, the kinematics of the high, intermediate, low ions in the component appear connected (see, e.g., C II, Si II, Si IV in Fig. 2). We modeled this component with Cloudy adopting the same assumptions as described in the previous section. In Table 6, we summarize the column densities for the various species. The low ions (Si II, C II) and high ions (Si IV and about 80% of C IV) can originate in photoionized gas when , which implies , K, and (see Fig. 10). The linear size of the absorbing material is about 800 pc. Lower metallicity cannot be ruled out based on the broadening of component.
As for the NHVC, the column densities of O VI and N V (and part of C IV) cannot be reproduced by ionization by the UV background from galaxies and QSOs. Assuming that the photoionization model is correct, the amount of C IV not produced by this model would be C IV. With this estimate, the ratios of C IV/O VI and N V/O VI would be compatible with a CIE model only if N is deficient by at least dex. However, this model requires K, inconsistent with the -value of C IV that implies K. For O VI, the (uncertain) -value does not suggest temperatures higher than K. It is not clear if other models (e.g., conductive interfaces) in low temperature conditions could reproduce the observed ratios. As for the NHVC, we discuss the properties of this component in the context of feedback models in §4.5.
| Species | |
|---|---|
| O I 1302 | |
| O VI 1031,1037 | |
| C II 1334 | |
| C IV 1548,1550 | |
| N II 1083 | |
| N V 1238 | |
| Al III 1854,1862 | |
| Si II 1193 | |
| Si IV 1393,1402 | |
| Fe III 1122 |
Note: Upper limits are 3.
4.4 The positive high-velocity component
With only the detection of C IV, and possibly O VI and N V, the PHVC ( ) appears even more highly ionized than the gas probed by the NHVC, although the column densities of C IV are quite similar in both components and the column density of O VI appears smaller in the PHVC compared to the NHVC. In Table 7, we summarize the measurements for the high ions and the limits for other strong transitions. Because O VI is uncertain, we assume the C IVO VI ratio is constant over the profile and use C IV) to estimate O VI. This gives the value reported in Table 7. However, for the ionic ratio used below, we will also take into account the direct measurement O VI reported in Table 1 (where the lower-equal sign emphasizes that the O VI 1037 could be tainted).
| Species | |
|---|---|
| C II 1334 | |
| C IV 1548,1550 | |
| N II 1083 | |
| N V 1238 | |
| O VI 1037 | a |
| Si III 1206 | |
| Si IV 1393 |
Note: Upper limits are 3. Because N V is partially contaminated, its measurement remains uncertain. : We report the O VI column density derived from O VIC IV in the velocity range (see Figure 4) and C IV). The “” sign emphasizes that the line could be partially contaminated by an unrelated absorber.
The upper limit on the temperature, K (derived from the profile fitting to the C IV doublet, see Table 2), could suggest that collisional ionization may play a role if thermal motions dominate the broadening and if the O VI absorption is largely contaminated. However, at such relatively low temperatures, one would expect a priori detection of other ions, in particular Si IV. Models involving interfaces (see §3.3) are ruled out because even strong transitions of low and intermediate ionized species (e.g., Si III 1206, C II 1334) are not detected. The absence of these very strong transitions is rarely observed in highly ionized gas. The high-ion ratios that can help us to discern between ionization processes are unfortunately quite uncertain: For O VI, we have to make the dubious assumption that the absorption is not contaminated by some metal line absorption. The N V absorption is partially blended at 1238 Å and completely contaminated at 1242 Å; therefore only an upper limit can be derived. Furthermore, nitrogen is likely to be deficient with respect to the other elements. With these assumptions and caveats, we find that C IVSi IV, C IVO VI–0.7 (the first value is derived using the total O VI column density from the profile fitting – see Table 1, the second value is derived using the AOD column density ratio in the velocity range ), and C IVN V (but note that N is likely deficient relative to C). These high-ion ratios with the additional constraints on the temperature and the absence of detection of low ions are not consistent with any models involving collisional ionization.
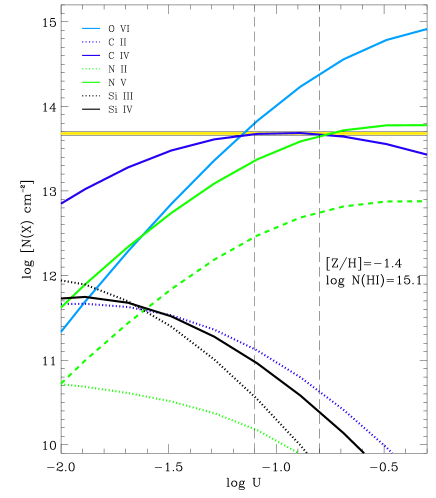
We have therefore produced a Cloudy photoionization simulation with the same assumptions used for the other components, in particular that the gas has a metallicity [Z/H, similar to the LVC, and the UV background is from galaxies and QSOs. In Fig. 11, we show the Cloudy model that matches the C IV column density for . Within this range, this model predicts an O VI column density consistent with the range of estimated values, assuming weak or no blending. The model produces too much N V when nitrogen has solar relative abundance with respect to the other metals. However, the model is consistent with N V if nitrogen is deficient by dex (dashed line in Fig. 11). All the other limits reported in Table 7 are consistent with the model. Models with and are rejected because they would contradict the limits on Si III (and Si IV) and O VI, respectively. The path length for this cloud would be quite large ranging between 50 to 250 kpc. However, if the UV background is dominated by only the QSOs, suitable solutions can also be found with smaller , and hence reducing the path length. Therefore, despite the absence of low ions, the PHVC does not appear to probe hot gas but could represent an extended cool, low density, highly photoionized layer of gas.
4.5 Origin(s) of the highly ionized high-velocity gas
So far we have discussed the highly ionized high-velocity gas in the context of simple ionization models. We have shown that photoionization by the UV background is a possible source for producing the low and intermediate ions, and Si IV and part of C IV. But except for the PHVC, O VI and N V cannot be produced by photoionization by the UV background. Photoionization from point sources (e.g., from extremely massive stars) is also unlikely as it is not clear that such stars can produce enough eV photons to produce the observed strong absorption in O VI. It would also require the highly ionized gas to be extremely close to the ionizing object, which is not consistent with the many components observed at both high positive and negative velocities (we also note that this scenario would have problem with the excellent match in the kinematics between low and high ions since the required large would make the absorption of the low ions weak). For O VI and N V (and in part C IV), CIE and NECI models fail to reproduce the observed properties (ionic ratios and broadening) of the high ions. There is some evidence that the highly ionized gas can be at low temperatures based on the -values obtained from the profile fits. The highly ionized gas must therefore be relatively dense ( cm-3), or have a relatively high metallicity, or have a combination of both in order to be able to cool to a few times K. Indeed, the instantaneous radiative cooling time can be written as (e.g., Gnat & Sternberg, 2007)
where is the cooling function, which is dependent on the temperature and the metallicity. This expression is valid if the gas is isochoric (if instead it is isobaric, 219 should be replaced by 365, see Gnat & Sternberg, 2007). For subsolar metallicity (), and cm-3, it would take more than the age of the Universe at the absorption epoch () for a K gas to cool (if the gas had initially K, it would take less than 100 Myr to cool). Therefore, a scenario involving accretion of primordial and low density gas is not viable if the initial temperature of the hot gas is at least K since . Gas at such high temperatures may exist if it was heated, e.g., by supernovae feedback. As the density and the metallicity increase, the gas can cool more rapidly. It is more likely that the highly ionized high-velocity gas is a signature of either protogalactic winds/outflows or intra-galaxy, enriched material falling onto the protogalaxy.
At , feedback processes such as galactic winds/outflows or shock heating by supernova remnants are expected to be more common because star formation is more active, and these are in fact essential for galaxy formation and evolution (e.g., Croton et al., 2006; Mashchenko, Wadsley, & Couchman, 2008). On the other hand galaxy mergers and clustering of galaxies are also important at high redshift, favoring the enrichment of gas near protogalaxies that may fall onto them or the possibility that a sightline intersects unrelated absorbers to the DLA. Fox et al. (2007a) favor a scenario involving galactic winds because they find high-ion absorption at velocities larger than the escape velocities of the protogalaxies. However, the knowledge of in DLAs is not well known (see §4.1), and we believe there is not yet enough evidence to favor one scenario over the other one. In principle, one could use cosmological simulations of protogalaxies that incorporate feedback mechanisms to try to disentangle these scenarios. However, many aspects of feedback are too complex to reliably model (e.g., metal cooling, non-equilibrium ionization effects) and current simulations often lack the spatial and mass resolutions to resolve the supernova environment (e.g., Dalla Vecchia & Schaye, 2008). Further Fangano, Ferrara, & Richter (2007) argue it is even difficult to differentiate between outflowing and infalling materials in simulations. Nevertheless, we find interesting that these recent models can produce low temperatures (a few times K) for the highly ionized gas in the galactic outflows, which is so difficult to produce in the simplified ionization models used above (Oppenheimer & Davé, 2006; Kawata & Rauch, 2007; Fangano, Ferrara, & Richter, 2007). These models also predict a similarity in the kinematics of the low, intermediate, and high ions as observed here.
Local analogs of highly ionized HVCs may also help to better understand the origin(s) of the highly ionized HVCs at high . With the Far Ultraviolet Spectroscopic Explorer (FUSE) and the Space Telescope Imaging Spectrograph (STIS) on board of the Hubble Space Telescope, many highly ionized HVCs (i.e. gas that moves at much different velocities than gas associated with the Galactic disk) were discovered in the halo of the Milky Way toward extragalactic sightlines (Sembach et al., 1999; Lehner, 2002; Sembach et al., 2003; Collins, Shull, & Giroux, 2004, 2005; Fox, Savage, & Wakker, 2006). At least 60–70% of the high-latitude sky is in fact covered by O VI HVCs (Sembach et al., 2003). It is interesting to note that both high and low redshift highly ionized HVCs share some common properties: By definition, they are highly ionized, but they also often show very complex kinematic and ionization structures, they are often multiphase and (nearly) fully ionized, and there seems to be some kinematic connection between the low and high ions.
As for their high redshift counterparts, the origin of low redshift HVCs remains largely enigmatic, and both a “Galactic” origin (where the HVCs are the result of feedback processes and trace the disk-halo mass exchange, perhaps including the accretion of matter condensing from an extended corona) and a “Local Group” origin (where they are part of the local warm-hot intergalactic medium) have been proposed (e.g., Sembach et al., 1999; Nicastro et al., 2003; Gnat & Sternberg, 2004; Fox, Savage, & Wakker, 2006). Evidence for and against any of these theories are mostly circumstantial, although recently Zech et al. (2008) have discovered two highly ionized HVCs toward the star ZNG 1 in the globular cluster M 5, firmly demonstrating that some of these highly ionized HVCs originate near the Galactic disk and are signatures of Galactic-feedback (the metallicity being supersolar for these HVCs). Other highly ionized HVCs associated to galactic feedback mechanisms are also found near the LMC (Lehner & Howk, 2007). On the other hand, some HVCs are also clearly related to an accretion phenomenon or tidal products some HVCs are also related to an accretion phenomenon or tidal products (e.g., Complex C and Magellanic Stream, Tripp et al., 2003; Sembach et al., 2003). Therefore, while an IGM origin cannot be ruled out for some HVCs, several highly ionized HVCs in the low redshift Universe have been associated with galactic feedback and accretion processes. At high redshift we noted that the column densities of the high ions are far too large for these ions to arise in the IGM. At both high and low redshifts, highly ionized HVCs may therefore be connected to gas outflowing from the host protogalaxy or galaxy. For example, Simcoe et al. (2006) presented evidence of chemically enriched high-velocity O VI and C IV absorbers near galaxies at with possible high [Si/C] suggestive of supernovae type II enrichment, and therefore favoring outflowing matter. For the present DLA, there is not enough evidence to favor feedback over accretion.
While we listed similar properties for the highly ionized HVCs at low and high , they also have differences. At high , C IV (IP: 47.9–64.5 eV) appears to trace both photoionized and collisionally ionized gas, much like Si IV (IP: 33.5–45.1 eV) at low redshift. Narrow components in N V and O VI absorption (and C IV unexplained by photoionization by the UV background) are observed at high , but are relatively rare or absent at low redshift (although part of this could be an instrumental bias since the spectra of the O VI HVCs at have compared to 45,000 for the present observations – e.g., Savage, Sembach, & Howk 2001 reported a narrow N V component with in the Milky Way gas). The high-velocity absorption near DLAs is often much stronger than near our Galaxy and the high ion ratios appear to vary much more in DLAs (at least in the present DLA) than in or near the Galaxy. The change in the ionizing background spectral energy distribution may explain some of these differences for Si IV and part of C IV. However, as we have demonstrated here, many of the highly ionized high-velocity components (O VI, N V, and some C IV) in the DLA cannot be explained by photoionization alone. Therefore some of the listed differences above between the highly ionized high-velocity gas at low and high also suggest an evolution in the properties of feedback processes or the environment near the (proto)galaxies.
5 Discussion
Before summarizing our main findings, we argue that this DLA is typical in many regards. From a standpoint of the metallicity (), the main component of the DLA at toward J1211+0422 is actually quite ordinary (see, e.g., Prochaska et al., 2003, for a summary of the metallicity evolution of DLAs). The full velocity width of the neutral absorption of about 70 is also not far from the median value of 90 derived in a large sample of DLAs (Prochaska & Wolfe, 1997). The H I value lies near the median of the DLA H I column density distribution. The -element enhancement relative to Fe-peak elements and N is also not out of the ordinary (Lu et al., 1996; Prochaska & Wolfe, 2002; Petitjean, Ledoux, & Srianand, 2008). But what may really distinguish this DLA from others is the absence of cold neutral gas signature. However, % of the DLAs studied by Wolfe et al. (2008) have no detectable C II* absorption, possibly indicating the neutral gas is warm. None of the upper limits derived on are as stringent as in the present DLA and improving the signal in the spectra of these DLAs would help to understand if the population of DLAs with WNM is important.
We also saw that the high, intermediate, and low ions in this DLA seem to follow each other quite well kinematically. Wolfe & Prochaska (2000a) found that C IV and low ions rarely follow the same kinematic distribution, Si IV and C IV appear strongly correlated, and in many cases the Al III profiles are better correlated with those of the low ions than with those of C IV and Si IV (see also Lu et al., 1996). However, even though the components of the high-ion profiles are generally disjoint from the low-ion profiles, Wolfe & Prochaska (2000a) noted that the high-ion and low-ion profiles are roughly centered on similar velocities and that the high-ion profiles have a full-width systematically similar to or larger than that low-ion profiles, properties similar to the present DLA (see also Fox et al., 2007a, b). The ionized DLA described by Prochaska et al. (2002a) shows some correlation between the velocity centroids of the low, intermediate, and high ions. The absence of clear kinematic alignment between the high, intermediate, and low-ion profiles in every DLA may, however, not be entirely surprising. In our own Galaxy, there is a significant variety in the type of associations between the various phases of the interstellar gas, which are generally attributed to sightline projection effects and the physical processes that give rise to the high-ions.
We also found that the amount of ionized gas associated to this DLA is very large. To gauge the importance of the highly ionized gas relative to the neutral gas we can estimate the amount of hydrogen in the highly ionized phase from H IIN V, where N V is the ionization fraction of N at K when using the NECI calculations from Gnat & Sternberg (2007). At greater or lower than K, . We assume that the N abundance is the same in the neutral and ionized phase, so that N I/H I. For the LVC, H I, H II (highly ionized gas) and H II (photoionized gas). For the NHVC, H II (highly ionized gas) and H II (photoionized gas). Using the lower limits on O VI (Tables 4 and 5), we find consistent H II amounts for the highly ionized gas with H II in the LVC and NHVC (in that case and ). The component and PHVC are negligible with respect to hydrogen amounts in the LVC and NHVC. Summing the various components, H IIH I, where H II includes contribution from both the photoionized gas and highly ionized gas. As we discuss above there is some uncertainty in the processes that give rise to O VI and N V. Nevertheless the ionization fraction of these species is unlikely to be much more than 0.2 based on CIE/NECI and photoionization models. The metallicity correction in the high-velocity components is uncertain because no direct metallicity estimates can be done. If the metallicity is not similar to the DLA itself, it is more likely to decrease in these components, although if there is enough pollution from other nearby protogalaxies an increase may be possible. The limit H IIH I is larger than those typically derived by Fox et al. (2007b) for DLAs with similar total H I column density, but is comparable to ionized-to-neutral ratios derived in DLAs with lower H I and sub-DLAs (Fox et al., 2007b, c). The use of N V may have allowed us to simply derive a more stringent lower limit.
Finally, we observe that Fox et al. (2007b) argue that the highly ionized gas may help to solve (in part) the missing metal “problem” at high redshift (Pettini, 1999) since if the O VI-bearing gas has K, then (according to CIE models), which would imply that the O VI phase has enough metals to solve the issue. In our analysis, several components have K, consistent with . However, there is also evidence for O VI-bearing gas with K, which would also imply if CIE/NECI applies. But CIE/NECI (and photoionization) provides a poor description of this gas. To quantify accurately the importance of the highly ionized phase in DLAs requires first a better understanding of the high-ion absorption in a large and (relatively) uncontaminated sample (with the purpose of obtaining a statistical sample where the distribution of in the individual components could be studied), the ionization fractions of the high ions (requiring models with more realistic physics), and metallicities in the ionized plasma (which is likely to rely on similar assumptions made in the present work).
6 Summary
We have presented Keck HIRES observations of the absorbing material associated with a DLA at along the QSO J1211+0422 () sightline with the goal of exploring the properties of the highly ionized gas, its connection with the neutral gas, its origin(s), and its possible relationship to feedback processes. The absorbing material at has little contamination, especially in key species, such as Si IV, C IV, and N V, which allows us to undertake detailed modeling of the high-ion profiles, to assess their relationship with low ions and study the ionization mechanisms at play.
The main results of our analysis for the gas that has velocities in the range interval where the neutral absorbing material is confined are as follows:
1. Where there is neutral absorbing material, intermediate- and high-ion absorption is also observed. The profiles of the low and high ions have several components. The profile fits to the high ions show that there is a close kinematic relationship between the high and low ions.
2. The metallicity of this DLA, , is similar to the average metallicity of other DLAs at . With , there is little evidence for silicate grains. The low ratio of implies that nucleosynthesis plays a role in the observed relative abundances. Hence, the enhancement of could be solely due to nucleosynthesis. However, within the uncertainties, a mixture of dust depletion of Fe and Ni () and nucleosynthesis is a possibility.
3. A Cloudy simulation, where the source of the photoionization is dominated by the Haardt & Madau galaxies plus QSOs spectrum, reproduces well the column densities of the singly- and doubly-ionized species. Within this simulation, about 85% of the gas is neutral and the gas is warm ( K). However, this model fails completely to produce large enough high-ion columns (especially for C IV, N V, and O VI). Possible models for the production of the high ions include conductive interfaces or shocks. Including the highly ionized gas, the column of ionized gas in this velocity range is similar to the amount of the neutral gas, with H IIH I.
4. We derive the lowest upper limit on C II* in a DLA to date, which implies a cooling rate erg s-1 per H atom at 3. Using the models of Wolfe, Prochaska, & Gawiser (2003) and assuming a Fe dust depletion of , we show that the neutral gas can only be warm. We also show that the star formation rate is M⊙ yr-1 kpc-2, i.e. we cannot rule out that star formation may occur at a rate about twice the local rate of the Milky Way. These conclusions hold even if the environment is essentially free of dust. DLAs may therefore have warm neutral gas and ongoing star formation at the same time. Improved upper limits on C II*H I in DLAs may help to discern the importance of this population of warm neutral absorbers.
5. This DLA is made up of warm neutral and warm (and possibly hot) ionized gas that are comoving with similar velocities given the close kinematic relationship between the low and high ions. Despite the similar velocities for all the species, the DLA has multiple phases. A picture where the neutral gas is surrounded by a highly ionized halo is plausible, but not unique. Because several components are observed, it is also possible that we are seeing several sheets of neutral gas separated by weakly and highly ionized gas.
For gas outside of the LVC absorption, i.e., at , absorption is only observed in singly-ionized and higher ionized species (i.e. there is no signature of neutral gas). The amount of gas in the highly ionized phase is larger than the amount in the weakly ionized phase. Our main results for the high-velocity gas are as follows:
6. In the velocity range , only C IV and O VI absorption is detected. This gas has one of the highest known C IV/Si IV ratios, with C IVSi IV. Other ions with very strong transitions, such as C II and Si III, are totally absent. Paradoxically, the observed properties () are better explained with a cool, photoionized model than a model involving collisional ionization (in or out of equilibrium).
7. For the components at and in the velocity range , low and high ions are detected and appear to be kinematically related. A photoionization model using the Haardt & Madau (galaxies+QSOs) spectrum can reproduce the column densities of the ionized species in the component, except those of O VI and N V. For the gas in the velocity range , Cloudy results are difficult to reconcile with the observations without invoking peculiar relative abundances (subsolar and solar ) or a different spectral energy distribution for the ionizing spectrum. In any case, photoionization does not appear to be a major source for O VI and N V. The broadening of the profiles implies temperatures that are too low to produce N V and O VI (and in part C IV) in CIE (e.g., at , O VI , implying K; in several components of C IV, C IV–10 , implying – K). This indicates that cooling must be important and efficient, hence requiring the gas to be relatively dense ( cm-3) and/or rich in metals.
Combining our results with other works (in particular Fox et al., 2007b), we make some more general conclusions concerning the high ions observed in high redshift DLAs:
8. In the present DLA, Si IV probes predominantly photoionized gas, while C IV has the most ambiguous origin. Photoionization by a hard spectral source (e.g., QSOs) can produce significant C IV absorption but is generally not sufficient to explain the total observed column. In our Galaxy, Si IV is the “ambiguous” high ion. The difference in the spectral energy distribution of the ionizing background flux between the high and low Universe may explain this difference for the most part. In view of other Si IV and C IV studies in DLAs, these conclusions are likely to hold for the whole population of DLAs.
9. Combining our results with those of Fox et al. (2007b), DLAs can have strong O VI absorption with in some cases N V absorption. In our DLA and for another DLA in Fox et al. (2007b), simple photoionization models fail to reproduce enough columns for these ions. However, these ions do not necessarily probe hot ( K) gas, i.e. their mere presence does not necessarily imply the presence of hot gas. Non-thermal, turbulent motions may broaden the high-ion profiles, and for the present DLA, there is evidence for narrow ( K) components not associated with photoionized gas. We also find that simple CIE and non-equilibrium radiative cooling ionization models fail for these ions and part of C IV when the line-widths are available (i.e. the models cannot reproduce simultaneously the high-ion ratios and -values). Both collisional and photoionization models are likely more complex than those presented here. However, in view of our results and those of Fox et al. (2007b), we believe it is safe to conclude that N V and O VI (and part of C IV) associated to DLAs must exist in a separate phase than the photoionized phase. In that sense, they appear better tracers of feedback (or accretion) processes in high redshift DLAs than Si IV and C IV.
Future detailed analysis of O VI and N V absorption in a relatively uncontaminated and larger sample than presently published would be extremely useful, in particular to constrain the -value distribution of the individual components. C IV and Si IV should not be dismissed since they are far less contaminated by the Ly forest. A detailed profile fitting on a large sample of C IV and Si IV absorbers associated to DLAs in order to extract the individual -values would be very valuable since Si IV mostly probes photoionized gas while C IV probes both photoionized and collisionally ionized gas. This work provides a step in that direction and we plan to further investigate the nature of the highly ionized gas in DLAs in the future.
acknowledgements
The authors wish to recognize and acknowledge the very significant cultural role and reverence that the summit of Mauna Kea has always had within the indigenous Hawaiian community. We are most fortunate to have the opportunity to conduct observations from this mountain. We also acknowledge the Keck support staff for their efforts in performing these observations. This research has made use of the NASA’s Astrophysics Data System Abstract Service, the SIMBAD database, operated at CDS, Strasbourg, France, the NASA/IPAC Extragalactic Database (NED) operated by the Jet Propulsion Laboratory, California Institute of Technology, under contract with the NASA, and SDSS data.
References
- Aguirre et al. (2001) Aguirre A., Hernquist L., Schaye J., Katz N., Weinberg D. H., Gardner J., 2001, ApJ, 561, 521
- Asplund, Grevesse, & Sauval (2006) Asplund M., Grevesse N., Sauval A. J., 2006, CoAst, 147, 76
- Bland-Hawthorn & Cohen (2003) Bland-Hawthorn J., Cohen M., 2003, ApJ, 582, 246
- Boehringer & Hartquist (1987) Boehringer H., Hartquist T. W., 1987, MNRAS, 228, 915
- Borkowski, Balbus, & Fristrom (1990) Borkowski K. J., Balbus S. A., Fristrom C. C., 1990, ApJ, 355, 501
- Bouché & Lowenthal (2004) Bouché N., Lowenthal J. D., 2004, ApJ, 609, 513
- Chen & Lanzetta (2003) Chen H.-W., Lanzetta K. M., 2003, ApJ, 597, 706
- Collins, Shull, & Giroux (2004) Collins J. A., Shull J. M., Giroux M. L., 2004, ApJ, 605, 216
- Collins, Shull, & Giroux (2005) Collins J. A., Shull J. M., Giroux M. L., 2005, ApJ, 623, 196
- Cooke et al. (2006a) Cooke J., Wolfe A. M., Gawiser E., Prochaska J. X., 2006a, ApJ, 652, 994
- Cooke et al. (2006b) Cooke J., Wolfe A. M., Gawiser E., Prochaska J. X., 2006b, ApJ, 636, L9
- Croton et al. (2006) Croton D. J., et al. 2006, MNRAS, 365, 11
- Dalla Vecchia & Schaye (2008) Dalla Vecchia C., Schaye J., 2008, MNRAS, submitted, [arXiv:0801.2770]
- Dopita & Sutherland (1996) Dopita M. A., Sutherland R. S., 1996, ApJS, 102, 161
- Ellison et al. (2007) Ellison S. L., Hennawi J. F., Martin C. L., Sommer-Larsen J., 2007, MNRAS, 378, 801
- Fangano, Ferrara, & Richter (2007) Fangano A. P. M., Ferrara A., Richter P., 2007, MNRAS, 381, 469
- Ferland et al. (1998) Ferland, G. J., Korista, K. T., Verner, D. A., Ferguson, J. W., Kingdon, J. B., & Verner, E. M., 1998, PASP, 110, 761
- Fitzpatrick & Spitzer (1997) Fitzpatrick, E.L., Spitzer, L. 1997, ApJ, 475, 623
- Fox et al. (2007a) Fox A. J., Ledoux C., Petitjean P., Srianand R., 2007a, A&A, 473, 791
- Fox et al. (2007b) Fox A. J., Petitjean P., Ledoux C., Srianand R., 2007b, A&A, 465, 171
- Fox et al. (2007c) Fox A. J., Petitjean P., Ledoux C., Srianand R., 2007c, ApJ, 668, L15
- Fox, Savage, & Wakker (2006) Fox A. J., Savage B. D., Wakker B. P., 2006, ApJS, 165, 229
- Gnat & Sternberg (2004) Gnat O., Sternberg A., 2004, ApJ, 608, 229
- Gnat & Sternberg (2007) Gnat O., Sternberg A., 2007, ApJS, 168, 213
- Haehnelt, Steinmetz, & Rauch (1998) Haehnelt M. G., Steinmetz M., Rauch M., 1998, ApJ, 495, 647
- Heckman et al. (2000) Heckman T. M., Lehnert M. D., Strickland D. K., Armus L., 2000, ApJS, 129, 493
- Henry, Edmunds, Köppen (2000) Henry R. B. C., Edmunds M. G., Köppen J., 2000, ApJ, 541, 660
- Henry, Nava, & Prochaska (2006) Henry R. B. C., Nava A., Prochaska J. X., 2006, ApJ, 647, 984
- Henry & Prochaska (2007) Henry R. B. C., Prochaska J. X., 2007, PASP, 119, 962
- Herbert-Fort et al. (2006) Herbert-Fort S., Prochaska J. X., Dessauges-Zavadsky M., Ellison S. L., Howk J. C., Wolfe A. M., Prochter G. E., 2006, PASP, 118, 1077
- Howk, Sembach, & Savage (2003) Howk J. C., Sembach K. R., Savage B. D., 2003, ApJ, 586, 249
- Howk, Wolfe, & Prochaska (2005) Howk J. C., Wolfe A. M., Prochaska J. X., 2005, ApJ, 622, L81
- Hubeny & Lanz (1995) Hubeny I., Lanz T., 1995, ApJ, 439, 875
- Jenkins et al. (2000) Jenkins E. B., et al., 2000, ApJ, 538, L81
- Jenkins & Tripp (2006) Jenkins E. B., Tripp T. M., 2006, ApJ, 637, 548
- Kawata & Rauch (2007) Kawata D., Rauch M., 2007, ApJ, 663, 38
- Kirkman & Tytler (1997) Kirkman D., Tytler D., 1997, ApJ, 484, 672
- Ledoux, Petitjean, & Srianand (2003) Ledoux C., Petitjean P., Srianand R., 2003, MNRAS, 346, 209
- Lehner (2002) Lehner N., 2002, ApJ, 578, 126
- Lehner & Howk (2007) Lehner N., Howk J. C., 2007, MNRAS, 377, 687
- Lehner et al. (2003) Lehner N., Jenkins E. B., Gry C., Moos H. W., Chayer P., Lacour S., 2003, ApJ, 595, 858
- Lehner, Keenan, & Sembach (2001) Lehner N., Keenan F. P., Sembach K. R., 2001, MNRAS, 323, 904
- Lehner, Wakker, & Savage (2004) Lehner N., Wakker B. P., Savage B. D., 2004, ApJ, 615, 767
- Lu et al. (1996) Lu L., Sargent W. L. W., Barlow T. A., Churchill C. W., Vogt S. S., 1996, ApJS, 107, 475
- Lu, Sargent, & Barlow (1998) Lu L., Sargent W. L. W., Barlow T. A., 1998, AJ, 115, 55
- Maller et al. (2001) Maller A. H., Prochaska J. X., Somerville R. S., Primack J. R., 2001, MNRAS, 326, 1475
- Maller et al. (2003) Maller A. H., Prochaska J. X., Somerville R. S., Primack J. R., 2003, MNRAS, 343, 268
- Martin (2006) Martin C. L., 2006, ApJ, 647, 222
- Mashchenko, Wadsley, & Couchman (2008) Mashchenko S., Wadsley J., Couchman H. M. P., 2008, Sci, 319, 174
- Matteucci (2001) Matteucci F., 2001, ASSL, 253
- Meiksin (2008) Meiksin A. A., 2008, Reviews of Modern Physics, submitted [arXiv:0711.3358]
- Morton (2003) Morton, D. C. 2003, ApJS, 149, 205
- Nicastro et al. (2003) Nicastro F., et al., 2003, Natur, 421, 719
- Nissen et al. (2007) Nissen P. E., Akerman C., Asplund M., Fabbian D., Kerber F., Kaufl H. U., Pettini M., 2007, A&A, 469, 3
- Noterdaeme et al. (2008) Noterdaeme P., Ledoux C., Petitjean P., Srianand R., 2008, A&A, 481, 327
- Oppenheimer & Davé (2006) Oppenheimer B. D., Davé R., 2006, MNRAS, 373, 1265
- Petitjean, Ledoux, & Srianand (2008) Petitjean P., Ledoux C., Srianand R., 2008, A&A, 480, 349
- Pettini (1999) Pettini M., 1999, cezh.conf, 233
- Pettini et al. (1999) Pettini M., Ellison S. L., Steidel C. C., Bowen D. V., 1999, ApJ, 510, 576
- Pettini et al. (2001) Pettini M., Shapley A. E., Steidel C. C., Cuby J.-G., Dickinson M., Moorwood A. F. M., Adelberger K. L., Giavalisco M., 2001, ApJ, 554, 981
- Prochaska et al. (2002a) Prochaska J. X., Henry R. B. C., O’Meara J. M., Tytler D., Wolfe A. M., Kirkman D., Lubin D., Suzuki N., 2002a, PASP, 114, 933
- Prochaska et al. (2003) Prochaska J. X., Gawiser E., Wolfe A. M., Castro S., Djorkovski S. G., 2003, ApJ, 595, L9
- Prochaska et al. (2002b) Prochaska J. X., Howk J. C., O’Meara J. M., Tytler D., Wolfe A. M., Kirkman D., Lubin D., Suzuki N., 2002b, ApJ, 571, 693
- Prochaska & Wolfe (1997) Prochaska J. X., Wolfe A. M., 1997, ApJ, 487, 73
- Prochaska & Wolfe (2002) Prochaska J. X., Wolfe A. M., 2002, ApJ, 566, 68
- Rauch et al. (2008) Rauch M., et al., 2008, ApJ, in press [arXiv:0711.1354]
- Savage & Lehner (2006) Savage B. D., Lehner N., 2006, ApJS, 162, 134
- Savage & Sembach (1991) Savage, B. D., Sembach, K. R. 1991, ApJ, 379, 245
- Savage & Sembach (1996) Savage B. D., Sembach K. R., 1996, ARA&A, 34, 279
- Savage, Sembach, & Howk (2001) Savage B. D., Sembach K. R., Howk J. C., 2001, ApJ, 547, 907
- Savage et al. (2003) Savage B. D., et al., 2003, ApJS, 146, 125
- Sembach et al. (1999) Sembach K. R., Savage B. D., Lu L., Murphy E. M., 1999, ApJ, 515, 108
- Sembach et al. (2003) Sembach K. R., et al., 2003, ApJS, 146, 165
- Shapley et al. (2003) Shapley A. E., Steidel C. C., Pettini M., Adelberger K. L., 2003, ApJ, 588, 65
- Simcoe, Sargent, & Rauch (2004) Simcoe R. A., Sargent W. L. W., Rauch M., 2004, ApJ, 606, 92
- Simcoe et al. (2006) Simcoe R. A., Sargent W. L. W., Rauch M., Becker G., 2006, ApJ, 637, 648
- Slavin, Shull, & Begelman (1993) Slavin J. D., Shull J. M., Begelman M. C., 1993, ApJ, 407, 83
- Sofia & Jenkins (1998) Sofia U. J., Jenkins E. B., 1998, ApJ, 499, 951
- Spitzer (1996) Spitzer L. J., 1996, ApJ, 458, L29
- Sutherland & Dopita (1993) Sutherland, R. S., Dopita, M. A. 1993, ApJS, 88, 253
- Tremonti, Moustakas, & Diamond-Stanic (2007) Tremonti C. A., Moustakas J., Diamond-Stanic A. M., 2007, ApJ, 663, L77
- Tripp et al. (2008) Tripp T. M., Sembach K. R., Bowen D. V., Savage B. D., Jenkins E. B., Lehner N., Richter P., 2007, ApJS, in press, [arXiv:0706.1214]
- Tripp et al. (2003) Tripp T. M., et al., 2003, AJ, 125, 3122
- Vladilo et al. (2001) Vladilo G., Centurión M., Bonifacio P., Howk J. C., 2001, ApJ, 557, 1007
- Vladilo et al. (2003) Vladilo G., Centurión M., D’Odorico V., Péroux C., 2003, A&A, 402, 487
- Weiner et al. (2008) Weiner B. J., Coil A. L., Newman, J. A., Cooper M. C., Prochaska, J. X., Rubin, K. H. R., 2008, 4th UC Irvine Center for Cosmology Workshop, submitted.
- White & Frenk (1991) White S. D. M., Frenk C. S., 1991, ApJ, 379, 52
- Wolfe & Chen (2006) Wolfe A. M., Chen H.-W., 2006, ApJ, 652, 981
- Wolfe, Gawiser, & Prochaska (2003) Wolfe A. M., Gawiser E., Prochaska J. X., 2003, ApJ, 593, 235
- Wolfe, Gawiser, & Prochaska (2005) Wolfe A. M., Gawiser E., Prochaska J. X., 2005, ARA&A, 43, 861
- Wolfe et al. (2004) Wolfe A. M., Howk J. C., Gawiser E., Prochaska J. X., Lopez S., 2004, ApJ, 615, 625
- Wolfe & Prochaska (2000a) Wolfe A. M., Prochaska J. X., 2000a, ApJ, 545, 591
- Wolfe & Prochaska (2000b) Wolfe A. M., Prochaska J. X., 2000b, ApJ, 545, 603
- Wolfe, Prochaska, & Gawiser (2003) Wolfe A. M., Prochaska J. X., Gawiser E., 2003, ApJ, 593, 215
- Wolfe et al. (2008) Wolfe A. M., Prochaska J. X., Jorgenson R. A., Rafelski M., 2008, ApJ, in press (arXiv:0802.3914)
- Wolfire et al. (1995) Wolfire M. G., McKee C. F., Hollenbach D., Tielens A. G. G. M., 1995, ApJ, 453, 673
- Wolfire et al. (2003) Wolfire M. G., McKee C. F., Hollenbach D., Tielens A. G. G. M., 2003, ApJ, 587, 278
- Yao & Wang (2007) Yao Y., Wang Q. D., 2007, ApJ, 666, 242
- Zech et al. (2008) Zech W. F., Lehner, N. Howk J. C., Dixon, W. V. D., Brown, T. M., 2008, ApJ, 679, 460
- Zsargó et al. (2003) Zsargó J., Sembach K. R., Howk J. C., Savage B. D., 2003, ApJ, 586, 1019