Collaborative Virtual Queue:
Fair Management of Congested Departure Operations and Benefit Analysis.
Abstract
Due to the stochastic nature of departure operations, working at full capacity makes major US airports very sensitive to uncertainties. Consequently, airport ground operations face critically congested taxiways and long runway queues.
In this report, we show how improved management of departure operations from the ready-to-push-back time to the wheels-off time can potentially yield significant benefits to airlines and air traffic services. We develop a Collaborative Virtual Queue to enable better optimization capabilities during congested situations while taking into account the laissez-faire competitive environment. Results are evaluated using a departure system model, validated using current statistics and previous studies. First, the Collaborative Virtual Queue enables keeping aircraft away from runway queues, which increases wheels-off time predictability. Second, holding aircraft enables last-minute intra-airline flight switching. This creates new optimization capabilities for airlines i.e. it gives airlines the flexibility to prioritize their flight sequence in real-time. These capabilities are illustrated by the trade-off between minimizing the average passenger waiting time and minimizing the level of unfairness between aircraft of the same airline. For instance, airlines could choose to decrease by up to 15% their average passenger waiting time by prioritizing heavy planes over small planes when the taxiway system is congested.
1 Introduction
The U.S. National Airspace System (NAS) is expected to accommodate between 2 and 3 times today’s traffic level by 2025. Along with a physical increase of airport capacity, the future generation of air transportation system will require new concepts of operations to handle the growth. Even though the development of smaller regional airports is expected, major airports will always have to run at full capacity. Some of them, in the NAS, will not be able to expand their capacity enough to sustain the increasing demand. Such airports are bound to become and remain air traffic bottlenecks. Airports such as New-York Laguardia will be physically restrained by the lack of space and the impossibility to add new runways or ramps.
To tackle this structural and organizational issue, the NextGen concept of operations [JPDO, 2007] encourages research on surface traffic operations aimed at lowering emissions and improving surface traffic planning (table 1). At the same time, the NextGen report also favors reducing the need for government intervention and control of resources ([JPDO, 2007], lines 1709 to 1726).
| Ref | Line Reference | Issue |
|---|---|---|
| R-46 | At times of peak demand, major airports conduct Super-Density Operations in which capacity-enhancing arrival and surface procedures are implemented to maximize runway throughput. | How will we design and implement systems to be resilient to failures and robust to operator error? |
| R-135 | Advanced capability to integrate and balance noise, emissions, fuel burn, land use, efficiency, and costs effects of alternative measures and alternatives allow selection of optimum operational modes, mitigation strategies, and surface planning procedures. | Identify improvements to surface planning procedures to reduce emissions. |
In the mean time, in Europe, EUROCONTROL is developing a Departure Manager (DMAN) system [EUROCONTROL, 2007]. The DMAN is a centralized concept of operations for surface traffic management. Though the DMAN would hardly fit the US decentralized and laissez-faire environment, its development introduces the use of Collaborative Decision-Making as a tool to manage departure operations. According to [EUROCONTROL, 2007] ,the DMAN “keeps the number of aircraft on the taxiway at an optimal level” and “keeps the taxiways open for other traffic without blocking stands for arrivals, reduces controller workload, improves punctuality and predictability, facilitates co-operation between aerodrome ATC, airlines and airport operators, enhances CFMU [Central Flow Management Unit slot-revisions] and slot-compliance, and exploits the departure capacity of the respective runway”.
Most studies on airport operations agree on the importance of controlling gate-holding and push-back sequencing. Optimization methods to increase airport throughput and reduce surface inefficiencies were developed. Anagnostakis, Clarke, Bohme, and Volckers [Anagnostakis et al., 2001] focused on sequencing and scheduling, Capozzi [Capozzi., 2003] on surface automated traffic control, and Balakrishnan [Balakrishnan and Jung., 2007] on coordinated surface operations from the gate to the take-off.
Other research accurately described the departure operations as queueing processes. Feron, Delcaire, and Pujet [Pujet et al., 1999] studied a queueing input-output model, Clarke, Feron, Carr and Evans [Carr et al., 2002] worked on modeling and controlling queueing dynamic under severe flow restrictions, and Husni, Clarke, Bhuva and Kang [Idris et al., 2001] developed a queueing model for taxi-out time estimations. These studies focused on the stochastic nature of ground operations, and pointed out the difficulty of a fine tuning of surface operations in congested situations. Furthermore, optimizing departure operations, especially in congested situations, is complicated by the competitive nature of departure operations. First, airlines have information privacy policies that make collaboration delicate. Second, airlines want to keep as much control as they can in departure operations.
This paper studies and estimates the potential benefits of using a Collaborative Decision Making concept which can preserve the decentralized laissez-faire environment of U.S airports: The Collaborative Virtual Queue (CVQ). The CVQ uses virtual queueing to hold planes away from runway queues and enable last-minute plane switching . We measure the creation of optimization capabilities and the improvement of take-off prediction robustness.
This paper is organized as follow: First the congestion problem is described. Second, Collaborative Virtual Queue operations are defined, explained, and compared to the actual Ground Delay Programs. Then, the Boston Logan airport departure operations are modeled, and calibrated using current flight data as well as taxiway maps. The last part focuses on congested situations and quantifies the optimization capabilities created by the Collaborative Virtual Queue (CVQ).
2 Problem Description
In major airports, airlines and air traffic service providers strategically optimize their operations to operate at full capacity during activity peaks. To do so, they assume good weather conditions. In other words, when the departure and arrival schedules are created, it is assumed that the available arrival and departure rates will not be limited for any reason other than regular runway capacity and safety constraints. Moreover, airlines sometime over-schedule flights regardless of airport resources. In addition to tight planning, the queueing nature of surface operations implies that there are enough planes out to ensure a constant takeoff demand reservoir [Carr et al., 2002] at runway thresholds. Consequently major airports are very sensitive to unexpected events that disrupt the throughput capacity. Congestion happens as a natural combination of tight operation planning and unpredictable events (for instance bad weather resulting in a first fix closure , i.e. closure of a departure route in the Terminal Radar Approach CONtrol (TRACON) area). At busy airports such as the Atlanta Airport, it is not surprising to have queues of 30 or 45 aircraft waiting to take off at runway thresholds.
To deal with congestion, the FAA, airports, and airlines have several options.
-
1.
They can try to eliminate congestion by:
-
(a)
Physically increasing their capacity (by building more runways, or by using microwave radar technology to monitor wake-vortex and reduce aircraft separation restrictions).
-
(b)
Forcing restrictions on departure planning, using slot restrictions.
-
(a)
-
2.
They can also optimize operations by:
-
(a)
Centralizing operations around airport authorities to ease collaboration, optimize throughput, and lower inefficiencies.
-
(b)
Using collaborative decision making to improve operations while respecting the competitive environment.
-
(a)
Solution 1-a, increasing airport capacity, is not always applicable. For example, at New York LaGuardia, there is not enough space to add any runway. Even when applicable, the demand for traffic stays high and congestion is reduced, but not suppressed. Solution 1-b, using slots restrictions, is enough to avoid obvious schedule overloading [Karp., 2006]. This method is necessary in some cases, and there are currently 4 federally slot-controlled airports (New York LaGuardia, New York JFK, Reagan Washington National, and Chicago O Hare). It prevents highly congested situations that could impact the whole National Airspace System. However slot restricted airports assume a constant departure rate which can only be achieved in good weather conditions. In other words, slot restrictions do not avoid unplanned throughput disruptions triggered by events such as frequent changes in wind direction (forcing the airport control tower to switch configuration several times during a short period), Ground Delay Programs, or simply first fix closures due to bad weather. Point 2-a, centralizing operations to ease collaboration, gives much power to airport authorities and air traffic services providers. This solution is far from usual operations in U.S. airports which have highly decentralized operations. Indeed private airlines control their ramp operations until aircraft are ready to push back. The control tower gives airlines clearance to push back on a First Come First Serve basis, as soon as their aircraft can physically push back and exit the ramp. Consequently, attempts to take control of push-back sequences and ground resources face high resistance from airlines. Besides, centralizing operations reduces the set of private airline responsibilities and suppresses the laissez-faire environment. Thus, it reduces free market incentives that continuously help improve operations and adapt services to passengers’ needs.
Collaborative Decision Making (CDM), Point 2-b, can help airport to reach an intermediate solution, that will not centralize operations. This paper studies the potential benefits of CDM applied to ground operations during congested situations. CDM has already proven its efficiency in Flow Management with Flight Schedule Monitor (FSM). Indeed, FSM is a system whose main role is to implement Ground Delay Programs when, at an airport, the arrival demand exceeds the arrival capacity. FSM enables airlines to collaboratively reschedule their flights to adapt the arrival demand to the reduced arrival capacity at the airport, as described in further details in section 3.3.
The competitive environment plays an important role. In most airports, airlines compete to both meet their on-time performance as well as to use airport resources. Therefore, in the absence of regulating policy, airlines react to a limited throughput capacity by trying to push back earlier [Mohleji and Tene., 2006] to get their planes in the queue as early as possible. Once aircrafts are queueing on the taxiway system, airlines lose optimization capabilities. Indeed, by “racing for the runway”, they lose the option to switch their flights and reorganize their takeoff sequence.
To manage congestion, any decentralized operation optimization scheme first needs to find a solution that provides airlines motivation for not stacking their planes in a saturated runway queue. This could be achieved by motivating airlines to keep planes at the gate or use additional parking spots to park planes while the departure system is saturated. Observations of a freight company operating as the sole operator at night at the Memphis airport confirmed that holding planes is the corner stone of optimizing congested departure operations. Indeed, at night at the Memphis airport, ramp operations are dominated by one large freight company which can optimize the number of planes taxiing and queueing for each runway. Holding aircraft, along with the control of runway queue lengths, enables the freight company to switch flights with respect to their priority level. This real-time optimization is especially useful when the departure rate is disrupted because it allows the most valuable aircraft to take off with a lower delay.
The biggest challenge faced by holding planes from queuing on the taxiway is space availability requirements for new arrivals (at the gate or on the taxiway). However, in most airports, two phenomena guarantee that free parking capacity could be exploited. First, gate occupation and parking space requirements are cyclical, everyday there is a time when the arrival rate is lower than the departure rate, this creates temporary capacity which could be used to hold aircraft. Second, airports capacity grows cyclically, when additional ramps are built, or taxiway is extended. The sudden increase in parking capacity allows more holding capacities, especially as the maximum departure rate remains unchanged until a new runway is built. Congestion will always happen, however CDM concepts can help increase flexibility of the departure flight sequence, yielding significant optimization capabilities.
3 The Collaborative Virtual Queue
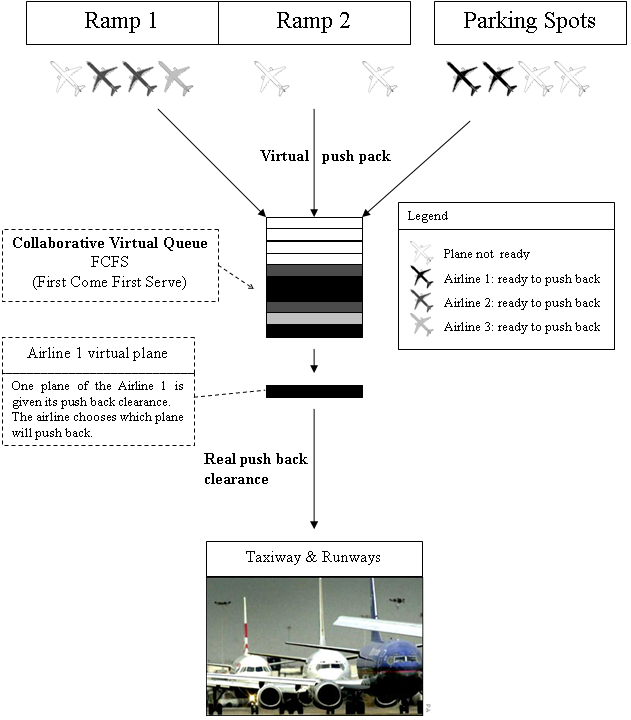
The Collaborative Virtual Queue (CVQ) is a queuing mechanism whereby pushback requests are stacked in a virtual queue, and planes are hold from taxiing to runway queues. Planes are hold at the gate or at tarmac parking spots. The queue is continuously skewed by pushback clearances from the Air Traffic Service Providers who decide if the departure system can handle additional traffic without sacrificing safety or performance. Figure 1 illustrates the CVQ concept.
The Collaborative Virtual Queue aims at enabling airlines to hold planes away from taxiway and runway saturated queues. By doing so, the CVQ would create last-minute flight switching capabilities, that airlines could exploit to improve their real-time departure operations. Besides, this mechanism would increase accuracy of taxiing time predictions as it would reduce the number of planes queueing on the taxiway.
As a result, when ground operations are competitive and congested, a CVQ would help control the level of taxiway congestion, while distributing to airlines their fair share of departure capacity and flexibility.
3.1 Time frame
The Collaborative Virtual Queue manages planes at the ramp between the ready-to-push-back time and the actual push-back time.
Uncertainties in turn times are an issue for any departure optimization process that would need to forecast precisely the plane ready time. Carr and Theis [Carr et al., 2003] described the limit of push-back forecasting as the limit of turn times predictability for future operations. They conclude that future Air Traffic Management processes must be designed with robust mechanisms for coping with push-back time variance. Supporting their study, Satish et al. [Mohleji and Tene., 2006] also observed that these uncertainties in ready to push-back times and in taxi-out times motivate airlines to use a time buffer in their push-back forecast when they file their flight plan.
As a result, to optimize congested operations while equitably respecting the competition, planes will participate in the Collaborative Virtual Queue only once there is no doubt left on their ready time, e.g., when the pilot asks for push-back clearance or when the doors are closed.
3.2 Sequence of operations
The section describes the CVQ concept of operations in details (Figure 1); it follows the sequence of events undergone by an aircraft.
-
•
When a plane on the ramp asks for a push-back clearance, the plane either stays at the gate or moves to an alternative parking spot. A matching virtual plane is created. This is a virtual push-back.
-
Virtual Plane
A Virtual Plane (VP) is a floating push-back clearance slot. It is a piece of information that identifies the airline which just got a plane ready. The VP contains the virtual push-back time. It can include any other aircraft information regarding the optimization of push-back sequencing, this information is private to the airline.
-
-
•
The virtual queue administrator stacks the virtual plane in the CVQ. There is one CVQ for all runways. Indeed, for the purpose of this study, it is assumed that the Air Traffic Control Tower balances runways by changing first fix runway allocations. As a result the plane pushes back toward the runway with the least number of planes (already queueing and/or taxiing toward it). Further study will integrate unbalanced runways managed by multiple CVQs.
-
•
Once the number of planes taxiing out falls below an optimal saturation threshold, the oldest virtual plane inside the virtual queue will be transformed into a push-back clearance for the airline that owns this virtual plane. The airline chooses to give the real push-back clearance to any of its planes which have already entered the Collaborative Virtual Queue and corresponds to the virtual plane description. This respects the competitive environment currently generated by the First-Come-First-Serve (FCFS) policy applied by Air Traffic Control Towers in most U.S. airports. Notice that this optimization capability does not interfere with other departure optimization processes happening before the ready time or after the push-back. It creates a buffer providing flexibility for the airline to switch flights with different degrees of priority in their take-off sequence. Figure 1 illustrates the CVQ based on a simple First-Come-First-Served policy.
-
•
If the departure system has enough capacity to receive all planes asking for push-back without saturating the system, the CVQ will be transparent to the departure operations.
3.3 Comparison with Ground Delay Program
The CVQ has many common points with the Ground Delay Program (GDP). The GDP is an initiative to manage the traffic flow into an airport. More precisely, it is a tool developed to decrease the rate of incoming flights into an airport as soon as it becomes highly probable that arrival demand will exceed capacity [Metron, 2006]. This happens when the Airport Acceptance Rate (AAR) is unexpectedly low due to weather or other conditions. For instance the Severe Weather Avoidance Procedures (SWAP) relies on the GDPs as a method available to hold flights on the ground.
Collaborative Decision Making within the GDP is enabled by the Flight Schedule Monitor (FSM). This collaborative system [Metron, 2006] is used by airlines, airports, and the Air Traffic Control System Command Center (ATCSCC) to implement Ground Stop, Ground Delay Program, and Airspace Flow Program strategies. Airports and airlines share their schedule information to enable common situational awareness.
FSM looks at all the known demand (scheduled flights and flight plans that have been entered in the Enhanced Traffic Management System (ETMS)). The core algorithm tries to equitably assign delays to all known flights in order to match the arrival demand to the airport arrival capacity. Airlines can watch arrival demand levels and ask for specific arrival slots but they do not have information on their competitors.
Although GDP operates on a strategic level (1 to 6 hours before arrival) and the CVQ on a tactical-opportunistic level (0 to 20 minutes before push-back), they have many similarities. The GDP creates departure slots to accommodate limited arrival capacity while the CVQ creates push-back slots to accommodate limited departure capacity. Both programs are aimed at optimizing demand with respect to a limited capacity in a competitive environment, and both reorganize operations using virtual queues (arrival slots in FSM form a virtual queue).
3.4 Data source and setting of parameters
Boston Logan Airport departure operations were first modeled without any Collaborative Virtual Queue, using the following sources: the existing description from the studies [Pujet et al., 1999; Carr et al., 2002; Idris et al., 2001], a study on push-back forecasting [Carr et al., 2003], current data from Airline Service Quality Performance (ASQP), Enhanced Traffic Management System Counts (ETMSC), Aviation System Performance Metrics (ASPM), and Google Earth.
The ASPM database provided us with flights’ historic times with a 60 second resolution for all flights which departed from the Boston Logan airport. These times include: gate out, taxi-out time, and wheels off times, allowing us to calibrate the departure rate, taxi-out speed, and push-back rate.
The flight carrier code given by the ASPM data enabled us to identify the participation of every airline in departure operations, from January 1st to September 30th 2006, at the Boston Airport. For privacy purposes, airline ICAO codes were replaced by grades from AA to CP, AA being the airline which had the most flights.
Table 2 shows the top 10 airlines (out of 67) and gives their ranking codes. Their cumulative participation represents 74% of the total departure operations during this period.
| Airline Grade | Nationality | Percentage of Departures |
| AA | USA | 10.60% |
| AB | USA | 9.27% |
| AC | USA | 9.04% |
| AD | USA | 8.95% |
| AE | USA | 8.14% |
| AF | USA | 6.77% |
| AG | USA | 5.93% |
| AH | USA | 5.87% |
| AI | USA | 5.87% |
| AJ | USA | 3.73% |
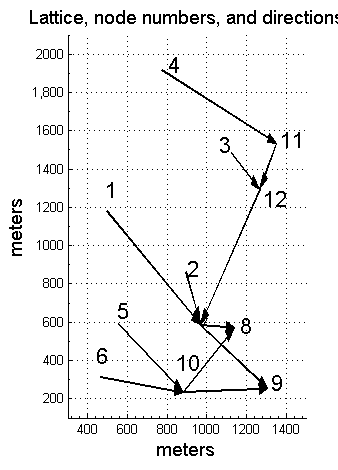
The taxiway topology is derived using Google Earth meter measurements. Figure 2 represents the lattice.
The number of seats per aircraft at Boston is derived from the database Enhanced Traffic Management System Counts (ETMSC, available at http://www.apo.data.faa.gov) combined to the ETMS Equipment code per flight, given by the ASPM database, average values are summarized per category in table 3.
| Plane Type | Percentage | Average Seats |
|---|---|---|
| Heavy | 16.73 | 214 |
| Large | 77.21 | 97 |
| Small | 6.06 | 4 |
4 Modeling of Airport Departure Ground Operations
In order to evaluate the Collaborative Virtual Queue concept of operations proposed in this paper, we modeled the Boston Logan airport operations, configured for departures on runways 9 and arrivals on runway 4R. Airlines hand over control of their plane to the Air Traffic Control Tower right after it pushed back [Pujet et al., 1999; Carr et al., 2002]. Congestion is expected on taxiways at times of high departure rate. This model will evaluate the flexibility capabilities enabled by last-minute plane switching and gate holding.
4.1 Departure System
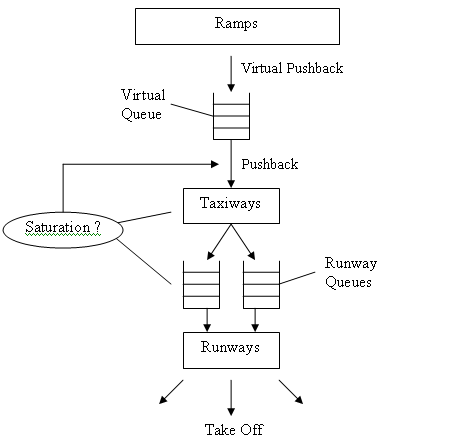
Several studies [Pujet et al., 1999; Carr et al., 2002; Idris et al., 2001] demonstrated that the degree of complexity and the number of unpredictable factors affecting ground operations are such that ground operations are best modeled by stochastic queueing models. This model (Figure 3) uses the same server structure as previous queueing models by Feron and Carr [Pujet et al., 1999; Carr et al., 2002] to generate take-offs. However, this model includes significant improvements over previous models. First, the taxiway system is modeled by a lattice. Aircraft taxi times are not determined directly, instead, the model simulates aircraft motion on the taxiway, from the gate to the runway. Second, previous models were event-driven, this model uses a time-driven simulation with a 30 second time step. Third, this model emulates airline push-back decisions by sweeping through different push-back policies, as illustrated as detailed in section 4.2.
Architecture
Figure 3 illustrates the architecture of the model. A virtual queue keeps track of ready planes at the ramps before they push back on the taxiway. Two runway queues link the taxiway system to each runway. The congestion level is estimated by counting the number of planes out on the taxiway and in the runway queues.
Departure Schedule
Aircraft appear at the ramps, their push-back schedule and weight category are determined from historic data, see section 3.4.
Model Virtual Queue
When a plane is ready (when it appears at the ramp), a virtual plane is created and stacked in the virtual queue (Figure 3, according to the process described in section 3.2). Once the departure system is not saturated anymore, the company who has the oldest virtual plane is allowed to push-back the aircraft of its choice (see section 4.2).
Taxiway
The topology of the airport taxiways, the ramp positions, and the runway positions are modeled using a lattice. When a plane pushes back, it takes the shortest path from the gate to the runway threshold. They move with a stochastic speed defined as follows: they move a constant distance at each simulation step unless an event (generated by a bernoulli variable) stops them. This variable was calibrate so that the distribution of taxi times would fit the estimated real distribution of taxi times. The real taxi time distribution was estimated by observing the taxi-out times when few planes where taxiing out (derived from ASPM database and [Pujet et al., 1999]).
Runways and Takeoffs
When aircraft reach the runway 9, they enter the departure runway queue as described by Figure 3. The runway itself is modeled as a server whose service rate is generated by the sum of 2 bernoulli variables. These variables are calibrated to fit the mean and standard deviation of the take-off rate when the number of planes out is higher than 12 (derived from ASPM database and [Pujet et al., 1999]).
4.2 Airline Push-back Policies
The Collaborative Virtual Queue gives airlines the opportunity to adjust their departure operations by choosing what plane to push-back at the last minute. Their push back policy can either (i) decrease the average time their passengers waited before take-off or (ii) minimize unfairness in waiting times among their planes. This trade-off illustrates the optimization capabilities generated by the Collaborative Virtual Queue.
Two push-back policies are at each end of this trade-off.
-
•
At one end, airlines can choose not to switch any flight, i.e. apply a First-Come-First-Served (FCFS) policy. In this case they minimize the unfairness in waiting times between their planes.
-
•
At the other end, airlines can choose to minimize the average time their passengers spend in the planes between ready time and wheels-off time. To do so, among the planes waiting for push-back in the CVQ, airlines always push back their heaviest plane first. Let “Heaviest Plane First” denote this policy.
Cost Functions
A cost function attributes a cost to holding planes. When an airline pushes back one of its ready planes, it chooses the plane whose holding cost is the highest.
The FCFS policy can be implemented using any strictly monotonic function of the holding time at the gate. One cost function which corresponds to the FCFS policy is:
The Heaviest Plane First (HPF) policy can be implemented using any cost function which respects the classification of plane sizes. One cost function which corresponds to the Heaviest Plane First (HPF) policy is:
A tunable cost function, combining and , was developed to gradually switch from a FCFS policy to a Heaviest Plane First policy. The parameter was swept from 0 to 1. For each value of , 64 days of operations were simulated using as the cost function for every aircraft.
Variable definitions:
- •
-
•
: Time a plane has been held at the gate since it is ready to push-back.
-
•
and are the costs attributed respectively to the FCFS and HPF policies.
-
•
is the sweeping parameter. It varies between 0 and 1. By sweeping it from 0 to 1, the push-back policy gradually switches from the FCFS policy () to the Heaviest Plane First policy ().
-
•
and are respectively the weights of (FCFS) and (HPF) in the total cost function . As varies, the ratio influences the distribution of intermediate trade-off policies between the FCFS policy and the HPF policy. The ratio is fixed at by trials and errors, it yields results well spread between the and cases.
4.3 Set Optimal Number of Planes Taxiing-Out
Second, the Collaborative Virtual Queue concept of operations was implemented.
We used the method described by Pujet et al. in [Pujet et al., 1999] to set an optimal gate holding threshold: gate holding can lower the operating costs because costs at the gate are lower than costs taxiing out, engines on. However the limitation of the number of planes taxiing out (i.e., load limit) must never limit the airport throughput. The limit needs to be above 9 airplanes taxiing out in order to not limit the departure rate.
5 Results
The the Boston Logan departure operations are simulated, configured with departures on runway 9 and arrivals on runway 4R.
5.1 Reduction of Taxi-out Time Uncertainty
Figure 4 illustrates the relationship between the number of planes taxiing out and the uncertainty of the average taxi-out time.
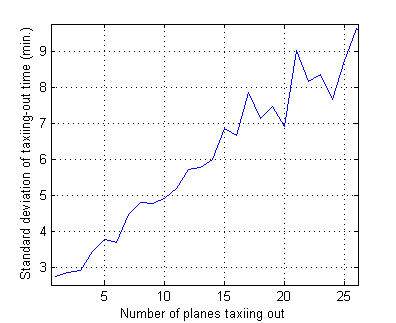
When the CVQ is activated and the maximum number of planes out set to 9, the model gives an overall taxi-out average of 13 minutes with a standard deviation of 5 minutes, the average number of planes out when a plane pushes back is then 7 planes out.
Similar actual operating conditions (limiting the number of planes taxiing out) yielded similar results. Indeed, during a visit at the Memphis airport, we conducted interviews and observed operations: the number of planes taxiing is limited. During the day, traffic is light. At night, one freight company controls most of the airport ramps; as a result, the freight company limits the number of planes taxiing out to 8 planes per runway. Therefore, the conditions at Memphis are close to the conditions simulated for a Collaborative Virtual Queue (CVQ) at the Boston Airport, with a limit of 9 planes out for one runway.
To conclude, the results show that for a limit set at 9 planes out, the uncertainty in taxi-out time is limited to 5 minutes without limiting the airport throughput. Even in a competitive environment, using a Collaborative Virtual Queue, airlines could achieve a prediction performance close to the one achieved at Memphis airport.
5.2 Real-time Intra-Airline Optimization Benefits
This section studies optimization capabilities created by the possibility to modify the push-back sequence. Indeed, the Collaborative Virtual Queue enables gate holding and last-minute flight switching in the push-back sequence. The maximum number of planes taxiing out is set to 9 in order to maximize the airport throughput, this respects the condition given by the previous section 4.3.
5.2.1 Trade-off and Flexibility
First, we illustrate the trade-off which exists between optimizing waiting times for passengers, and minimizing unfairness among departing aircraft. To do so, we simulate departure operations while sweeping through different cost functions (section 4.2):
-
•
corresponds to a FCFS push-back policy and minimizes unfairness among departing aircraft.
-
•
corresponds to a Heaviest Plane First policy and minimizes passenger waiting times.
For every intermediate trade-off policy, 64 days of operations were simulated, i.e. for every varying from 0 to 1 by 0.05 steps in the cost function. We simulated departure operations assuming departure operations were dominated by 3 independent airlines. Indeed, at the Boston Logan Airport, 3 out of 68 airlines represented 30% of departure operations, from January to September 2006. In the next section we study in more details the influence of distributions of airline departure operations on the CVQ.
On average, small planes carry 4 passengers, medium carry 97, and heavy planes carry 214.
Figure 5 illustrates the average passenger waiting time 111The average passenger waiting time is defined as the weighted average of plane waiting times, using the number of passengers per plane as the weights. The plane waiting time is the time between ready-to-push-back and wheels-off., for at 0, 0.5, and 1 (see section 4.2). The top curve, = 0, shows the average passenger waiting time in the FCFS case, i.e. when there is no optimization. The bottom curve, = 1, shows the average passenger waiting time in the Heaviest Plane First case. The curve = 0.5 represents an intermediate policy, where heavy planes have an advantage but are not systematically more important than small planes which have been waiting longer at the gate for push-back clearance. There is no difference between the curves if the number of active planes 222The number of active planes is the number of planes whose state is between ready-to-push-back and wheels-off. is below 9, i.e. below the gate-holding threshold, because the Collaborative Virtual Queue has no influence on operations. However, when the number of active planes saturates the airport departure capacity, the Collaborative Virtual Queue gives to companies the option to use optimization capabilities to lower the average passenger waiting time. This is why at 20 active planes out, the curve = 1 is 7.5 minutes below the FCFS = 0 curve.
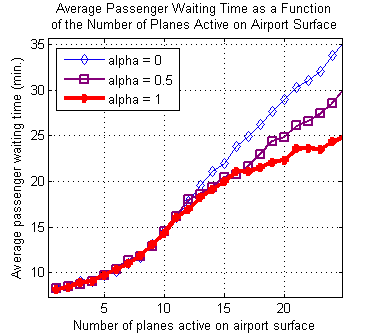
Although airlines can improve the average passenger waiting time, there is a clear trade-off between optimizing average passenger waiting time and minimizing unfairness between aircraft within the same airline. This trade-off represents the new optimization capabilities, enabled by the Collaborative Virtual Queue. Airlines have the opportunity to use this trade-off to adjust their operations in real-time, with respect to their business priorities.
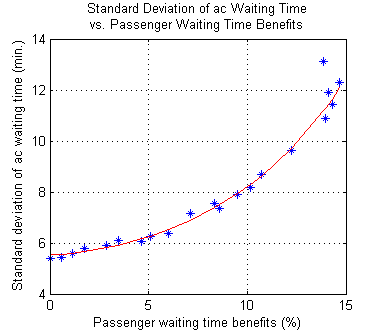
Figure 6, Figure 8 and Figure 7 illustrate this trade-off. In the 3 figures, plain lines represent fitted curves and points represent simulation results. The 3 distributions where fitted using functions of the type: , where are fitting parameters and is the passenger waiting time benefits in (%).
Figure 6 illustrates unfairness between aircraft waiting time as a function of benefits in passenger waiting times . The average unfairness of waiting times between planes is illustrated by the standard deviation of the plane waiting times, it is minimum when there is no last-minute plane switching and , and maximum for , for the Heaviest Plane First policy. The percent of passenger benefits is estimated by comparing the average passenger waiting time for a specific , to the average passenger waiting time for , in the FCFS case (FCFS represents the no-optimization case and serves as a reference). Figure 6 shows that to reduce by 10% the average waiting time, airlines increase the standard deviation of their aircraft waiting times by 2.5 minutes.
The next figures details how the trade-off affects every type of plane.
Figure 7 displays the evolution, in percent, of the aircraft waiting time, for each aircraft type, as a function of the passenger waiting time benefits. The evolution rate of the aircraft waiting time was estimated by comparing the average waiting time of same-type aircraft to the average waiting time of all aircraft 333The expected average waiting time of all aircraft is not affected by changes of policy. Indeed, when a company decides to push back a plane before another one, the company departure rate remains the same, it transfers the delay from one plane to another. The simulation confirmed that the average plane waiting time was constant.. Figure 7 illustrates, for instance, that a policy, yielding a 40% increase in average waiting times for small planes, a quasi status-quo for medium planes, and a 27% decrease for heavy planes, results in a 10% decrease in the average passenger waiting time. This policy corresponds to .
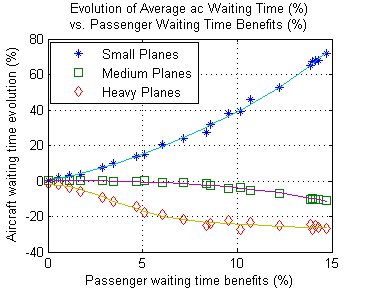
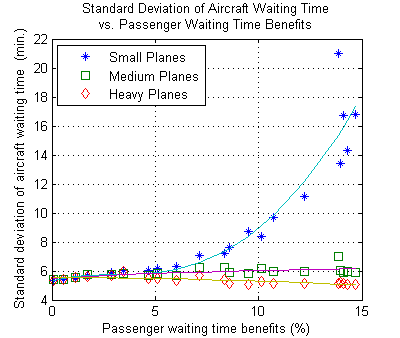
Figure 8 is similar to figure 6, but it details the standard deviation of plane waiting times for each type of plane: small, medium , or heavy. One can observe that for high values of , it decreases the standard deviation of waiting time for heavy planes, while it dramatically increases it for small planes. For instance, a policy yielding a 10% decrease in the average passenger waiting time induces a slight 20 second improvement in uncertainty of waiting time for heavy planes. In the mean time, this policy increases the standard deviation of waiting times by 30 seconds for medium planes, and by 3 minutes for small planes. Considering that small planes have on average 10 times fewer passengers than medium planes and 20 times fewer passengers than heavy planes, this policy would represent a plausible airline choice.
5.2.2 Influence of Airline Departure Distributions
Airline shares of departure operations influence optimization capabilities. To analyze their impact, results were simulated using several distributions of airline departure operations. Figure 9 illustrates the 3 departure distributions studied. The first distribution corresponds to a monopoly, the second distribution corresponds to 5 airlines sharing all departure resources, and the last corresponds to 10 airlines sharing all departure resources. The monopoly was simulated by assigning the same airline to every departure. The two other airline distributions with 5 and 10 different airlines were obtained by selecting the 5 or 10 first airlines (airline ranks and departure shares are given in table 2) and distributing the rest of the remaining departures to these airlines.
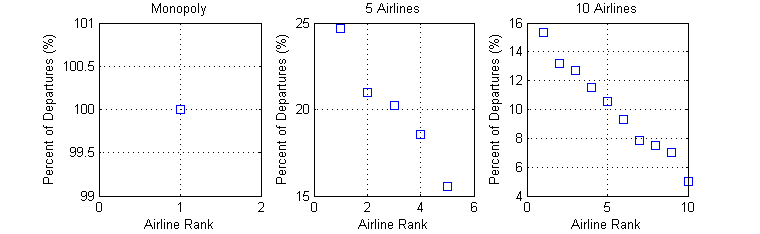
The case where 10 airlines share departure operations is a good approximation of actual airline departure operations at the Logan Airport. Indeed the first 10 airlines share 74% of the total departure operations at the Logan Airport, while each of the other 58 airlines which departed during the same period represent less than 3.5% each, totaling 26% of departure operations.
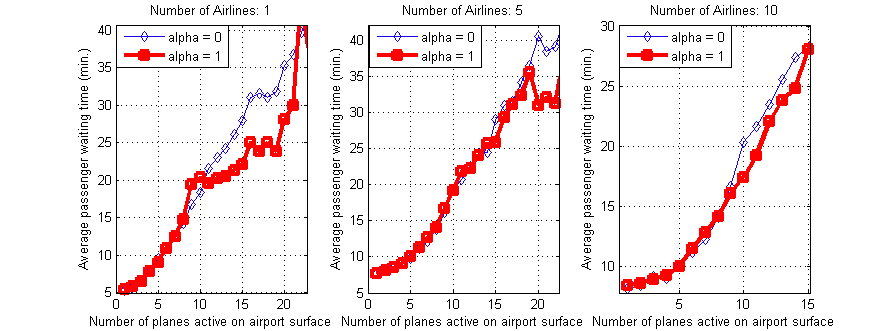
Figure 10 shows that the average passenger waiting time can still be significantly reduced when departure operations are dominated by 10 airlines. Indeed, during congested departure operations, a Heaviest Plane First policy () could save up to 12% of passenger waiting time.
5.3 Benefits Summary
The implementation of a Collaborative Virtual Queue can lower operating costs, and increase taxi-out time predictions. It can generate flexibility, yielding additional optimization capabilities. These can be used, for instance, to lower the average waiting time per passenger, or lower the wheels-off time unpredictability for heavy planes (containing in average 214 passengers) at the expense of small planes (containing in average only 4 passengers).
The CVQ relates to NextGen Concepts of Operations. It provides more flexibility to airlines and reduces the need for government intervention. It also helps the scalability in traffic load and demand by enabling gate holding. Thus it follows key characteristics of the NextGen report [JPDO, 2007] NextGen chap 1.2.2.1 and chap 1.2.2.9. In addition, a CVQ can potentially increase predictability of wheels-off times by decreasing useless taxiway queueing. As such, it helps maintaining “efficient operations at peak capacity without sacrificing safety” NextGen report chap 3.1.1.
Consequently, airlines which “participate in the collaboration process are better able to achieve their own objectives within the constraints imposed by overall traffic demand or short-term effects such as weather or airspace restrictions” NextGen report chap 2.3.
Note that the Collaborative Virtual Queue concept does not intend to dictate a specific optimization scheme and will let airlines decide what is best for their business model, it merely opens new degrees of freedom.
6 Conclusion
In this paper, we have introduced the concept of Collaborative Virtual Queue (CVQ): building upon previous gate holding concepts, we explore the possibility for airlines to exploit the stack generated by virtual queueing mechanism to reorganize their departure sequence.
Airlines can transfer delays between different flights according to their level of priority. The level of flexibility allowed by this strategy has been illustrated by the trade-off between two factors, the average waiting time per passenger, and the level of unfairness between the airline aircraft.
The CVQ concept favors some restrictions, but only when a real operational need exists. Because the CVQ mechanisms are based on collaboration between private airlines, it reduces the need for government intervention and control of resources. NextGen CONOPS [JPDO, 2007] encourage such collaborative concepts.
Further study will determine in more details the impact of different competitive environments, of ramp topology, and the CVQ concept will evolve to include arrival control and gate management.
References
- Anagnostakis et al. [2001] I. Anagnostakis, J.P. Clarke, D. Bohme, and U. Volckers. Runway Operations Planning and Control: Sequencing and Scheduling. Journal of Aircraft, Massachusetts Institute of Technology, Cambridge, MA 02140, and DLR German Aerospace Research Center, 38108 Brunswick, Germany, 2001.
- Balakrishnan and Jung. [2007] H. Balakrishnan and Y. Jung. A Framework for Coordinated Surface Operations Planning at Dallas-Fort Worth International Airport. American Institute of Aeronautics and Astronautics, Massachusetts Institute of Technology, Cambridge, MA 02140, 2007.
- Capozzi. [2003] B.J. Capozzi. Automated Airport Surface Traffic Control. American Institute of Aeronautics and Astronautics, Metron Aviation, Inc., Herndon, VA 20170, 2003.
- Carr et al. [2002] F. Carr, A. Evans, J.P. Clarke, and E. Feron. Modeling and Control of Airport Queuing Dynamics under Sever Flow Restrictions. International Center for Air Transportation, Massachusetts Institute of Technology, Cambridge, MA 02140, 2002.
- Carr et al. [2003] F. Carr, G. Theis, J.P. Clarke, and E. Feron. Evaluation of Improved Pushback Forecasts Derived from Airline Ground Operations Data. Journal of Aerospace computing, information, and communication, http://www.aiaa.org, 2003.
- EUROCONTROL [2007] EUROCONTROL. Airport Collaborative Decision Making. EUROCONTROL, http://www.eurocontrol.int/airports/public/standard_ page/APR2_ ACDM.html, 2007.
- Idris et al. [2001] H. Idris, J.P. Clarke, R. Bhuva, and L. Kang. Queuing Model for Taxi-Out Time Estimation. Massachusetts Institute of Technology, Cambridge, MA 02140, 2001.
- JPDO [2007] JPDO. Concept of Operations for the Next Generation Air Transportation System. Joint Planning and Development Office, 2007.
- Karp. [2006] A. Karp. Size Matters at LaGuardia. Air Transport World, http://www.atwonline.com, 8380 Colesville Rd., Suite 700, Silver Spring, MD 20910, 2006.
- Metron [2006] Metron. Flight Schedule Monitor, User s Guide. Federal Aviation Administration, Traffic Management Applications, http://cdm.fly.faa.gov/products/fsm1.html, 2006.
- Mohleji and Tene. [2006] Mohleji and Tene. Minimizing Departure Prediction Uncertainties for Efficient RNP Aircraft Operations at Major Airports. The MITRE Corporation Center for Advanced Aviation System Development, McLean, VA 22102, 2006.
- Pujet et al. [1999] N. Pujet, B. Delcaire, and E. Feron. Input-output modeling and control of the departure process of congested airports. American Institute of Aeronautics and Astronautics, Massachusetts Institute of Technology, Cambridge, MA 02140, 1999.