SN2007ax : An Extremely Faint Type Ia Supernova
Abstract
We present multi-band photometric and optical spectroscopic observations of SN2007ax, the faintest and reddest Type Ia supernova (SN Ia) yet observed. With MB = 15.9 and ()max = 1.2, this SN is over half a magnitude fainter at maximum light than any other SN Ia. Similar to subluminous SN2005ke, SN2007ax also appears to show excess in UV emission at late time. Traditionally, m15() has been used to parameterize the decline rate for SNe Ia. However, the B-band transition from fast to slow decline occurs sooner than 15 days for faint SNe Ia. Therefore we suggest that a more physically motivated parameter, the time of intersection of the two slopes, be used instead. Only by explaining the faintest (and the brightest) supernovae, we can thoroughly understand the physics of thermonuclear explosions. We suggest that future surveys should carefully design their cadence, depth, pointings and follow-up to find an unbiased sample of extremely faint members of this subclass of faint SNe Ia.
Subject headings:
keywords1. Introduction
Inspired by the application as a standard cosmological candle, the progress in understanding Type Ia supernovae (SNe Ia) has grown in leaps and bounds. However, the understanding of their weakest subluminous cousins has been purposefully overlooked as their atypical light curve and atypical spectra make them contaminants for cosmological studies. We suggest here some characteristics that make the physics of the explosions of faint SNe Ia intriguing in their own right.
In this paper, we present SN2007ax which, with a peak absolute magnitude of MB = 15.9 and ()max = 1.2, is the faintest and reddest Type Ia supernova yet discovered. Although the class of SNe Ia is remarkably homogenous, subluminous SNe Ia show atypical spectral and light curve features (Garnavich et al. 2004, Taubenberger et al. 2007). Photometrically, not only do they fade much faster than predicted by the Phillips relation, they are also very red at maximum and (at least SN2005ke and SN2007ax) appear to show UV excess at late-time. Spectroscopically, they have broad Ti II features and moderate expansion velocities.
SN2007ax was discovered in NGC 2577 on UT 2007 Mar 21.978 by Arbour (2007) at an unfiltered magnitude of 17.2. Upper limits of 18.5 mag on Mar 17.636 and 19.0 mag on Mar 9.959 were also reported. Spectra obtained on Mar 26 by Blondin et al. (2007) and Morrell & Folatelli (2007) showed that it was a SN Ia near maximum light similar to SN1991bg.
In this paper, we present multi-epoch, multi-band imaging and spectroscopic follow up of SN2007ax including optical, ultraviolet, and near-infrared. We summarize our observations in § 2, present our analysis and comparison with other faint SNe Ia in § 3 and discuss possible scenarios for faint thermonuclear explosions in § 4. We conclude with how future surveys can systematically design their cadence, limiting magnitude and pointings to search for more members belonging to this subclass of faint SNe Ia.
2. Observations and Data Reduction
The automated Palomar 60-inch telescope (Cenko et al., 2006) started daily observations of SN2007ax on UT 2007 Mar 29 in and bands . Data were reduced using custom routines. Aperture photometry was done after image subtraction using two custom modifications of the ISIS algorithm (Alard & Lupton, 1998), hotpants111http://www.astro.washington.edu/becker/hotpants.html and mkdifflc (Gal-Yam et al. 2004, Gal-Yam et al. 2007). The two reductions gave consistent results. Errors were estimated by first placing artificial sources of the same brightness and at the same distance from the galaxy center as the SN and then measuring the scatter in measured magnitudes. Finally, the zeropoint was calibrated with reference magnitudes of stars from the Sloan Digital Sky Survey (Adelman-McCarthy et al., 2007).
We triggered Target of Opportunity observations to obtain spectra with the Double Beam Spectrograph (Oke & Gunn, 1982) on the Hale 200-inch telecope. Two spectra were obtained around maximum light (UT 2007 Mar 29 and Mar 30) and a third a fortnight later (Apr 13). Spectra were taken using the red grating 158/7500, blue grating 300/3990 and using a dichroic to split the light at 5500 Å . This gave us a total wavelength coverage of 3800 Å - 9000 Å and dispersion of 4.9 Å pix-1 and 2.1 Å pix-1 on the red and blue side, respectively. Data were reduced using the standard IRAF222IRAF is distributed by the National Optical Astronomy Observatories, which are operated by the Association of Universities for Research in Astronomy, Inc., under cooperative agreement with the National Science Foundation package apall.
We triggered Swift Target of Opportunity observations for SN2007ax starting UT 2007 Mar 29.84 and obtained eight epochs of roughly five kiloseconds each distributed between the and bands. We also obtained a reference image over eight months after peak to subtract galaxy light. Aperture photometry was performed using a 3 circular radius. To estimate the galaxy brightness at this location, a 3 aperture at the supernova position in the reference image was used. Poole et al. (2007) photometric zeropoints were applied after appropriately scaling for aperture size. For consistency with calibration, a 5 aperture was used in the computation of coincidence loss. The supernova is detected in in four epochs, and not detected in the and filters. The band light curve was independently reduced using image subtraction with consistent results. We note that due to the faintness of the supernova and brightness of galaxy background, coincidence loss is dominated by the galaxy light and not a point source, possibly introducing a systematic error in the Swift , , and bands.
Further late-time observations were obtained using the SLOTIS and Bok telescopes and light curves were obtained using image subtraction based on ISIS and IRAF routines. We also obtained near infrared imaging using the Keck NIRC2 instrument with Natural Guide Star adaptive optics on UT 2007 Apr 4.
3. Analysis
We present analysis of the optical and ultra-violet light curve and optical spectrum of SN2007ax below. We also compare it to other subluminous SN Ia. We adopt a distance modulus of 32.2 (B. Tully, pers. comm.) to NGC 2577.
3.1. Optical Light Curve
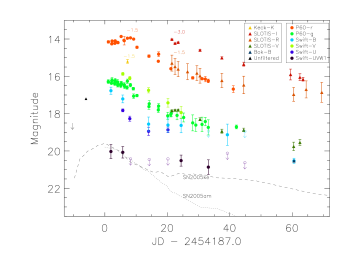
We plot the multi-band light curve of SN2007ax in Figure 1. The key characteristic of SN2007ax is its rapid decline. Traditionally, m15 (the difference between the peak B-mag and the B-mag 15 days after the peak) has been used to parametrize the decline of the light curve. However, this parameter can be misleading when applied to the faint SNe Ia because the knee in their light curve (transition from fast initial decline to slow late-time decline) is sooner than fifteen days from the peak. Therefore, we choose to compare the light curves of subluminous Ia using three parameters first introduced by Pskovskii (1984) - initial slope (), late-time slope () and the time of intersection of the two slopes (tb). This time of intersection parameter (defined from maximum in B-mag) was also used by Hamuy et al. (1996) as t and shown to be empirically proportional to m15 for some SNe Ia.

| Supernova | Galaxy | DM | MB,max | tb | ()max | Reference | ||
|---|---|---|---|---|---|---|---|---|
| mag | mag/day | mag/day | days | mag | ||||
| SN2007ax | NGC 2577 | 32.2 | 15.90.2 | 0.16 | 0.04 | 10.3 | 1.2 | This Paper |
| SN1991bg | NGC 4374 | 31.2 | 16.60.3 | 0.16 | 0.03 | 14.8 | 0.8 | Leibundgut et al. (1993),Filippenko et al. (1992) |
| SN1998de | NGC 252 | 34.3 | 16.80.2 | 0.18 | 0.03 | 14.5 | 0.7 | Modjaz et al. (2001) |
| SN2005ke | NGC 1371 | 31.8 | 17.00.2 | 0.15 | 0.02 | 14.9 | 0.7 | Immler et al. (2006) |
| SN2005bl | NGC 4070 | 35.1 | 17.20.2 | 0.18 | .03 | 14.0 | 0.6 | Taubenberger et al. (2007) |
| SN1999by | NGC 2841 | 30.9 | 17.30.2 | 0.18 | 0.02 | 16.0 | 0.5 | Garnavich et al. (2004) |
For the subclass of faint SNe Ia, we find that tb is better correlated with the peak absolute B-mag than and slopes of the B-band light curve. We fit an empirical relation to the intersection time as a function of peak absolute magnitude and find that . Moreover, this transition to slower decline should represent the time at which the optical depth to thermalized radiation becomes thin. We report these three parameters for a sample of subluminous SNe Ia in Table 1 and and show the linear fits in Figure 2.
Another crucial property of subluminous SNe Ia is that the fainter they are, the redder they are at maximum. We find that SN2007ax is consistent within uncertainties of the empirical relation derived first by Garnavich et al. (2004) : . This relation predicts a color in the range of 1.0–1.3 mag and we observe 1.2 0.1 mag. This color has been derived based on synthetic photometry of the spectra around maximum.
3.2. Ultraviolet Light Curve
In Figure 1, we compare the Swift UVOT light curve of SN2007ax to another subluminous SN Ia 2005ke (Immler et al., 2006) and a typical SN Ia 2005am (Brown et al., 2005). The key similarity between SN2005ke and SN2007ax is that both show an excess in UV starting 20 days after the peak. Immler et al. (2006) propose that SN2005ke showed a UV excess due to circumstellar interaction. Perhaps, subluminous supernovae are optically thin below 3800 Å simply due to lower production of iron-group elements. The question of whether UV excess is a more general property of faint SNe Ia merits further investigation with timely follow-up of a larger sample. With a larger sample, one could also consider whether the break in the UV light curve also depends on absolute magnitude.
3.3. Spectral Evolution
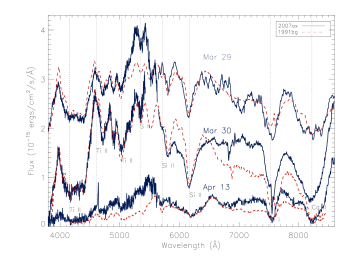
We compare optical spectra of SN2007ax to SN1991bg in Figure 3. The prominent absorption features are Ti II, O I, Si II and Ca I. The presence of intermediate mass elements like Oxygen and Titanium is indicative of the presence of unburned material or a low burning efficiency. The absorption features become broader as the supernova evolves. Comparing our spectra to SN1991bg one day, two days and sixteen days after maximum in B-band, we find that the spectra are very similar. In the first epoch, we see a hint of carbon in the small bump immediately redward of the Si II feature at 6150 Å . However, the signal-to-noise ratio in the spectrum is too low for any conclusive evidence.
Using the technique described by Nugent et al. (1995), we estimate the temperature diagnostic R(Si II) – the ratio of the depths of the two Si II features at 5800 Å and 6150 Å – to be 0.33. This is smaller than what is implied by the empirical relations derived by Garnavich et al. (2004) and Taubenberger et al. (2007).
We also measure the velocity of the Si II 6150 Å line in the two epochs around maximum and we obtain 9300 km s-1 and 8800 km s-1. This is consistent with lower velocities observed in other faint SNe Ia (Benetti et al., 2005).
3.4. NIR Imaging and Extinction
We measure a K′ magnitude of 16.7 0.1 on UT 2007 Apr 4. We determined the contribution of galaxy light at the supernova position by fitting a Sersic profile to the galaxy using GALFIT (Peng et al., 2002). The best-fit parameters are : a Sersic index of 1.90, axis ratio of 0.60, effective radius of 4.98, position angle of 105.6∘ and diskiness of 0.14. We find no evidence of dust lanes in this image suggesting that the host extinction is minimal. This is also consistent with the absence of the interstellar Na D line at 5893 Å . We compute an upper limit on the equivalent width as 0.1 Å . Using the relations derived in Turatto, Benetti & Cappellaro (2003), we get an upper limit of E() 0.01 mag on the extinction.
Based on the Galactic position, l=201.1∘, b=29.6∘, the extinction along the line of sight is E()=0.054 mag (Schlegel, Finkbeiner & Davis, 1998). Therefore, we account for AB = 0.23 and Av= 0.18 in our calculations of absolute magnitude and luminosities.
3.5. Bolometric Luminosity and 56Ni Mass
Arnett, Branch & Wheeler (1985) gives an estimate of the 56Ni mass in the ejecta using the peak bolometric luminosity and the rise time:
For SN2007ax, the extinction-corrected peak bolometric luminosity is 2.31042 ergs s-1. We estimate this by using the photometric points to calibrate our spectrum near maximum light and integrating. The rise-time is unknown and unfortunately, the literature somewhat arbitrarily assume 17 days for faint SNe Ia and 19.5 days for typical SNe Ia. Recently, Taubenberger et al. (2007) used SN1999by early-time data to estimate a rise-time of 14 days. The only observational constraint we have for SN2007ax is that the rise-time is longer than 6 days. Thus, for the range of rise-times from 6–14 days, we find a 56Ni mass of 0.05–0.09 M⊙. This is consistent with other techniques to estimate 56Ni of faint SNe Ia — for SN1991bg, Cappellaro et al. (1997) model the V-band light curve and obtain a mass of 0.1 M⊙, and Mazzali et al. (1997) model the photospheric and nebular-epoch spectra and obtain 56Ni mass of 0.07 M⊙.
4. Discussion
To summarize, the primary observational characteristics of subluminous SNe Ia (of which SN2007ax is an extreme case) are small tb in the optical -band light curve, extremely red color at maximum, possible excess in UV emission at late-time, presence of intermediate mass elements in spectra, medium ejecta velocities, low 56Ni mass in ejecta and short rise-times.
Several theoretical models have been proposed to explain faint SNe Ia – complete detonation of a sub-Chandrashekhar mass white dwarf, a delayed detonation model, a failed neutron star model and a small scale deflagration model. The detonation of a sub-Chandrashekhar C-O white dwarf (e.g. Livne 1990, Woosley & Weaver 1994) produces more 56Ni than observed and is more blue at maximum than observed (Hoeflich & Khokhlov, 1996). If we consider detonation of a sub-Chandrashekhar O-Ne-Mg white dwarf (Isern, Canal & Labay, 1991), the total nuclear energy is smaller and the predicted ejecta velocities are lower than observed (Filippenko et al., 1992). Mazzali et al. (2007) use detailed spectral modeling to show a common explosion mechanism for all SNe Ia, likely delayed detonation. The failed neutron star model (Nomoto & Iben, 1985) suggests that if the accretion rate of carbon and oxygen from a companion onto a white dwarf is high enough, it may prematurely ignite CO on the white dwarf surface. Thus, instead of a neutron star, we may see a faint SNe Ia. Small-scale deflagration models suggest that either the burning is restricted to the outer layers or that it occurs slowly.
Another intriguing theoretical possibility recently proposed by Bildsten et al. (2007) is faint thermonuclear supernovae from ultracompact double degenerate AM CVn systems. This supernova is tantalizingly at the brightest end of their predictions (MV=14 to 16, timescale = 2–6 days, M 0.1 M). However, the decay time predicted by these models is much shorter and the 56Ni mass less than that observed in SN2007ax. Also, the spectrum does not show any feature which suggests being powered by different radioactive material (48Cr, 44Ti, 52Fe) produced by some of these models.
None of the above models convincingly explain all the observed characteristics of subluminous SNe Ia. SN2007ax compels the question of what is the (and whether there is) lower limit of 56Ni mass in a thermonuclear explosion. Only if we can explain the extremely faint (and the extremely bright) supernovae will we thoroughly understand the limitations in physical processes involved in the thermonuclear explosion, in particular, the 56Ni mass production.
Future supernova surveys which have a shorter cadence and a deeper limiting magnitude will provide invaluable clues to understanding the nature of subluminous SNe Ia. Follow-up of these supernovae with well-sampled UV light curves and well-calibrated multi-epoch UV spectra would also be important to understand the apparent excess at late-time.
We suggest how a near-future survey, for example, the Palomar Transient Factory333The Palomar Transient Factory is a dedicated time-domain astronomy project to come online on Palomar 48-inch in Nov 08., can systematically search for faint SNe Ia. The parameters of the survey design are sky coverage, cadence, depth, filter and choice of pointings. Howell (2001) shows that faint SNe Ia occur preferentially in early-type galaxies and Taubenberger et al. (2007) suggest that they occur in lower metallicity, old stellar mass populations. Since they decline by a magnitude in five days, the cadence of the search should be faster than five days so that the detection sample is complete. Since faint SNe Ia are extremely red at maximum, we should choose a red filter for the search. To maximize sky coverage, searching with a single red filter should suffice (with multi-band follow-up). Since the local universe is clumpy (e.g. : 25% of the total light at the distance of Virgo is in the Virgo supercluster), the sky coverage must include concentrations in stellar mass, such as the Virgo, Perseus and Coma galaxy clusters. The rate of normal SNe Ia is 3 per 1011L⊙ per century (Scannapieco & Bildsten, 2005). Li et al. (2001) estimate a rate for subluminous SNe Ia to be 16% of normal SNe Ia rate based on LOSS and BAOSS surveys. To a depth of absolute magnitude of 15.5, and with a limiting magnitude of 20.5, the survey volume would be 1.5 107 Mpc3. Using the 2MASS K-band luminosity function of 5.1108L⊙Mpc-3 (Karachentsev & Kutkin 2005, Kochanek et al. 2001), we expect a rate of the faintest subluminous supernovae to be 370 all sky per year. The Palomar Transient Factory plans a 5-day cadence 2700 sq. deg. experiment which would give 24 faint SNe Ia per year.
References
- Adelman-McCarthy et al. (2007) Adelman-McCarthy, J. K. et al. 2007, ApJS, 172, 634.
- Alard & Lupton (1998) Alard, C. and Lupton, R. H. 1998, ApJ, 503, 325.
- Arbour (2007) Arbour, R. 2007, Central Bureau Electronic Telegrams, 904, 1.
- Arnett, Branch & Wheeler (1985) Arnett, W. D., Branch, D., and Wheeler, J. C. 1985, Nature, 314, 337.
- Benetti et al. (2005) Benetti, S., et al. 2005, ApJ, 623, 1011.
- Bildsten et al. (2007) Bildsten, L. et al. 2007, ApJ, 662, L95.
- Blondin et al. (2007) Blondin, S. et al. 2007, Central Bureau Electronic Telegrams, 907, 1.
- Brown et al. (2005) Brown, P. J., et al. (2005), ApJ, 635, 1192
- Cappellaro et al. (1997) Cappellaro, E., et al. 1997, A&A, 328, 203.
- Cenko et al. (2006) Cenko, S. B. et al. 2006, PASP, 118, 1396.
- Filippenko et al. (1992) Filippenko, A. V. et al. 1992, AJ, 104, 1543.
- Gal-Yam et al. (2007) Gal-Yam, A., et al. 2007, ApJ, in press, arXiv:0711.0808
- Gal-Yam et al. (2004) Gal-Yam, A., et al. 2004, ApJ, 609, L59
- Garnavich et al. (2004) Garnavich, P. M. et al. 2004, ApJ, 613, 1120.
- Hamuy et al. (1996) Hamuy, M. et al. 1996, AJ, 112, 2438.
- Hoeflich & Khokhlov (1996) Hoeflich, P. and Khokhlov, A. 1996, ApJ, 457, 500.
- Howell (2001) Howell, D. A. 2001, ApJ, 554, L193.
- Immler et al. (2006) Immler, S. et al. 2006, ApJ, 648, L119.
- Isern, Canal & Labay (1991) Isern, J., Canal, R., and Labay, J. 1991, ApJ, 372, L83.
- Karachentsev & Kutkin (2005) Karachentsev, I. D. and Kutkin, A. M. 2005, Astronomy Letters, 31, 299.
- Kochanek et al. (2001) Kochanek, C. S. et al. 2001, ApJ, 560, 566.
- Leibundgut et al. (1993) Leibundgut, B. et al. 1993, AJ, 105, 301.
- Li et al. (2001) Li, W. et al. 2001, ApJ, 546, 734.
- Livne (1990) Livne, E. 1990, ApJ, 354, L53.
- Mazzali et al. (2007) Mazzali, P. A. et al. 2007, Science, 315, 825.
- Mazzali et al. (1997) Mazzali, P. A., et al. 1997, MNRAS, 284, 151.
- Modjaz et al. (2001) Modjaz, M. et al. 2001, PASP, 113, 308.
- Morrell & Folatelli (2007) Morrell, N. and Folatelli, G. 2007, Central Bureau Electronic Telegrams, 908, 1.
- Nomoto & Iben (1985) Nomoto, K. and Iben, Jr., I. 1985, ApJ, 297, 531.
- Nugent et al. (1995) Nugent, P. et al. 1995, ApJ, 455, L147+.
- Oke & Gunn (1982) Oke, J. B. and Gunn, J. E. 1982, PASP, 94, 586.
- Peng et al. (2002) Peng, C. Y., Ho, L. C., Impey, C. D., and Rix, H.-W. 2002, AJ, 124, 266.
- Poole et al. (2007) Poole, T. S. et al. 2007, MNRAS, 1090.
- Pskovskii (1984) Pskovskii, Y. P. 1984, Soviet Astronomy, 28, 658.
- Scannapieco & Bildsten (2005) Scannapieco, E. and Bildsten, L. 2005, ApJ, 629, L85.
- Schlegel, Finkbeiner & Davis (1998) Schlegel, D. J., Finkbeiner, D. P., and Davis, M. 1998, ApJ, 500, 525.
- Taubenberger et al. (2007) Taubenberger, S. et al. 2007, ArXiv e-prints, 711.
- Turatto, Benetti & Cappellaro (2003) Turatto, M., Benetti, S., and Cappellaro, E. 2003, in From Twilight to Highlight: The Physics of Supernovae, ed. W. Hillebrandt and B. Leibundgut, 200.
- Woosley & Weaver (1994) Woosley, S. E. and Weaver, T. A. 1994, ApJ, 423, 371.
| UT | MJD | Facility | Band | Exp | Magnitude |
| 04-Apr-2007 | 54194.29 | Keck-NIRC2 | K’ | 600 s | mag |
| 29-Mar-2007 | 54188.147 | Palomar-60 | s | 15.65 0.06 mag | |
| 30-Mar-2007 | 54189.230 | Palomar-60 | s | 15.75 0.05 mag | |
| 30-Mar-2007 | 54189.331 | Palomar-60 | s | 15.60 0.02 mag | |
| 31-Mar-2007 | 54190.232 | Palomar-60 | s | 15.73 0.03 mag | |
| 31-Mar-2007 | 54190.329 | Palomar-60 | s | 15.59 0.03 mag | |
| 01-Apr-2007 | 54191.137 | Palomar-60 | s | 15.68 0.05 mag | |
| 01-Apr-2007 | 54191.234 | Palomar-60 | s | 15.69 0.03 mag | |
| 01-Apr-2007 | 54191.137 | Palomar-60 | s | 15.68 0.05 mag | |
| 02-Apr-2007 | 54192.233 | Palomar-60 | s | 15.36 0.04 mag | |
| 03-Apr-2007 | 54193.138 | Palomar-60 | s | 15.56 0.03 mag | |
| 03-Apr-2007 | 54193.231 | Palomar-60 | s | 15.59 0.22 mag | |
| 04-Apr-2007 | 54194.238 | Palomar-60 | s | 15.45 0.04 mag | |
| 05-Apr-2007 | 54195.223 | Palomar-60 | s | 15.43 0.03 mag | |
| 06-Apr-2007 | 54196.239 | Palomar-60 | s | 15.50 0.03 mag | |
| 07-Apr-2007 | 54197.307 | Palomar-60 | s | 15.94 0.06 mag | |
| 11-Apr-2007 | 54201.145 | Palomar-60 | s | 16.41 0.07 mag | |
| 14-Apr-2007 | 54204.146 | Palomar-60 | s | 16.69 0.03 mag | |
| 14-Apr-2007 | 54204.245 | Palomar-60 | s | 16.31 0.12 mag | |
| 18-Apr-2007 | 54208.165 | Palomar-60 | s | 17.09 0.04 mag | |
| 25-Apr-2007 | 54215.164 | Palomar-60 | s | 17.58 0.07 mag | |
| 28-Apr-2007 | 54218.157 | Palomar-60 | s | 17.62 0.05 mag | |
| 29-Apr-2007 | 54219.195 | Palomar-60 | s | 17.64 0.14 mag | |
| 30-Apr-2007 | 54220.154 | Palomar-60 | s | 17.74 0.09 mag | |
| 08-May-2007 | 54228.159 | Palomar-60 | s | 18.18 0.18 mag | |
| 29-Mar-2007 | 54188.127 | Palomar-60 | s | 16.27 0.09 mag | |
| 29-Mar-2007 | 54188.142 | Palomar-60 | s | 16.30 0.05 mag | |
| 30-Mar-2007 | 54189.128 | Palomar-60 | s | 16.37 0.04 mag | |
| 30-Mar-2007 | 54189.222 | Palomar-60 | s | 16.23 0.11 mag | |
| 30-Mar-2007 | 54189.323 | Palomar-60 | s | 16.20 0.14 mag | |
| 31-Mar-2007 | 54190.129 | Palomar-60 | s | 16.36 0.08 mag | |
| 31-Mar-2007 | 54190.225 | Palomar-60 | s | 16.37 0.12 mag | |
| 31-Mar-2007 | 54190.321 | Palomar-60 | s | 16.22 0.12 mag | |
| 01-Apr-2007 | 54191.130 | Palomar-60 | s | 16.45 0.11 mag | |
| 01-Apr-2007 | 54191.227 | Palomar-60 | s | 16.43 0.12 mag | |
| 01-Apr-2007 | 54191.130 | Palomar-60 | s | 16.30 0.13 mag | |
| 02-Apr-2007 | 54192.130 | Palomar-60 | s | 16.49 0.11 mag | |
| 02-Apr-2007 | 54192.226 | Palomar-60 | s | 16.39 0.12 mag | |
| 02-Apr-2007 | 54192.322 | Palomar-60 | s | 16.39 0.09 mag | |
| 03-Apr-2007 | 54193.224 | Palomar-60 | s | 16.45 0.11 mag | |
| 03-Apr-2007 | 54193.320 | Palomar-60 | s | 16.53 0.12 mag | |
| 04-Apr-2007 | 54194.132 | Palomar-60 | s | 16.59 0.09 mag | |
| 04-Apr-2007 | 54194.230 | Palomar-60 | s | 16.26 0.11 mag | |
| 05-Apr-2007 | 54195.216 | Palomar-60 | s | 16.47 0.09 mag | |
| 06-Apr-2007 | 54196.138 | Palomar-60 | s | 16.66 0.07 mag | |
| 06-Apr-2007 | 54196.231 | Palomar-60 | s | 17.06 0.12 mag | |
| 07-Apr-2007 | 54197.300 | Palomar-60 | s | 17.03 0.07 mag | |
| 11-Apr-2007 | 54201.138 | Palomar-60 | s | 17.62 0.14 mag | |
| 11-Apr-2007 | 54201.235 | Palomar-60 | s | 17.47 0.17 mag | |
| 14-Apr-2007 | 54204.139 | Palomar-60 | s | 17.80 0.13 mag | |
| 14-Apr-2007 | 54204.237 | Palomar-60 | s | 17.59 0.12 mag | |
| 17-Apr-2007 | 54207.159 | Palomar-60 | s | 18.11 0.19 mag | |
| 18-Apr-2007 | 54208.158 | Palomar-60 | s | 18.04 0.13 mag | |
| 18-Apr-2007 | 54208.275 | Palomar-60 | s | 17.98 0.15 mag | |
| 20-Apr-2007 | 54210.140 | Palomar-60 | s | 18.09 0.23 mag | |
| 22-Apr-2007 | 54212.267 | Palomar-60 | s | 18.20 0.23 mag | |
| 25-Apr-2007 | 54215.157 | Palomar-60 | s | 18.49 0.42 mag | |
| 26-Apr-2007 | 54216.155 | Palomar-60 | s | 18.61 0.34 mag | |
| 28-Apr-2007 | 54218.150 | Palomar-60 | s | 18.57 0.39 mag | |
| 29-Apr-2007 | 54219.188 | Palomar-60 | s | 18.42 0.22 mag | |
| 30-Apr-2007 | 54220.147 | Palomar-60 | s | 18.73 0.40 mag | |
| 09-May-2007 | 54229.159 | Palomar-60 | s | 18.71 0.10 mag | |
| 02-Apr-2007 | 54192.8 | Swift-UVOT | 419 s | 15.87 0.08 mag | |
| 04-Apr-2007 | 54195.0 | Swift-UVOT | 229 s | 16.10 0.09 mag | |
| 10-Apr-2007 | 54201.0 | Swift-UVOT | 227 s | 16.75 0.14 mag | |
| 17-Apr-2007 | 54207.2 | Swift-UVOT | 225 s | 17.42 0.23 mag | |
| 21-Apr-2007 | 54211.4 | Swift-UVOT | 516 s | 17.94 0.33 mag | |
| 29-Mar-2007 | 54189.0 | Swift-UVOT | 189 s | 16.96 0.05 mag | |
| 02-Apr-2007 | 54192.8 | Swift-UVOT | 419 s | 17.22 0.05 mag | |
| 04-Apr-2007 | 54195.0 | Swift-UVOT | 205 s | 18.02 0.11 mag | |
| 10-Apr-2007 | 54201.0 | Swift-UVOT | 202 s | 18.57 0.16 mag | |
| 17-Apr-2007 | 54207.2 | Swift-UVOT | 324 s | 18.62 0.14 mag | |
| 21-Apr-2007 | 54211.4 | Swift-UVOT | 679 s | 18.64 0.12 mag | |
| 30-Apr-2007 | 54220.2 | Swift-UVOT | 677 s | 19.70 0.29 mag | |
| 06-May-2007 | 54226.3 | Swift-UVOT | 134 s | 19.15 0.30 mag | |
| 11-May-2007 | 54231.9 | Swift-UVOT | 723 s | mag | |
| 02-Apr-2007 | 54192.8 | Swift-UVOT | 419 s | 17.82 0.08 mag | |
| 04-Apr-2007 | 54194.0 | Swift-UVOT | 229 s | 18.26 0.13 mag | |
| 10-Apr-2007 | 54201.0 | Swift-UVOT | 227 s | 18.94 0.22 mag | |
| 17-Apr-2007 | 54207.2 | Swift-UVOT | 648 s | 18.86 0.14 mag | |
| 29-Mar-2007 | 54188.9 | Swift-UVOT | 432 s | 20.02aaaThe significance of this detection is 2.5 0.47 mag | |
| 02-Apr-2007 | 54192.8 | Swift-UVOT | 844 s | 20.07 0.40 mag | |
| 04-Apr-2007 | 54195.2 | Swift-UVOT | 1669 s | mag | |
| 10-Apr-2007 | 54201.2 | Swift-UVOT | 1369 s | mag | |
| 17-Apr-2007 | 54207.2 | Swift-UVOT | 1620 s | mag | |
| 21-Apr-2007 | 54211.4 | Swift-UVOT | 3400 s | 20.51 0.40 mag | |
| 30-Apr-2007 | 54220.7 | Swift-UVOT | 3390 s | 20.86bbbThe significance of this detection is 2.3 0.50 mag | |
| 06-May-2007 | 54226.7 | Swift-UVOT | 6681 s | mag | |
| 11-May-2007 | 54232.4 | Swift-UVOT | 3615 s | mag | |
| 18-Apr-2007 | 54208.6 | Super-LOTIS | 13 60 s | 17.01 0.02 mag | |
| 19-Apr-2007 | 54209.6 | Super-LOTIS | 10 60 s | 17.22 0.02 mag | |
| 20-Apr-2007 | 54210.6 | Super-LOTIS | 9 60 s | 17.18 0.02 mag | |
| 27-Apr-2007 | 54217.6 | Super-LOTIS | 6 60 s | 17.59 0.04 mag | |
| 04-May-2007 | 54224.6 | Super-LOTIS | 18 60 s | 18.00 0.05 mag | |
| 11-May-2007 | 54231.6 | Super-LOTIS | 16 60 s | 18.35 0.10 mag | |
| 26-May-2007 | 54246.6 | Super-LOTIS | 18 60 s | 18.90 0.29 mag | |
| 29-May-2007 | 54249.6 | Super-LOTIS | 22 60 s | 19.05 0.18 mag | |
| 30-May-2007 | 54250.6 | Super-LOTIS | 14 60 s | 19.15 0.10 mag | |
| 18-Apr-2007 | 54208.6 | Super-LOTIS | 12 60 s | 16.79 0.23 mag | |
| 19-Apr-2007 | 54209.6 | Super-LOTIS | 12 60 s | 16.97 0.22 mag | |
| 20-Apr-2007 | 54210.6 | Super-LOTIS | 14 60 s | 17.10 0.20 mag | |
| 23-Apr-2007 | 54213.6 | Super-LOTIS | 15 60 s | 17.24 0.22 mag | |
| 26-Apr-2007 | 54216.6 | Super-LOTIS | 47 60 s | 17.32 0.29 mag | |
| 27-Apr-2007 | 54217.6 | Super-LOTIS | 12 60 s | 17.47 0.29 mag | |
| 04-May-2007 | 54224.6 | Super-LOTIS | 10 60 s | 17.72 0.38 mag | |
| 11-May-2007 | 54231.6 | Super-LOTIS | 16 60 s | 17.96 0.46 mag | |
| 26-May-2007 | 54246.6 | Super-LOTIS | 17 60 s | 18.11 0.40 mag | |
| 27-May-2007 | 54247.6 | Super-LOTIS | 11 60 s | 18.55 0.37 mag | |
| 31-May-2007 | 54251.6 | Super-LOTIS | 11 60 s | 18.16 0.46 mag | |
| 05-Jun-2007 | 54256.6 | Super-LOTIS | 20 60 s | 18.20 0.54 mag | |
| 18-Apr-2007 | 54208.6 | Super-LOTIS | 9 60 s | 17.84 0.15 mag | |
| 19-Apr-2007 | 54209.6 | Super-LOTIS | 6 60 s | 17.80 0.15 mag | |
| 20-Apr-2007 | 54210.6 | Super-LOTIS | 8 60 s | 17.80 0.15 mag | |
| 27-Apr-2007 | 54217.6 | Super-LOTIS | 16 60 s | 18.30 0.15 mag | |
| 04-May-2007 | 54224.6 | Super-LOTIS | 9 60 s | 18.94 0.15 mag | |
| 11-May-2007 | 54231.6 | Super-LOTIS | 17 60 s | 18.87 0.15 mag | |
| 27-May-2007 | 54247.6 | Super-LOTIS | 18 60 s | 19.55 0.23 mag | |
| 29-May-2007 | 54249.6 | Super-LOTIS | 22 60 s | 19.27 0.16 mag | |
| 27-May-2007 | 54247.6 | Bok-2.3m | 4 180 s | 20.53 0.04 mag |