Tuning the interlayer spacing in high superconductors: penetration depth and two-dimensional superfluid density
Abstract
Substantial control of the interlayer spacing in Bi-based high temperature superconductors has been achieved through the intercalation of guest molecules between the superconducting layers. Measurements using implanted muons reveal that the penetration depth increases with increasing layer separation while does not vary appreciably, demonstrating that the bulk superfluid density is not the determining factor controlling . Our results strongly suggest that the superfluid density appearing in the Uemura scaling relation should be interpreted as the two dimensional density within the superconducting layers, which we find to be constant for each class of system investigated.
pacs:
74.72.Hs, 74.62.Bf, 76.75.+i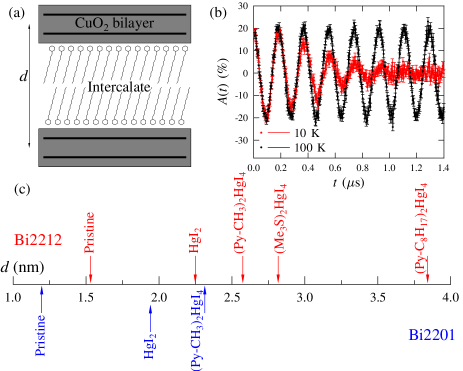
A fundamental property of high temperature superconductors (HTSs) is the presence of CuO2 planes with some degree of weak coupling between them leggett . The nature of this interlayer coupling history has been fiercely debated in the past and recent advances in elucidating the Fermi surface topology of the cuprates fs1 ; fs2 ; fs3 make an understanding of the effective dimensionality of the the HTSs a priority. In order to address the question of dimensionality experimentally we have modulated the interlayer coupling of the CuO2 planes in two HTS systems by intercalating molecular groups between the layers. This allows us to approach the two dimensional (2D) limit without perturbing the superconducting oxide block. Here we present the results of a muon spin rotation (SR) investigation of the evolution of the penetration depth (and hence ) with layer separation. We are able to demonstrate that the bulk superfluid density is not the parameter controlling and that the superfluid density appearing in the Uemura relation should be interpreted as the superfluid density within the 2D superconducting layers, which is independent of the layer separation.
The bismuth based cuprates possess weakly bound Bi2O2 double layers that allow the intercalation of guest molecules without any substantial change in the superconducting block choy94 ; choy98 ; kwon ; kwon2 ; kwon3 ; kwon4 . Weak interaction between the guest molecule and host layers ensures that the intercalation process does not distort the superconducting layers. This overcomes a substantial difficulty with alternative attempts to control the interlayer spacing fischer , which involve the sequential deposition of superconducting and insulating layers. Moreover, the intercalation of long chain organic molecules (shown schematically in Fig. 1(a)) choy98 ; kwon allows the possibility of tuning the layer (or bilayer) separation on a scale fixed by the length of the hydrocarbon chain. Organic guest species electrically isolate the layers since hydrocarbons are, in general, very good insulators. In this paper we examine intercalation series based on two classes of Bi-based superconductors, namely bilayer Bi2Sr1.5Ca1.5Cu2O8+δ (Bi2212) and single layer Bi2Sr1.6La0.4CuO6+ϵ (Bi2201). Previous work on these classes choy94 ; choy98 ; kwon ; kwon2 ; kwon3 ; kwon4 has suggested that while the intercalation of guest species allows to be varied by a factor of three, the transition temperature of the intercalated materials does not vary appreciably compared to the pristine compound.
Transverse field muon spin rotation (TF SR) provides a means of accurately measuring the internal magnetic field distribution caused by the vortex lattice (VL) in a type II superconductor sonier . The vortex state of the pristine polycrystalline Bi2212 and Bi2201 systems have been studied with SR previously weber ; russo ; zimmermann . In a TF SR experiment spin polarized muons are implanted in the bulk of a superconductor, in the presence of a magnetic field , which is applied perpendicular to the initial muon spin direction. The muons stop at random positions on the length scale of the VL where they precess about the total local magnetic field at the muon site (mainly due to the VL), with frequency , where is the muon gyromagnetic ratio ( MHz T-1). The observed property of the experiment is the time evolution of the muon spin polarization , which allows the determination of the distribution of local magnetic fields across the sample volume , via
| (1) |
where is a phase offset associated with a particular detector geometry.
Powder samples of several intercalates of Bi2212 and Bi2201 were prepared as reported previously choy94 ; choy98 ; kwon ; kwon2 . The intercalates studied and the separation of CuO2 layers (or bilayers) achieved are given in Fig. 1(c) and Table 1. SR measurements were made at the ISIS Facility using the MuSR spectrometer and the SS facility using the GPS spectrometer. Samples were pressed into pellets and mounted on a hematite backing plate to reduce the background signal.
| Intercalant | (nm) | (K) | (mT) | (mT) | (nm) | (nm) | ( m-1) | |
|---|---|---|---|---|---|---|---|---|
| Bi2212 | ||||||||
| none | 1.53 | 82.4(2) | 4.6(6) | 1.52(5) | 0.07(2) | 200(6) | 6(1) | 3.8(2) |
| HgI20.5 | 2.25 | 80.6(1) | 5.7(4) | 1.30(3) | 0.09(1) | 230(10) | – | 4.3(4) |
| (Py-CH3)2HgI40.35 | 2.61 | 79.0(1) | 2.6(1) | 1.04(1) | 0.11(1) | 271(7) | 3(1) | 3.6(2) |
| (Me3S)2HgI40.34 | 2.79 | 88(3) | 2.1(3) | 0.90(6) | 0.07(1) | 270(8) | – | 3.8(2) |
| (Py-C8H17)2HgI40.35 | 3.82 | – | – | – | – | – | – | – |
| Bi2201 | ||||||||
| none | 1.21 | 22.1(2) | 3.0(2) | 0.98(3) | 0.006(3) | 290(8) | 13(3) | 1.44(8) |
| (HgI2)0.5 | 1.92 | 22.3(5) | 2.1(3) | 0.63(5) | 0.05(3) | 370(10) | 10(2) | 1.40(8) |
| (Py-CH3)2HgI40.35 | 2.30 | – | – | – | – | – | – | – |
Fig. 1(b) shows example TF SR spectra measured above and below for pristine Bi2212 in an applied field of 40 mT. Above some slight broadening of the spectrum is attributable to dephasing of the muon spins caused by randomly directed nuclear moments near the muon stopping sites. Below the spectrum broadens considerably due to the dephasing contribution from the VL. The expected width of the field distribution in the powder sample was estimated using the numerical results reported for the field width in the Ginzburg-Landau (GL) model that were obtained for a field normal to the layers brandt . A polycrystalline average was taken under the assumption that the length scales and diverge following as the field orientation approaches the plane at (high anisotropy limit), with the corresponding contribution to the overall width scaling as . Fitting our data with these results allowed us to extract the second moment of the distribution, , at each measured field and temperature, and relate it to the vortex properties and penetration depth of the material.
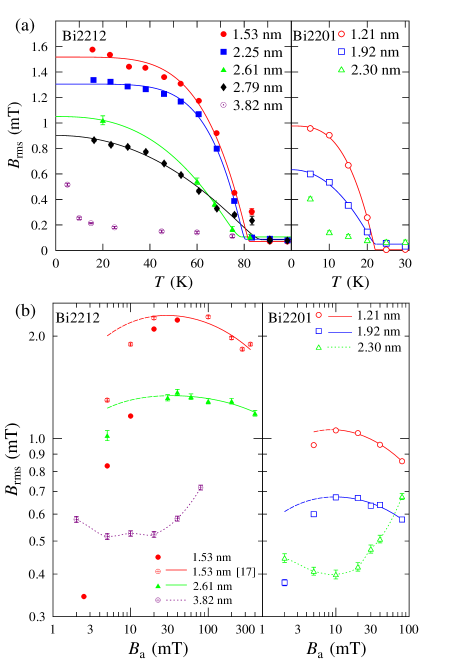
Fig. 2(a) shows the temperature dependence of in an applied field of 5 mT for each intercalate studied. For both series, the magnitude of falls continuously with increasing temperature to a low constant value for . The exceptions are the materials with the largest layer separation in each series (discussed below). Fits are shown to an empirical power law functional form zimmermann
| (2) |
where is the zero temperature contribution from the VL and represents a background contribution from the dipole fields from nearby nuclei. The parameters derived from these fits are given in table 1. There is little variation in while decreases smoothly with increasing layer spacing. The curvature parameter falls within the range , which is a slightly larger range than that previously observed when this approach was applied to YBa2Cu3Ox (YBCO) zimmermann . The background contribution is within the range found for pristine materials zimmermann ; weber , confirming that the intercalant is not introducing significant broadening.
The magnetic field dependence of note1 measured at low temperature for each series is shown in Fig. 2(b). The general trend is for to increase sharply with increasing field before describing a broad peak and decreasing for high fields. Again the exceptions to the general behavior occur for the largest layer separation .
To extract the penetration depth from our measurements we compare the field dependence of with the behaviour expected for the GL model (Fig. 2(b)) brandt . The model describes the data well for fields around the peak value of and above, but provides a poor description of the data at low fields (probably due to the anisotropic magnetization and the distribution of demagnetizing factors in the differently aligned crystallites). We note that the dependence of the theoretical line width becomes very weak near the peak, making an accurate assignment of unimportant in our discussion of . Indeed, close to the expected peak in , for (as is the case for our systems), the GL model predicts the well known result brandt ; sonier . (Here, the penetration depth should be interpreted as the effective penetration depth which includes contributions from supercurrents both parallel and perpendicular to the layers.) The values of and derived from our data are given in Table 1note2 . As above, we were not able to model the samples with the largest for each class of material.
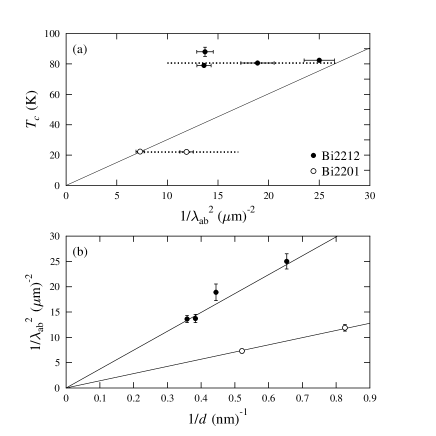
The general trend revealed by our measurements is a clear increase in with increasing layer separation . In the clean limit, we expect , where is the bulk superfluid density; thus decreases with increasing , but crucially remains almost unchanged. This strongly suggests that the bulk superfluid density is not the determining factor controlling in these systems. We note that our results differ from those involving varying the thickness of a PrBa2Cu3O7 (PBCO) layer in PBCO/YBCO superlattices, where it was found that uemura97 ; fischer . We stress, however, that chemical intercalation should be expected to produce better isolated layers than those found in superlattice systems (see above).
The behaviour we observe contrasts with that expected from a simple application of the Uemura scaling relation uemura1 which holds for many underdoped superconductors (Fig 3(a)). This scaling relation is, however, often interpreted as suggesting the strong two dimensionality of the superfluid in underdoped cuprate superconductors uemura2 . We might, therefore, expect that for the intercalated systems , where is the superfluid density in the superconducting layers. If we assume that the superfluid density in each CuO2 layer is the same for each class of material (i.e. a constant for Bi2212 and a different constant for Bi2201), then we should expect that . We see from Table 1 and Fig. 3(b) that our data are quite well described by this assumption: is approximately constant for each class of materials, as is . This strongly suggests that the superfluid density appearing in the Uemura relation should be interpreted as the 2D density in the superconducting planes.
Some insight into the meaning of our results may be obtained if we assume that underdoping destroys superconductivity at a quantum critical point (QCP) in these systems. Near a QCP kopp ; hetel an energy scale such as should vary as , where is the difference in doping from the QCP, is the dynamic exponent and the the correlation length exponent. Combining this with the prediction of Josephson scaling near a QCP, , we have . For this predicts Uemura scaling kopp . Our findings may therefore be suggestive of the influence of 2D quantum fluctuations in the underdoped regime.
Finally we note that VL breakup effects explain the anomalous behavior of the samples with the largest layer separation (see Fig. 2). A sharp drop in , similar to that observed in our Bi2212 ( nm) and Bi2201 ( nm) samples, has previously been observed in pristine Bi2212 lee97 , where it was attributed to VL melting at small superfluid densities close to . Both electromagnetic and Josephson coupling are expected to stabilize the VL in these materials blat ; lee97 . The temperature at which thermal fluctuations break up a VL stabilized solely by electromagnetic coupling is given by clem91 (where is the average CuO2 layer separation), which is constant for each series as . We can therefore estimate K for Bi2212 and K for Bi2201, both in reasonable agreement with the temperatures at which we observe a sharp drop in in the samples with the largest layer spacing. This suggests that the Josephson coupling, which decreases strongly with increasing layer spacing, stabilizes the VL to higher temperature in the samples with smaller layer spacing but is too weak to do so in the two samples with the largest . This leaves only electromagnetic coupling and the observed VL breakup for .
Part of this work was carried out at the SS, Paul Scherrer Institut, CH and at the ISIS facility, Rutherford Appleton Laboratory, UK. We thank E.H. Brandt for access to the results of his calculations for the GL model. We are grateful to Alex Amato for technical assistance and Ted Forgan for useful discussions. This work is supported by the EPSRC (UK) and by the European Commission under the Sixth Framework Programme through the Key Action: Strengthening the European Research Area, Research Infrastructures, Contract No. RII3-CT-2003-505925. T.L. acknowledges support from the Royal Commission for the Exhibition of 1851. S. J. Kwon is very grateful for the support by the Korea-UK Scientific Networking Program (M6-0405-00-0001).
References
- (1) A.J. Leggett, Nature Phys. 2, 134 (2006).
- (2) J.M. Wheatley, T.C. Hsu and P.W. Anderson, Science 333, 121 (1988); S. Doniach and W.E. Lawrence, Proc 12th Int. Conf. Low Temp. Phys. (ed E. Kanda) 361 (Keigaku, Tokyo, 1971).
- (3) N.E. Hussey et al., Nature 425, 814 (2003).
- (4) N. Doiron-Leyraud et al., Nature 447, 565 (2007).
- (5) N. Harrison, R.D. McDonald and J. Singleton, Phys. Rev. Lett. 99, 206406 (2007).
- (6) J.-H. Choy et al., J. Am. Chem. Soc. 116, 11564 (1994).
- (7) J.-H. Choy, S.J. Kwon and K.S. Park, Science, 280, 1589 (1998).
- (8) S.-J. Kwon and D.Y. Jung, Solid State Commn. 130, 287 (2004).
- (9) S.-J. Kwon et al., Phys. Rev. B 66, 224510 (2002).
- (10) S.-J. Kwon and J.-H. Choy, Inor. Chem. 42, 8134 (2003).
- (11) S.-J. Kwon et al., Supercond. Sci. Technol. 18, 470 (2005).
- (12) Ø. Fischer et al., Physica B 169, 116 (1991).
- (13) J.E. Sonier, J.H. Brewer and R.F. Kiefl, Rev. Mod. Phys. 72, 769 (2000).
- (14) M. Weber et al., Phys. Rev. B 48, 13022 (1993).
- (15) P.L. Russo et al., Phys. Rev. B 75, 054511 (2007).
- (16) P. Zimmermann et al., Phys. Rev. B 52, 541 (1995).
- (17) E.H. Brandt, Phys. Rev. B 68, 054506 (2003).
- (18) For the nm and 2.79 nm materials, which were measured at ISIS, the resolution limit that results from the ISIS pulse width prevents data being measured at fields mT.
- (19) For intercalated Bi2212 with nm and 2.79 nm we may estimate from the points near the largest measured . This is reasonable since these materials have layer separations between the extreme values of for our samples, so we would expect to be able to interpolate their behaviour.
- (20) Y.J. Uemura, Physica C 282-287, 194 (1997).
- (21) Y.J. Uemura et al., Phys. Rev. Lett. 62, 2317 (1989).
- (22) Y.J. Uemura et al., Phys. Rev. Lett. 66, 2665 (1991).
- (23) A. Kopp and S. Chakravarty, Nature Phys. 1, 54 (2005).
- (24) I. Hetel, T.R. Lemberger and M. Randeria, Nature Phys. 3, 700 (2007).
- (25) S.L. Lee et al., Phys. Rev. Lett. 71, 3862 (1993).
- (26) G. Blatter et al, Phys. Rev. B 54, 72 (1996).
- (27) S.L. Lee et al., Phys. Rev B, 55, 5666 (1997).
- (28) J.R. Clem, Phys. Rev. B 43, 7837 (1991).