Gamma Ray Burst Predictions for the Fermi Gamma Ray Space Telescope
Abstract
Results of a phenomenological model to estimate the GRB detection rate by the Fermi Gamma ray Space Telescope are reported. This estimate is based on the BATSE 4B GRB fluence distribution, the mean ratio of fluences measured at MeV – 5 GeV with EGRET and at keV – 2 MeV with BATSE, and the mean EGRET GRB spectrum for the 5 EGRET spark-chamber GRBs. For a 10% fluence ratio and a number spectral index at 100 MeV – 5 GeV energies, we estimate a rate of and 4 GRBs per yr in the Fermi Large Area Telescope field of view with at least 5 photons with energy MeV and GeV, respectively. We also estimate GRBs per yr in the Fermi FoV where at least 1 photon with energy GeV is detected. For these parameters, we estimate – 2 GRBs per year detected with the Fermi telescope with more than 100 rays with MeV. Comparison predictions for , different fluence ratios, and the AGILE -ray satellite are made. Searches for different classes of GRBs using a diagram plotting MeV – 10 GeV fluence vs. 20 keV – 20 MeV fluence is considered as a way to search for separate classes of GRBs and, specifically, spectral differences between the short-hard and long duration GRB classes, and for hard components in GRBs.
Subject headings:
gamma-rays: bursts—theory1. Introduction
The Gamma ray Large Area Space Telescope, GLAST, was launched on 11 June 2008 and renamed the Fermi Gamma ray Space Telescope (hereafter Fermi) on August 26, 2008. Fermi comprises two separate instruments, the Large Area Telescope (LAT), which is sensitive to rays in the energy range from MeV to 300 GeV, and the Fermi GLAST Burst Monitor (GBM), sensitive at 10 keV 30 MeV. At GeV energies, the Fermi LAT provides an increase in effective area over the Energetic Gamma Ray Experiment Telescope (EGRET) on the Compton Gamma Ray Observatory (CGRO) by almost an order of magnitude, a smaller point spread function, a field-of-view (FOV) larger by a factor than EGRET, and the capability to autonomously slew the LAT in response to a trigger from the GBM. The GBM uses NaI scintillators for triggering, like the Burst and Transient Source Experiment (BATSE), in addition to BGO (Bismuth Germanate) detectors for response in the MeV – 25 MeV energy range. The GBM views the unocculted sky, % of the full sky, and the predicted long-duration GBM burst detection rate is - 225 per year when triggering using standard BATSE detection criteria ( in at least two detectors in 1.024 s in the 50 - 300 keV; Kippen et al., 2001). This can be compared with the BATSE detection rate of GRBs full-sky brighter than cm-2 s-1 in the 50 – 300 keV band (Band, 2002).
Five EGRET -ray transients, coincident in time and direction with a BATSE GRB, were detected with the EGRET spark chamber at MeV with photon counts in excess of background (Dingus, 1995). Knowledge from the CGRO can be used to quantify expectations for Fermi. To simulate GRBs in the Fermi energy band, we calculate the average fluence ratio between EGRET (100 MeV – 5 GeV) and BATSE ( keV – MeV) from the 5 BATSE GRBs that were detected with the EGRET spark chamber. Using an average spectrum consisting of an empirical Band et al. (1993) spectrum plus a power law, and the effective area of the Fermi LAT, we estimate the full-sky number of GRBs per year with different numbers of high-energy photons based on the BATSE 4B fluence distribution for long-duration GRBs (Paciesas et al., 1999). We make predictions for both long-duration and total GRBs; only the former class of GRBs were convincingly detected at 100 MeV – 5 GeV energies with CGRO. Both Fermi and AGILE view of the full sky at 100 MeV – 5 GeV energies, with the field-of-view defined by the solid angle where the effective area is one-half the on-axis effective area. Thus we consider the realistic detection rate to be the full-sky rate, without considering the potential effects of autonomous repointings in the estimates.
In § 2 we discuss the phenomenological model for GRBs based on BATSE and EGRET data, and estimate the uncertainty in GRB properties derived from EGRET and Fermi measurements. The predicted GRB detection rates and GRB contribution to the diffuse extragalactic background radiation are calculated in § 3. We note that these predictions were made in advance of the launch of Fermi (see arXiv:0807.0355 v1), so can be used to test our knowledge of GRB physics, in particular, whether additional hard, high-energy ( MeV) -ray spectral components are present in GRBs.
2. Model
We develop a phenomenological model of GRBs based on the properties of EGRET spark-chamber GRBs, all detected with BATSE, and then make predictions for the GRB detection rate with Fermi and AGILE. Based on BATSE and EGRET results, and from earlier GRB studies, the time-integrated (and resolved, where possible) GRB photon number spectrum is assumed to be well-described by the sum of the Band function (Band et al., 1993), , and a high-energy power law component, . We write this function using dimensionless notation as
| (1) |
where takes the form
| (2) | |||||
The parameters and are the low- and high-energy Band and Band indices, and keV is the “break energy.” The photon energy of the peak of the spectrum is related to through the expression
| (3) |
provided and . The Heaviside function is defined such that except at , where . The term is the constant normalizing the number fluence to the keV BATSE energy fluence of a particular GRB, and is given by , where
| (4) | |||||
For model GRBs normalized to the BATSE fluence, we take the minimum energy keV, and maximum energy GeV. For the mean GRB spectral indices, we take , , and break energy keV, corresponding to the mean for these values from spectral analyses of bright BATSE GRBs (Preece et al., 2000).
For the high-energy spectral component, we assume that GRBs can be described by a power law at -ray energies written as
| (5) |
The average spectrum of GRBs measured by the EGRET spark chamber is for 45 rays detected within 200 seconds of the trigger (Dingus, 1995; Dingus et al., 1998), similar to the average EGRET Total Absorption Shower Counter (TASC) index (Catelli et al., 1998). Band values for BATSE GRBs have a large range, with most GRBs showing , but lie in a different range than EGRET and Fermi emissions. The mean spectral index measured by EGRET for the five spark-chamber GRBs is not in good agreement with the index of BATSE and TASC GRBs at MeV (Preece et al., 2000). This suggests that the spectrum is probably not a simple power law at high energies, but different spectral shapes should be considered (e.g., cut-offs or extra components; see Kaneko et al., 2008), and unusual spectral evolution of high-energy components (González et al., 2003).
Since the spectral index distribution of GRBs at medium -ray energies is still debatable, which Fermi will clarify, in this paper we make predictions assuming that the MeV -ray spectrum can be described by a simple power law with . For definiteness, we consider and . The latter value corresponds to the softest spectrum within 1 of the EGRET measurements, and is the same as the Band used, effectively giving a single power law without break. Besides spectral index, our predictions are also strongly affected by EGRET uncertainties, which we will discuss in the next section.
The term
| (6) |
where
| (7) |
is the normalization constant based on the average fluence ratio between EGRET and BATSE. In our model, the uncertainties in the number of rays that were detected by EGRET and the measured BATSE and EGRET fluences are absorbed into this factor . Here and are the minimum and maximum energy at 100 MeV and 5 GeV, respectively; note that even though EGRET detected photons down to 30 MeV energies, the effective area dropped rapidly below MeV. The higher energy given by is set by the energy where self-vetoing in EGRET reduces its effective area (see Fig. 1).

The number of source counts with energy for different detectors (Dermer & Dingus, 2004) is given by
| (8) |
where is the on-axis effective area of different detectors (e.g., EGRET, Fermi LAT, and AGILE) and is a collection function depending on the opening angle of the detector. Here we conservatively take the opening angle as energy-dependent with containment (Thompson, 1986; Dermer & Dingus, 2004) though a larger region of interest (ROI) will not much change the results for bright GRBs with many rays. The on-axis effective areas for EGRET (), Fermi LAT (), and AGILE () are taken from the best fit to the calibration and analysis data (Pittori et al., 2004; Belli et al., 2007, and references therein) as shown in Fig. 1. The functions describing these areas are
| (9) | |||||
where , and parameters are given in Table 1. Most GRBs would take place at relatively large angles, – 60∘, from the Fermi axis, where the effective area is half this value. On the other hand, a larger ROI would include more counts. These represent two additional uncertainties in the rate estimates.
The on-axis effective area of Fermi is shown in Fig. 1. Signal analysis of photon events in the Fermi LAT depends on event reconstruction and background rejection (Atwood et al., 2009). The diffuse class of events, for instance, minimizes background by rejecting tracks without good energy measurement in the calorimeter and requires both tracker and calibration information. GRBs can, however, be studied with the transient event class, which increases low-energy response at the expense of greater background using large regions of interest around the GRB direction. We consider only photons with MeV, where the point spread function and consequently the background is smaller than for photons at lower energies, limited at higher energies to a maximum of 5 GeV. Over this energy range, both the EGRET and Fermi effective area is relatively flat, and measurement uncertainty can be more reliably estimated.
| EGRET GRB rays | spectral index of | spectral index of | |||||||||
|---|---|---|---|---|---|---|---|---|---|---|---|
| 910503 | 24 | 9g | 2 | 10 | |||||||
| 910601 | 12 | 8 | 3 | 0.31 | |||||||
| 930131 | 28 | 18 | 12 | 1.2 | |||||||
| 940217 | 10 | 28 | 10 | 18 | |||||||
| 940301 | 6 | 7 | 5 | 0.16 | |||||||
Note. — aAngle from axis in degrees
bNumber of rays imaged by EGRET spark chamber
cNumber of rays imaged by EGRET spark
chamber between 100 MeV and 5 GeV
dBATSE 20 keV – 2 MeV fluence, units of
erg cm-2, from Meegan et al. (1996)
eEGRET 100 MeV – 5 GeV fluence, units of erg cm-2
gNine events within 15 s after GRB trigger
(Schneid et
al., 1992)
3. Fluence Estimates and Uncertainties for EGRET GRBs
In Table 2, we list the pertinent data from EGRET to make estimates of Fermi detection rates. The first five columns of Table 2 give the GRB date-name, the angle of the GRB with respect to the z-axis of the EGRET telescope, the total number and the number of rays with energies between 100 MeV and 5 GeV imaged by the EGRET spark chamber, and the maximum -ray energy associated with the GRB. With this data, we can calculate the 100 MeV – 5 GeV fluence from an EGRET spark chamber GRB using the expression
| (10) |
with the sum being over the rays with energies from 100 MeV to 5 GeV detected by the EGRET spark chamber and associated with the GRB, located at the angle with respect to the pointing axis of the EGRET.
By choosing a specific energy window between 100 MeV and 5 GeV, we can minimize uncertainty in the GRB fluence estimate. This is where the EGRET response is best understood, as compared to the higher energy regime with uncertain systematics (Stecker et al., 2008), or at lower energies where the point spread function increases and the numbers of background photons are larger. Because the background photons are more likely to be at low energies, for example, due to difficulties in event reconstruction, the number of background photons, quoted below from the analysis of each specific EGRET GRB, is an upper limit to the number of background photons in the 100 MeV – 5 GeV range.
3.1. Fluence Error Estimate for EGRET Spark Chamber GRBs
Several errors come into the estimate of the 100 MeV – 5 GeV burst fluence, including (i) the statistical error due to the finite number of detected photons; (ii) deadtime effects in the EGRET detector; and (iii) background spark-chamber events erroneously associated with the GRB. Other effects may also play a role, including (iv) errors in energy resolution ( % and 9% -ray photon energy resolution errors at 100 MeV and 1 GeV, respectively), and (v) errors in effective area. For the EGRET effective area, we use the angle-dependent EGRET effective area with the TASC in coincidence (Fig. 14 of Thompson et al., 1993), where the effective area for the associate burst (See Table 2) is obtained by interpolating the data in Figure 14.
For GRB 910503, 9 photons are detected within 15 s of the GRB trigger, and 6 are likely to be associated with this GRB, implying a possible background of 3 events (Schneid et al., 1992). A 10 GeV ray was also detected 84 s after this GRB (Merck et al., 1995) coincident with its location. Six of the rays were detected within 2 seconds, allowing as much as a factor of % error for 0.1 s EGRET deadtime if high-energy rays are produced roughly uniformly over this time interval. If such emission is produced in bursts shorter than the s deadtime, then the GRB produced a stronger fluence then measured. For GRB 910601 (Kwok et al., 1993), 4 events were detected within 100 s of the GRB trigger, with 3 events greater MeV rays, when only 1.5 events were expected. This represents a significant uncertainty on the fluence due to background. In contrast, deadtime effects are unlikely to be important for GRB910601 assuming, as we do henceforth, that -rays are not produced in sub-100 ms bursts.
GRB 930131, the so-called “superbowl burst,” is interesting in that it shows an intense s peak characteristic of a short hard GRB (Sommer et al., 1994), followed s later by a weaker s pulse, and also displays extended emission detected with BATE for 50 s after the GRB trigger (Kouveliotou et al., 1994). Although its (50 – 300 keV) s, its (50 – 300 keV) s (Paciesas et al., 1999), so it is near the boundary between the long soft and short hard GRBs (Kouveliotou et al., 1993). Note that short hard GRBs are often observed with Swift to produce extended emission (Norris & Gehrels, 2008). Sixteen rays are imaged within 25 s of the BATSE trigger, of which two pairs and a cluster of three arrive on a sufficiently short, s timescale that deadtime effects could have reduced the detected number of photons. Based on background observed before the trigger time of the GRB, only 0.04 events are expected by chance within 25 s (Sommer et al., 1994), so background should not be important for this GRB. This GRB was very intense at BATSE energies, but because most of this emission appeared in a first very short, very intense pulse, the BATSE 20 keV – 2 MeV fluence is smallest of the 5 spark-chamber GRBs.
GRB 940217 (Hurley et al., 1994), with spark-chamber emission extending to min after the GRB trigger, has associated with it the highest energy photon of all EGRET GRBs, GeV. A total of 28 -ray photons were imaged by the EGRET spark chamber from this GRB, with 10, 8, and 10 appearing during the s episode of strong BATSE emission, after the BATSE emission and before Earth occultation occurring at s after the GRB trigger, and after the GRB appears from Earth occultation at to 5400 s after the GRB. For these three periods, respectively, 0.39, 1.8, and 2.9 background rays are expected. Because the GRB was so extended in time and the rays arrive one or more seconds apart, deadtime effects can be considered to be small for this GRB. The duration of Earth occultation, representing % of the known period of activity of GRB 940217, therefore represents a major uncertainty in the fluence measurement of this GRB.
Seven photons were imaged within 21 s of the GRB 940301 BATSE trigger (Schneid et al., 1995), though appearing sparsely distributed in time so that deadtime effects are probably negligible. Background is also likely to be small for this GRB, as no other rays are detected over a period of 150 s around the time of the GRB except for the 7 photons mentioned.
For completeness, two other GRBs from the CGRO era should be mentioned. This includes GRB 910814, with rays observed up to MeV with the TASC (when the spark chamber was disabled due to Earth occultation; in any case this event was at 38.7∘ from the EGRET boresight; Kwok et al., 1993). The keV fluence of GRB 910814 was ergs cm-2 (Meegan et al., 1996). Late in the CGRO mission, when the EGRET spark chamber gas was mostly depleted, GRB 990123 was observed with COMPTEL to MeV. This was a bright GRB, with a keV fluence ergs cm-2 (Briggs et al., 1999). At redshift (Kulkarni et al., 1999), it provided the first confident lower limits on bulk Lorentz factor using internal opacity arguments (Baring, 2006). Joint analysis of BATSE and EGRET-TASC GRBs indicates excess, MeV emission, though not necessarily extending to MeV, in bright, long duration GRBs (González et al., 2009). The keV fluence of the most notable of these bursts, GRB 941017, was ergs cm-2.
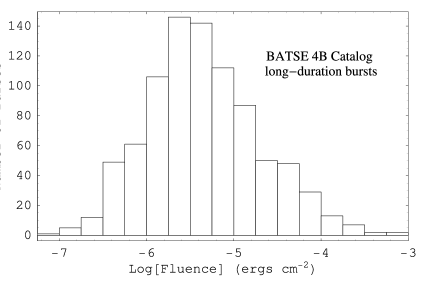
Comparison of the distribution of the fluences of GRBs shown in Fig. 2 in the BATSE 4B catalog with the fluences of the EGRET spark chamber GRBs in Table 2, and notable BATSE-TASC GRBs in the preceding paragraph, shows that the high-energy emission is, for the long duration GRBs, always associated with the most fluent GRBs. This is characteristic of a sensitivity limited detection of high-energy -ray emission. Consequently, we can use the increased capabilities of the Fermi telescope with respect to EGRET to make straightforward predictions by scaling from the EGRET results. Note that the weakest GRB in Table 2 in terms of fluence—GRB 930131—is also possibly a short, hard GRB.
3.2. Error from Finite Photon Number
We consider a major error on fluence measurement to result from statistical fluctuations due to the small number of photons imaged by the EGRET spark chamber and associated with the GRB, particularly since we limited the spark chamber events to those with energy between 100 MeV and 5 GeV. It is a simple matter to make this error estimate using a Monte Carlo simulation, and then add other errors to get a complete error estimate.
Let the integrated GRB photon number spectrum be denoted by . The fluence measured between energies and is given by
| (11) |
The number of source photons is given by
| (12) |
The probability of detecting a photon of energy is simply given by inverting the expression
| (13) |
for , where is a random number uniformly distributed between 0 and 1.
In the EGRET (and Fermi) energy range,
within a factor of for
and , and can be approximated by a power law
over this range, so we write .111See Fig. 1 and
www-glast.slac.stanford.edu/software/IS/glast_
lat_performance.htm; restricting the photon energies to
MeV makes this an excellent approximation. The effect of changing
on over the duration of the GRB is
negligible for EGRET, which was a pointing telescope, but can be
important in Fermi observations of GRBs. More accurate numerical
calculations can be made following the analytic inversion given
here.
Assuming that , the inversion of eq. (13) is trivial, and we obtain for the detected energy the value
| (14) |
where . The mean photon energy in the energy range is
| (15) |
The error in fluence due to the finite number, , of photons detected is then given by the root mean square deviation of the detected photon energies from the average photon energy, that is,
| (16) |
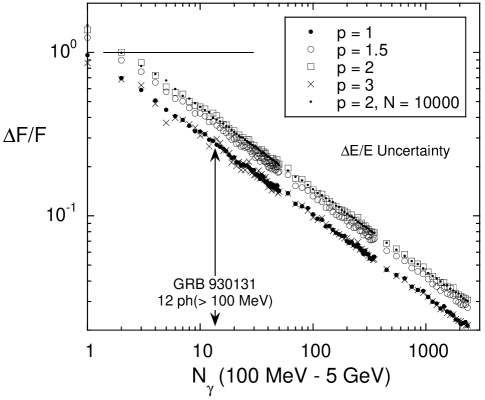
The fractional fluence error, , as a function of the number of detected photons MeV – 5 GeV) in the photon energy range between MeV to GeV range is shown in Fig. 3 for the simplest approximation of a flat effective area, so that . Because the fluence is weighted by energy, and we have restricted the photon energy to a finite range, a spectrum with gives the largest fluence uncertainty, which is well described by the function
| (17) |
where that the factor of 1.45 is derived from fitting the data (with p = 2) in Figure 3. We can take this expression as providing the maximum error in fluence from the statistical uncertainty due to the finite number of photons. If there is a priori knowledge that the intrinsic spectrum has a specific number index, e.g., , then the numerical coefficient of eq. (17) becomes rather smaller, . Eq. (17) is a conservative estimate of fluence uncertainty, though it still omits other possible systematic uncertainties. Note that in the EGRET era, GRB 930131 had the largest number of photons, MeV – 5 GeV), rays, in the 0.1 – 5 GeV range. As is apparent from Fig. 3, finite photon number gives the major source of error to the fluence measurement of EGRET spark-chamber GRB.
In comparison, the error associated with relative energy uncertainty is, as already noted, at the % level for EGRET. For the Fermi Gamma ray Space Telescope, the relative energy uncertainties at photon energies of 0.1, 1, and 10 GeV are %, 9%, and 8% for normal incidence, and %, 9%, and 5% at 60∘ off-axis (Atwood et al., 2009). Because this can be a calibration uncertainty affecting all photon energy measurements systematically rather than statistically, this uncertainty on the fluence will start to dominate for those rare GRBs detected with Fermi with more than photons between 100 MeV and 5 GeV. Effective area uncertainties also appear at the % level. Consequently, the uncertainty from the finite number of photons dominates fluence measurement for EGRET GRBs.
From the discussion of EGRET GRBs in Section 3.1 and their properties in Table 2, we can now reliably estimate the fluence uncertainty associated with finite number of photons, background and deadtime effects measured with EGRET in the 0.1 – 5 GeV energy range. For GRB 910503, we take MeV – 5 GeV) = 2, essentially giving 100% uncertainty in the measurement of fluence (taking twice this value would give a 2 upper limit). For GRB 910601, we again conservatively take MeV – 5 GeV) = 2 in view of possible background. For GRB 930131, we take MeV – 5 GeV) = 12, keeping in mind that a deadtime correction in the absolute fluence by tens of percent or more could be required, depending on the distribution of -ray arrival times, which Fermi will measure. For GRB 940217, we take MeV – 5 GeV) = 8, subtracting two background photons that could have contributed during the first prompt and early afterglow in this GRB (note that no EGRET photons in the 100 MeV – 5 GeV range were detected after Earth occultation). For GRB 940301, we take MeV – 5 GeV) = 5.
3.3. Fluence Estimate from EGRET Photon Event List
The statistical errors associated with the finite number of detected photons, being the largest source of error for the EGRET GRBs, are used with the values in Table 2 and eq. (10) to produce Fig. 4. This figure displays the 100 MeV – 5 GeV fluence measured with the EGRET spark chamber vs. the keV – 2 MeV fluence measured with BATSE. Bolometric corrections to a larger energy range are usually small if , the peak photon energy of the spectrum, falls in this waveband. This is not always the case for these GRBs, and comparison of this figure with reported results in the Fermi era must consider bolometric corrections.
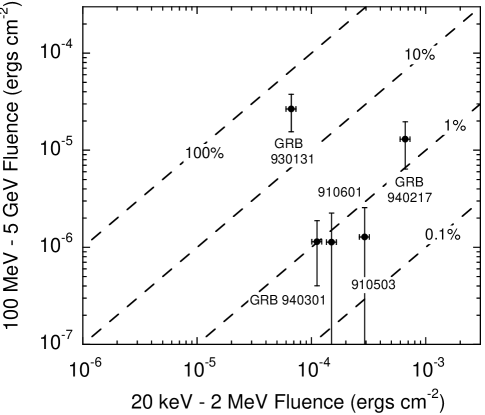
This fluence-fluence diagram provides, potentially, one way to discriminate between different classes of GRBs on the basis of their -ray radiative efficiency. A much more accurate comparison will be provided for those GRBs with known redshift. Because deadtime and background effects have been corrected from these EGRET spark chamber GRBs, the fluence-fluence diagram gives a picture where the long-duration GRBs have a radiative efficiency in MeV rays of % or a few % of the bolometric energy output. Assuming no class bias in the values in Table 2, these give the average deduced radiative efficiency % (column 8). This suggests that we use as a mean fluence ratio a number between , before considering broad ranges of value of or even separate classes with different values.
| spectral index of -2 | spectral index of -2.2 | |||
|---|---|---|---|---|
| Threshold Energy | ||||
| 30 MeV ( photons) | 30a (18)b | 7a (4)b | 12c (6)d | 2c ( 1)d |
| 100 MeV ( photons) | 20 (12) | 2 ( 1) | 8 (4) | 1 ( 1) |
| 1 GeV ( photons) | 4 ( 2) | 1 (0) | 1 (0) | 1 (0) |
Note. — This column has value with fluence ratio of a10%; b5%; c8%; d4%.


4. Alternate Fluence Estimate
As a check on , we also make an independent estimate using the number MeV) of MeV -ray photons that were detected by EGRET (Dingus, 1995), assuming a hard component of the spectrum with spectral indices and . The EGRET fluence in the energy range of 100 MeV to 5 GeV can be expressed as
| (18) |
where is the angle-dependent EGRET effective area obtained by interpolating the data in Figure 14 of Thompson et al. (1993). From Table 2 we find that the average measured fluence ratios for the 5 spark chamber bursts are (column 10) and (column 12) for spectra indices of and , respectively. This is consistent with our previous estimate of %, because that referred to the MeV–5 GeV fluence to 20 keV–2 MeV fluence ratio, rather than the MeV–5 GeV fluence to 20 keV–2 MeV fluence ratio, the latter of which is expected to be % larger. However, these average fluence values of 9% and 7% are dominated by the boundary of long-soft and short-hard GRB 930191 with the fluence ratios of 40% and 30% for spectra indices of -2 and -2.2, respectively. Four other bursts are long GRBs with the average fluence ratios of 1.3% and 1%. Hence, we expect the average fluence for the long GRBs to be larger, conservatively, we assume values of 5% and 4% for spectra indices of and , respectively, to represent long-duration GRBs.
However, as previously noted, the total -ray flux is probably larger than EGRET measured. The -ray emission from GRB 940217 (Hurley et al., 1994) likely persisted during the period of Earth occultation, easily increasing the number of photons by . Deadtime effects, as seen in GRB 930131 (Sommer et al., 1994), could have caused the number of rays to be undercounted. Besides, there is the example of GRBs with anomalous hard tails, like GRB 990104 (Wren et al., 2002) and GRB 941017 (González et al., 2003), the latter with fluence in the – MeV range comparable to or greater than the sub-MeV fluence. Further, there is the low-significance Milagrito detection of the X-ray flash-type GRB 970417a (Atkins et al., 2003), which would not only have to be at low redshift but also have much greater TeV than MeV fluence. Hence we expect the average fluence ratios between EGRET and BATSE to be % and % for spectra indices of and , respectively.
We use for model with and for model with to define the value of . The estimated total number of long-duration GRBs that get detected by any detectors are based on the BATSE 4B fluence distribution (Paciesas et al., 1999), shown in Fig. 2, assuming an annual GRB rate of 670 GRB/yr, including untriggered GRBs with photon fluxes smaller than 0.3 cm-2 s-1 (Band, 2002). The BATSE 4B Catalog contains 1292 bursts total, including short and long duration GRBs. There are a total of 872 long-duration GRBs that are identifiable in the BATSE 4B Catalog. When we estimate the number of source counts over one year period, the ratio 872/1292 is applied to represent the long-duration GRB predictions.
5. Results
In Figs. 5 and 6, we plot full-sky Fermi LAT and AGILE GRB detection rates, assuming that the Band-spectrum extends to MeV energies. This simple model predicts that , and GRBs will be observed per year with the Fermi LAT with at least 5 photons with energies MeV, MeV, and GeV, respectively. This is assuming a hard spectral index and a fluence ratio %. For , the model predicts that , , and probably no GRBs per year should be detected with at least 5 photons with MeV, MeV, and GeV, respectively, now assuming that %.
The analysis also predicts that and GRBs per year with at least 5 photon counts at 30 MeV and 100 MeV, respectively, should be detected by AGILE assuming and % (see Fig. 5d). For , the model predicts that and probably no GRBs with at least 5 photons with MeV and MeV, respectively, will be detected by AGILE per year with % (see Fig. 6d). A consistently smaller number of GRBs/yr full-sky is predicted for both Fermi and AGILE for the steeper spectral indices, as expected. In Table 3, we summarize the predicted number of GRBs per yr with at least 5 photons greater than a specific -ray photon energy in the FoV, sr, of the Fermi LAT and AGILE, considering GRBs with hard spectral indices and , and for fluence ratios %, 8%, 5%, and 4%.
These models assume that all GRBs have power law with and 10% fluence ratio or and 8% fluence ratios, and these assumptions would be first to be examined if Fermi LAT shows strong violations of these predictions. For and %, we estimate from Fig. 5 that – 2 GRBs per year will be detected with the Fermi telescope that have more than 100 rays with MeV. The models also predicts that the GBM fluences of long-duration GRBs detected with the LAT should be large, ergs cm-2. The distribution of fluences can be compared with predicted distributions for Swift and the Fermi GBM (Le & Dermer, 2007).
From this treatment of the fluence ratio, we can estimate the diffuse extragalactic -ray background produced by GRBs using the 4B BATSE fluence catalog based on the EGRET/BATSE fluence ratio. From the 4B Catalog there are a total of 1292 GRBs, of which 872 bursts are long-duration GRBs. The total average fluence for the long-duration GRB is about . Assuming 670 GRBs/yr, we estimate that less than 1% of the diffuse extragalactic -ray background could come from GRBs assuming or 10% fluence ratio. Unless there is a large class of GRBs, which were not found with the EGRET spark chamber, this suggests that GRBs gives very little contribution to the diffuse extragalactic -ray background (e.g., Dermer, 2006; Casanova et al., 2007).
6. Conclusions
As we enter the Fermi era, it is worthwhile to make final predictions based on results from the EGRET CGRO era. Here we have adopted an approach making use of mean fluence ratios in the EGRET 100 MeV – 5 GeV and BATSE 20 keV – 2 MeV bandpasses. Obviously this already introduces significant K-corrections when calculating the intrinsic properties of the GRB sources; a sample of GRBs with known redshifts is clearly preferred.
Nevertheless, we fix the fluence ratios in these bands to obtain straightforward predictions for all-sky detection rates with Fermi, using on-axis effective areas and the BATSE 4B fluence distribution. Multiplication by gives the final detection rate with the Fermi LAT tracker and calorimeter (Atwood et al., 2009)
For a 10% fluence ratio and a hard component with index, we estimate – 2 per month with more than 5 photons with MeV rays in the LAT FoV, and 1 or 2 per year with more than 100 rays with MeV. A bright GRB for spectral modeling, with more than photons with MeV, is predicted once or twice per year. We note that with the use of fluence spectrum, the detection of a GeV photon from a GRB is considered very improbable, barring the existence of an additional component harder than .
Furthermore, as the Fermi GBM and the Fermi LAT instruments begin to collect data from GRBs, we recommend to plot LAT fluence vs. GBM fluence and, more importantly, mean LAT GRB spectral index vs. LAT/GBM fluence ratios to search for distinct classes of GRBs distinguished by their high-energy properties.
References
- Atkins et al. (2003) Atkins, W. B., et al. 2003, ApJ, 583, 824
- Atwood et al. (2009) Atwood, R., et al. 2009, ApJ, to be submitted
- Band et al. (1993) Band, D., et al. 1993, ApJ, 413, 281
- Band (2002) Band, D. L. 2002, ApJ, 578, 806
- Baring (2006) Baring, M. G. 2006, ApJ, 650, 1004
- Belli et al. (2007) Belli, F. et al. 2007, Nuclear Instruments and Methods in Physics Research, A570, 276
- Briggs et al. (1999) Briggs, M. S., et al. 1999, ApJ, 524, 82
- Casanova et al. (2007) Casanova, S., Dingus, B. L., & Zhang, B. 2007, ApJ, 656, 306
- Catelli et al. (1998) Catelli, J. R., Dingus, B. L., & Schneid, E. J. 1998, American Institute of Physics Conference Series, 428, 309
- Dermer (2006) Dermer, C. D., 2006, in The Multi-Messenger Approach to High-Energy Gamma-Ray Sources, eds. J. M. Paredes, O. Reimer, and D. F. Torres (New York: Springer), 127
- Dermer (2007) Dermer, C. D. 2007, ApJ, 659, 958
- Dermer & Dingus (2004) Dermer, C. D., & Dingus, B. L. 2004, New Astr. Rev., 48, 537
- Dingus (1995) Dingus, B. L. 1995, Ap&SS, 231, 187
- Dingus et al. (1998) Dingus, B. L., Catelli, J. R., & Schneid, E. J. 1998, American Institute of Physics Conference Series, 428, 349
- González et al. (2003) González, M. M., Dingus, B. L., Kaneko, Y., Preece, R. D., Dermer, C. D., & Briggs, M. S. 2003, Nature, 424, 749
- González et al. (2009) González, M. M., et al. 2009, ApJ, submitted
- Hurley et al. (1994) Hurley, K., et al. 1994, Nature, 372, 652
- Kaneko et al. (2008) Kaneko, Y., González, M. M., Preece, R. D., Dingus, B. L., & Briggs, M. S. 2008, ApJ, 677, 1168
- Kippen et al. (2001) Kippen, R. M., et al. 2001, Gamma 2001: Gamma-Ray Astrophysics, 587, 801
- Kouveliotou et al. (1993) Kouveliotou, C., Meegan, C. A., Fishman, G. J., Bhat, N. P., Briggs, M. S., Koshut, T. M., Paciesas, W. S., & Pendleton, G. N. 1993, ApJ, 413, L101
- Kouveliotou et al. (1994) Kouveliotou, C., et al. 1994, ApJ, 422, L59
- Kulkarni et al. (1999) Kulkarni, S. R., et al. 1999, Nature, 398, 389
- Kwok et al. (1993) Kwok, P. W., et al. 1993, American Institute of Physics Conference Series, 280, 855
- Le & Dermer (2007) Le, T., & Dermer, C. D. 2007, ApJ, 661, 394
- Meegan et al. (1996) Meegan, C. A., et al. 1996, ApJS, 106, 65
- Merck et al. (1995) Merck, M., et al. 1995, IAU Colloq. 151: Flares and Flashes, 454, 358
- Norris & Gehrels (2008) Norris, J. P., & Gehrels, N. 2008, American Institute of Physics Conference Series, 1000, 280
- Omodei (2006) Omodei, N., & for the GLAST/LAT GRB Science Group 2006, astro-ph/0603762
- Paciesas et al. (1999) Paciesas, W. S., et al. 1999, ApJS, 122, 465
- Pittori et al. (2004) Pittori, C., Tavani, M., & AGILE Team 2004, Bulletin of the American Astronomical Society, 36, 929
- Preece et al. (2000) Preece, R. D., Briggs, M. S., Mallozzi, R. S., Pendleton, G. N., Paciesas, W. S., & Band, D. L. 2000, ApJS, 126, 19
- Schneid et al. (1992) Schneid, E. J., et al. 1992, A&A, 255, L13
- Schneid et al. (1995) Schneid, E. J., et al. 1995, ApJ, 453, 95
- Sommer et al. (1994) Sommer, M., et al. 1994, ApJ, 422, L63
- Sreekumar et al. (1998) Sreekumar, P., et al. 1998, ApJ, 494, 523
- Stecker et al. (2008) Stecker, F. W., Hunter, S. D., & Kniffen, D. A. 2008, Astroparticle Physics, 29, 25
- Strong et al. (2004) Strong, A. W., Moskalenko, I. V., & Reimer, O. 2004, ApJ, 613, 956
- Thompson et al. (1993) Thompson, D. J., et al. 1993, ApJS, 86, 629
- Thompson (1986) Thompson, D. J. 1986, NIM Physics Research A, 251, 390
- Wren et al. (2002) Wren, D. N., Bertsch, D. L., & Ritz, S. 2002, ApJ, 574, L47