[Oiii] emitters in the field of the
MRC 0316-257 protocluster
Abstract
Venemans et al. (2005) found evidence for an overdensity of Ly emission line galaxies associated with the radio galaxy MRC 0316–257 at indicating the presence of a massive protocluster. Here, we present the results of a search for additional star-forming galaxies and AGN within the protocluster. Narrow-band infrared imaging was used to select candidate [Oiii] emitters in a 1.11.1 Mpc2 region around the radio galaxy. Thirteen candidates have been detected. Four of these are among the previously confirmed sample of Ly galaxies, and an additional three have been confirmed through follow-up infrared spectroscopy. The three newly confirmed objects lie within a few hundred km s-1 of each other, but are blueshifted with respect to the radio galaxy and Ly emitters by km s-1. Although the sample is currently small, our results indicate that the radio–selected protocluster is forming at the centre of a larger, co-moving Mpc super-structure. On the basis of an HST/ACS imaging study we calculate dust-corrected star-formation rates and investigate morphologies and sizes of the [Oiii] candidate emitters. From a comparison of the star formation rate derived from UV-continuum and [Oiii] emission, we conclude that at least two of the [Oiii] galaxies harbour an AGN which ionized the O+ gas.
keywords:
Galaxies: active - Galaxies: clusters: general - Galaxies: evolution -Cosmology: observations - Cosmology: early Universe1 Introduction
To understand the formation and evolution of galaxy clusters, it is desirable to find and study their high redshift progenitors. Although galaxy clusters have been found out to a redshift of (Mullis et al., 2005; Stanford et al., 2005), their higher redshift progenitors are sparse and difficult to find. A successful technique for finding more distant structures that by–passes the need for surveying very large areas of the sky is to search for emission-line galaxies in the neighbourhood of luminous high–redshift radio galaxies (HzRGs) using narrow-band imaging. Multiwavelength studies of HzRGs have resulted in strong evidence that they are massive forming galaxies (e.g. Seymour et al., 2007; Villar-Martín et al., 2006) and are frequently associated with overdensities of emission-line galaxies (Venemans et al., 2007). These overdense regions in the early universe are the likely progenitors of local galaxy clusters or groups and are termed ”protoclusters”. PROCESS (PROtoCluster Evolution Systematic Study) is a project designed to use a few key radio-selected protoclusters with to investigate the formation of and evolution of various populations of galaxies in dense environments (Overzier et al., 2006, 2007, 2008; Venemans et al., 2005, 2007).
This article presents observations of the protocluster surrounding the PROCESS radio galaxy MRC 0316-257. The associated radio source was listed in the 408 MHz Molonglo Reference Catalogue (Large et al., 1981) and was optically identified with a galaxy at by McCarthy et al. (1990). Le Fevre et al. (1996) spectroscopically confirmed two Ly emitting companions to the HzRG, indicating that the radio galaxy is located in a dense environment. Recently, Venemans et al. (2005, 2007) confirmed 31 Ly emitters at a similar redshift of MRC 0316-257. The corresponding overdensity is approximately 3.3 times the galaxy field density at this redshift. The protocluster redshift of corresponds to an epoch when both the cosmic star formation rate and the quasar luminosity function were at their peak, indicating that this is a key epoch for studying the evolution of different populations of galaxies. We have identified and studied additional galaxies in the MRC 0316-257 protocluster on the basis of their redshifted [Oiii] emission. The observations that we shall discuss here consist of infrared imaging and spectroscopy with ESO’s Very Large Telescope (VLT) and deep optical imaging with the Advanced Camera for Surveys (ACS) on the Hubble Space Telescope (HST).
Section 2 of this article is an outline of the observations and the data reduction. In Section 3 we present results from the VLT search programme and the deep ACS images. Corrected star formation rates derived from the UV fluxes are used to discriminate between star-forming galaxies and obscured AGNs and the morphologies and sizes of the candidate emitters are discussed. The implications of our results for the space density of [Oiii] emitting galaxies and the origin of the [Oiii] emission are discussed in Section 4 and the conclusions of the article are presented in Section 5. We assume a flat cosmology with H0=71 [km sec-1 Mpc-1] and =0.27 (Spergel et al., 2003). At the distance of MRC 0316-257 an angular scale of 1 arcsec corresponds to a projected linear scale of 7.73 kpc. All magnitudes are given in the AB system (Oke, 1974).
2 OBSERVATIONS DATA REDUCTION AND SAMPLE SELECTION
2.1 Infrared Narrow–band Imaging and Selection of [Oiii]–Emitting Candidates
To search for [Oiii] emitting galaxies near MRC 0316–257, narrow- and broad-band imaging were carried out between 2003 November and 2004 October in service mode with ISAAC (Moorwood et al., 1998) on the 8.2 m ESO VLT Antu (UT1). The pointing was chosen to include the radio galaxy and as many of the confirmed Ly emitters from Venemans et al. (2005) as possible.
The ISAAC narrow–band filter used was NB_2.07, with a central wavelength () of 2.07 m and a width () of 0.026 m. This is sensitive to [Oiii] emission at redshifts of –3.16. Broad-band images were obtained to provide an ”off-band” measurement and the magnitude and slope of the continuum emission from candidate line emitters. These were taken in the filters (m and m) and (m and m). The detector was an Hawaii array with 10241024 pixels. The pixel scale was 0.148 arcsec pixel-1 and the field of view 152152 arcsec2. The images were taken using dithered exposures of length 150, 75, and 183 seconds in , and the narrow-band, each with sub-integrations of 30, 15, and 61 seconds to avoid over-exposure of the background. The total exposure times were 5.3 hours each in and , and 6.9 hours in the narrow-band. Standard stars were observed for the photometric calibration. The observed standards include FS6, FS11, and P565C taken from the UKIRT Faint Standards catalog (Hawarden et al., 2001) and S363D from the LCO/Palomar NICMOS Photometric Standards list (Persson et al., 1998).
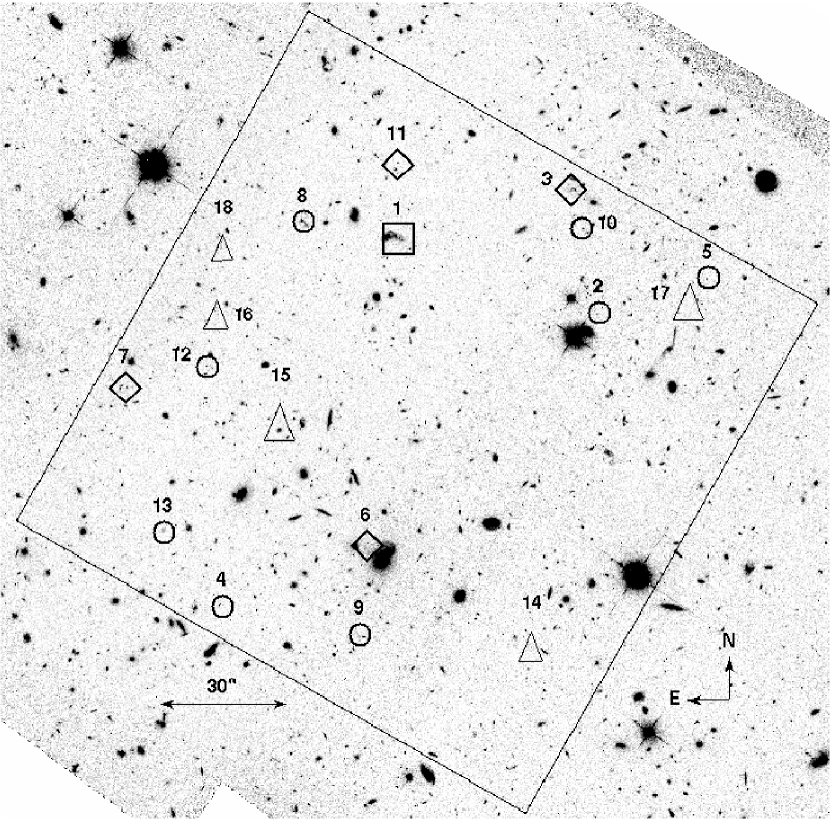
The images were reduced using the Experimental Deep Infrared Mosaicing Software (XDIMSUM111http://iraf.noao.edu/iraf/ftp/iraf/extern/xdimsum/xdimsum.readme). The effective area of the reduced images was 139139 arcsec2, and the seeing, as measured from bright stars in the field was 0.45 arcsec in the NB_2.07 image and 0.55 arcsec in the and images. The magnitude zero-point of the broad-band images obtained from the various standard star observations has an accuracy of 0.01 mag () and 0.03 mag (). The zeropoint of the narrow-band image was derived using 52 objects that were detected at a signal-to-noise of at least 20 in both and . Narrow-band magnitudes were computed for the 52 objects assuming a power–law spectral energy distribution and with the associated counts in the narrow-band image the zeropoint was derived with an accuracy of 0.01 mag. The 5 limiting magnitudes per square arcsecond were 23.9 (NB2_2.07), 25.6 () and 24.7 (). Objects in the images were extracted using the program SExtractor (Bertin & Arnouts, 1996). The NB_2.07 image was used as the detection image, and aperture photometry was subsequently performed on both the narrow- and broad-band images. For detection, objects were required to have a signal-to-noise of in the NB_2.07 image. The colours of the detected objects were measured in circular apertures, while the “total” flux was measured in an elliptical aperture. A total of 143 objects having a signal-to-noise of at least 5 were detected in the narrow-band image . Following Kurk et al. (2004), we selected objects with a rest-frame equivalent width EW Å and a significance EW0/EW0 as candidate [Oiii] emitters (see Venemans et al. (2005) for more details on the object detection and photometry) and on how EW0 and EW0 are computed. Each candidate was inspected visually in order to remove spurious sources. This resulted in a list of 17 candidate [Oiii] emitting galaxies. To remove foreground galaxies with emission lines that fall into the NB_2.07 filter, we measured the colours of the candidates on archival , and images (Venemans et al., 2005, 2007). Three candidates had colors of and are likely foreground objects. Two of the candidates lie very close together and after inspection of the galaxy morphologies were determined to be a single merging object. The spatial distribution of the remaining 13 candidate [Oiii] emitters is plotted in Fig. 1. One of the candidates is the radio galaxy (ID 1), four are spectroscopically confirmed Ly emitters (ID 3, 6, 7, 11), six are likely Lyman break galaxies (LBGs, defined as objects with and ; ID 2, 3, 4, 7, 8, 10) and two satisfy the selection criteria for distant red galaxies (DRGs, ; ID 3, 5). For an overview see Table 1.
2.2 ACS Optical Imaging
We obtained deep images in and filters with the Advanced Camera for Surveys (ACS; Ford et al. 1998) on the HST. The MRC 0316–257 protocluster was observed with the ACS during 2004 December 14–31 and 2005 January 2–21 in two ACS fields that overlapped by 1′ in a region that includes the radio galaxy. The exposure time per pointing was 22,410s in (10 orbits per pointing) and 11,505s in (5 orbits per pointing). The images were combined with a 6,300s exposure (3 orbits) taken with ACS on 2002 July 18. All observations were processed through the ACS GTO pipeline (Blakeslee et al., 2003) to produce registered, cosmic-ray rejected images. The extinctions in the direction of the radio galaxy are 0.04 and 0.03 mag at wavelengths corresponding to the and filters, respectively. In its deepest part (about 1/5 of the image), the 2 depths are 29.1 () and 29.6 AB mag (), measured in a square diameter aperture. In its shallowest outer part (about 2/5 of the image), the depths are 28.5 () and 29.3 ( ) mag. The r625 and I814 filter bands correspond to a central wavelength of 1513 and 1937 in the rest-frame respectively. We determined the rest-frame UV magnitudes and the relative RMS errors of the [Oiii] candidates from the ACS images using SExtractor, cross-checking the results using both circular and elliptical apertures with the IDL routine ATV. All the 13 [Oiii] candidate emitters were detected in both the UV filters with the faintest having a I814 magnitude of 26.2.
2.3 Infrared Spectroscopy
Infrared spectra of four candidate [Oiii] emitters were obtained with ISAAC (Moorwood et al., 1999) at the ESO VLT Antu (UT1) on the nights of August 31, September 3 and November 23, 2006. The observations used the short wavelength camera of ISAAC and the medium resolution grating, resulting in a pixel scale of and a spectral dispersion of 1.23Å. The observations were carried out under variable optical seeing conditions, which were typically between , except for the final part of the night of September 3, where the seeing was . The slit was employed in all cases, except for a 90 min observation on the night of September 3, when the slit width was changed to . The slit resulted in a resolution of 7.4Å full width at half maximum (FWHM; or 2600).
The target galaxies were acquired using the imaging mode of ISAAC. The [Oiii] galaxies are faint so the slit was first centered on a nearby bright star with and then offset to the target galaxies. High precision is required for determining the co-ordinates of the [Oiii] emitters. However, the reduced ISAAC NB_2.07, - and -band images that were used for the candidate selection have poor astrometric accuracy due to the low number of reference stars in the field. Therefore a -band FORS image of the field, earlier obtained (Venemans et al., 2005) was used to determine the required offsets.
Four candidate [Oiii] emitters were observed, galaxies identified as 2, 4, 5 and 9 in Fig. 1. The exposure time for candidates ID 5 and 2 was 19 800 s and for ID 4 and 9 was 18 000 s. We employed the classical ABBA sequence to remove the sky background and sky emission lines. The exposure time for each integration was either 600 or 900 seconds. All observations were carried out at airmass smaller than 1.7. A set of Xeon and Argon arc spectra were taken during each observing night for wavelength calibration.
The data were reduced using the ISAAC data reduction software package eclipse, which is available from ESO. The data were flat-fielded and the arcs were used to model and remove the slit curvature, and wavelength calibrate the data. The arcs from the night of 2006 November 23 contained 14 detected arclines and the standard deviation of the fit was 0.2Å, whereas on the nights of 2006-08-31 and 2006-09-03 there were 12 and 11 lines detected with a standard deviation of 0.4Å and 0.5Å respectively. The wavelength of the skylines were measured to check the arc calibration. No deviations greater than 0.6Å were found. The sky background and night sky emission lines were removed by the ABBA dither sequence, however a feature at 2.041m had prominent residuals and has been masked out in the spectra shown in Fig. 2.
3 Results
3.1 Redshift Distribution
The spectra of the [Oiii] galaxies are presented in
Fig. 2 together with the night sky emission line
spectrum. Three of the four targets (ID 2, 4, and 5) exhibit a strong [Oiii]5007,4959 emission line doublet shifted into the window 3.095 z 3.105. The presence of both lines of the [Oiii] 5007,4959 doublet in these spectra confirm that the selected targets are [Oiii] emitters. Table 1 lists the redshifts of the three confirmed [Oiii] emitters, the radio
galaxy MRC 0316-257 and the four [Oiii] candidates, that are
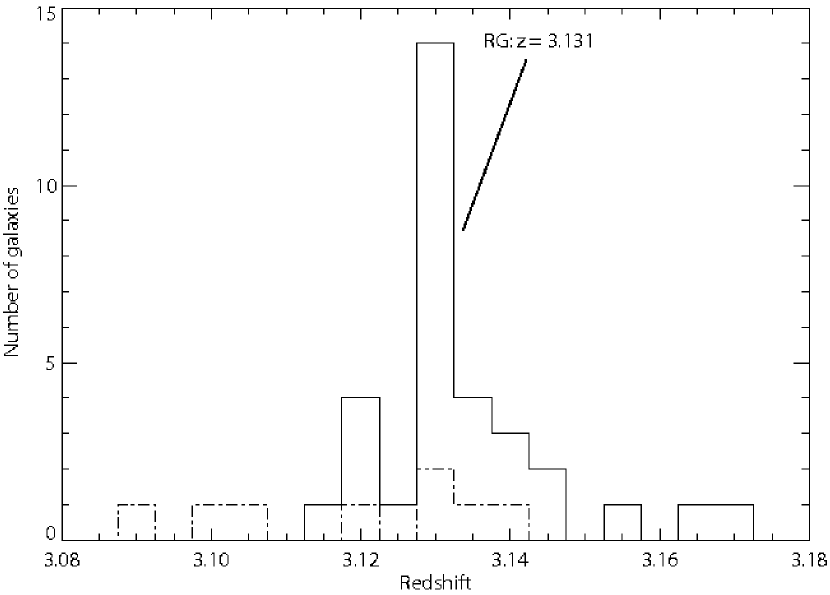
also Ly emitting galaxies spectroscopically confirmed to be members of the MRC 0316-257 protocluster. Fig. 3 shows the redshift distribution of the spectroscopically confirmed [Oiii] emitting galaxies together
with the redshift distribution of the spectroscopically confirmed
Ly emitting galaxies that comprise part of the protocluster around
MRC 0316-257. The redshifts of the Ly emitting galaxies are
taken from Venemans et al. (2005). They were selected using a narrow-band filter sensitive to the redshift range 3.12–3.17.
The three spectroscopically confirmed [Oiii] emitting
galaxies occupy a narrow range in velocity distribution, although their redshifts falls 2100 km s-1 blueward of the mean redshift of the MRC 0316-257 protocluster.
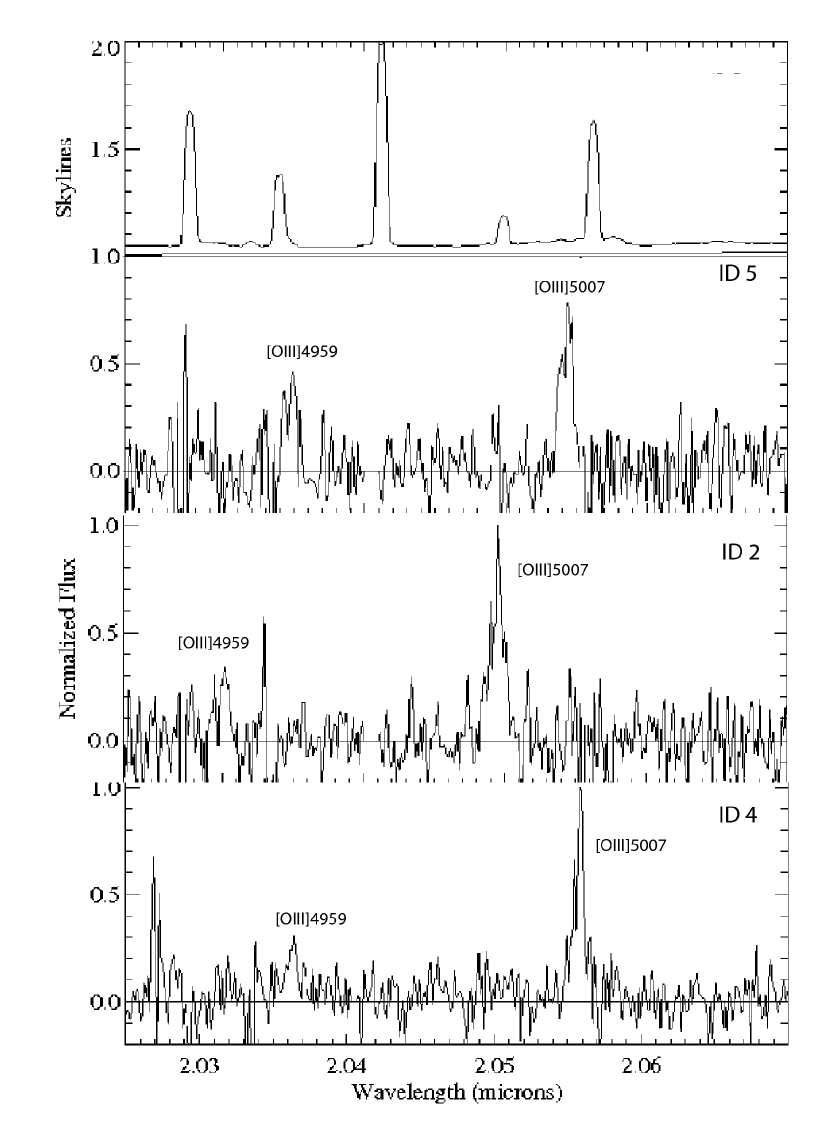
Although one candidate [Oiii] emitter (ID 9) was not detected, this non-detection is not significant. The object is almost a factor of four fainter than the faintest spectroscopically detected galaxy and its narrow–band flux would only have resulted in a marginal detection in the available spectroscopic exposure time.
| Source ID | RA (J2000) | Dec (J2000) | [Oiii] flux | Ly flux | Redshift | mV | comments |
|---|---|---|---|---|---|---|---|
| erg s-1cm2 | erg s-1cm2 | ||||||
| (1) | (2) | (3) | (4) | (5) | (6) | (7) | (8) |
| 1 | 03:18:12.1 | –25:35:10.5 | 169 | 84 | 3.131Lyα | 23.8 | RG, LBG, DRG, LAE |
| 2 | 03:18:08.6 | –25:35:28.8 | 39.0 | – | 3.094[OIII] | 25.3 | LBG |
| 3 | 03:18:09.0 | –25:34:59.3 | 8.7 | 18.0 | 3.136Lyα | 24.7 | LBG, DRG, LAE |
| 4 | 03:18:15.1 | –25:36:37.8 | 8.5 | – | 3.106[OIII] | 25.7 | LBG |
| 5 | 03:18:06.6 | –25:35:20.1 | 8.3 | – | 3.104[OIII] | 26.4 | DRG |
| 6 | 03:18:12.6 | –25:36:23.0 | 5.9 | 4.6 | 3.123Lyα | – | LAE |
| 7 | 03:18:16.8 | –25:35:46.1 | 4.3 | 6.3 | 3.131Lyα | 24.9 | LBG, LAE |
| 8 | 03:18:13.7 | –25:35:07.7 | 4.2 | – | – | 23.9 | LBG |
| 9 | 03:18:12.7 | –25:36:44.4 | 2.4 | – | – | 26.9 | – |
| 10 | 03:18:08.8 | –25:35:08.3 | 2.3 | – | – | 25.7 | LBG |
| 11 | 03:18:12.0 | –25:34:52.9 | 2.3 | 1.5 | 3.141Lyα | 26.5 | LAE |
| 12 | 03:18:15.3 | –25:35:41.1 | 1.5 | – | – | – | – |
| 13 | 03:18:16.1 | –25:36:19.9 | 1.3 | – | – | 25.3 | – |
| 14 | 03:18:09.7 | –25:36:47.5 | 1.1 | 2.9 | 3.124 | – | LAE |
| 15 | 03:18:14.1 | –25:35:54.3 | 1.2 | 1.1 | 3.132 | – | LAE |
| 16 | 03:18:15.2 | –25:35:28.9 | 0.5 | 1.0 | 3.146 | – | LAE |
| 17 | 03:18:06.9 | –25:35:26.2 | 0.7 | 0.8 | 3.143 | – | LAE |
| 18 | 03:18:15.1 | –25:35:13.1 | 0.7 | 0.72 | 3.131 | – | LAE |
3.2 Extinction–corrected Star Formation Rates of the [Oiii] Emission Line Galaxies
3.2.1 Star Formation Rates from UV Continuum
Under the assumption that the galaxies are dominated by hot, young massive stars and are relatively dust free, one can use the luminosity of the UV continuum to estimate a star formation rate (SFR). We convert the r625 magnitudes of the [Oiii] candidates into a SFR using
| (1) | |||||
for a Salpeter IMF and where is the luminosity distance and the flux density (Madau et al., 1998). We determine a reddening correction from the UV continuum slope, derived from the measured colour. We assume the galaxies have a standard power-law spectrum with slope (, so that a spectrum that is flat in has . We define
| (2) |
Where and are the central wavelengths of the r625 and I814 ACS-filters. In general, we note that the UV slope gives a reasonable estimate for the extinction if the object has a ’pure’ starburst spectrum and is not a mix of old and new populations (Kong et al., 2004).. We determine the extinction through
| (3) |
with , as expected for ionizing populations (Meurer et al., 1995). The changes somewhat as a function of age and which part of the UV spectrum is being used to estimate the slope. Meurer & Heckman (1995) derived from a fit to the UV spectrum over the wavelength range that we approximate here with r625-I814. A wide range of star formation histories, from short bursts less then 10 Myr old to continuous star formation 100 Myr and older will produce a spectrum with . The range in of for ionizing populations amounts to an uncertainty in obscuration of mag. We derive the obscuration at 1500 () using the correlation in Calzetti et al. (2000):
| (4) |
although we note that this correlation has a relative large scatter. We present the extinction-corrected UV SFRs in Table 2.
We do not include the UV continuum and [Oiii] SFRs for the radio galaxy because the photometry is unreliable as it lies very close to a luminous foreground galaxy. However, we note that the UV continuum of the radio galaxy is dominated by emission from stars. The contribution from scattered AGN light is limited by the upper limit on the polarization of the continuum of % (De Breuck & Reuland, 2005). If all the light at a rest–frame of is due to young stars, the SFR of the radio galaxy is , (uncorrected for dust absorption). This is similar to the uncorrected SFRs in radio galaxies at (Vernet et al., 2001) as calculated from the rest–frame UV continuum. However, the calculated SFR is likely to be a lower limit because radio galaxies are known to have significant amounts of obscured star formation (Stevens et al 2003).
3.2.2 Star Formation Rates from [Oiii] Emission
Kennicutt (1992) demonstrated that the large dispersion in the [Oiii]/H ratio among star forming galaxies makes [Oiii] an unsuitable emission line for determining star formation rates (SFRs). The large dispersion is dominated by the variation in excitation mechanism and oxygen abundance, as well as reddening (Moustakas et al., 2006). However, Moustakas et al. (2006) note that [Oiii] can be used to make a crude estimate of the SFR and in particular can be used to estimate minimum SFRs. Fig. 13 from Moustakas et al. (2006) shows that there is a maximum [Oiii]/H ratio observed from star forming galaxies which is (Teplitz et al., 2000). Using this maximum ratio and the conversion between H and SFR from Kennicutt (1998):
| (5) |
we derived a lower limit to the SFR from the [Oiii] luminosity to be:
| Source ID | Corr-SFR(UV[1550]) | Corr–SFR ([Oiii]) | E(B-V)UV | |
|---|---|---|---|---|
| [M/yr] | [M/yr] | |||
| (1) | (2) | (3) | (4) | (5) |
| 1 | 439.8 | – | – | 0.358 |
| 2 | 9.1 | 252.8 | 27.7 | 0.090 |
| 3 | 17.1 | 44.5 | 2.6 | 0.061 |
| 4 | 15.3 | 122.2 | 8.0 | 0.173 |
| 5 | 5.1 | 36.1 | 7.1 | 0.045 |
| 6 | 1.4 | 63.3 | 45.2 | 0.141 |
| 7 | 16.5 | 22.1 | 1.4 | 0.065 |
| 8 | 150.1 | 45.1 | 0.3 | 0.136 |
| 9 | 5.1 | 20.4 | 4.0 | 0.124 |
| 10 | 8.0 | 14.6 | 1.8 | 0.084 |
| 11 | 5.1 | 36.2 | 7.1 | 0.180 |
| 12 | 2.4 | 7.3 | 3.1 | 0.055 |
| 13 | 16.7 | 20.7 | 1.2 | 0.184 |
| (6) |
We note that the extinction derived from the ionized gas (Fanelli et al. 1988) is not the same as the extinction derived from the UV stellar continuum (Calzetti & Heckman, 1999; Calzetti et al., 2000). We have therefore used the calibration from Calzetti et al. (2000) linking the stellar continuum colour excess to the colour excess derived from the nebular gas emission lines:
| (7) |
We determined the intrinsic [Oiii] line flux through
| (8) |
where and are the intrinsic and observed [Oiii] line flux densities, respectively, and is defined as and given by:
| (9) | |||||
where is 0.5007 the rest–frame wavelength of the [Oiii] emission line, and the default value of is 4.05 based on comparison with starburst galaxies (Calzetti & Heckman, 1999; Calzetti et al., 2000).
We list extinction-corrected [Oiii] SFRs and the ratio in Table 1. This ratio shows that approximately half (7/13) of the candidates have a comparable SFR derived from the UV continuum and [Oiii] emission, whilst 3/13 have a ratio of approximately 7–8, and 2/13 have very high ratios. A large discrepancy between the derived SFRs on the basis of UV continuum and [Oiii] emission, i.e. a high , may indicate a different or additional [Oiii] excitation source other than star formation. We note that the [Oiii] SFRs are lower limits as we used the maximum [Oiii]/H ratio of 2.4. Hence the may be larger by this factor. Moustakas et al. (2006) show that variations in chemical abundance, ionization parameter and reddening all increase the scatter in the relation between the SFR as derived by H emission and [Oiii] luminosity. They conclude that the uncertainity associated with converting the [Oiii] luminosity into a SFR is a factor of 3-4. We conclude that the [Oiii] luminosity of only two galaxies (ID 2 and 6) is beyond that expected from its UV-determined star formation with more than confidence, therefore they require an additional excitation source –most likely an AGN. We don’t quote measurement errors for the SFRs in the Tables because they are much smaller than the intrinsic scatter of 3-4 in the conversion.
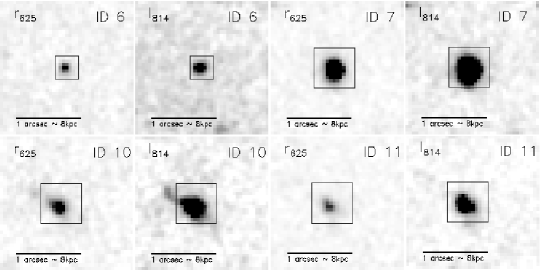
3.3 Sizes and Morphologies of the [Oiii] Emitters
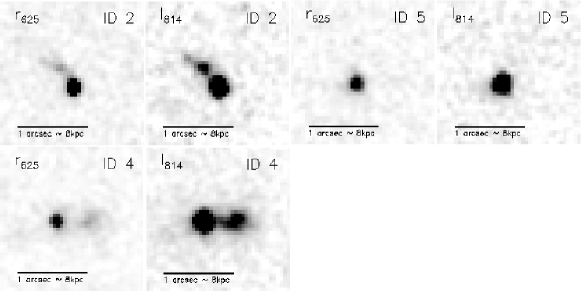
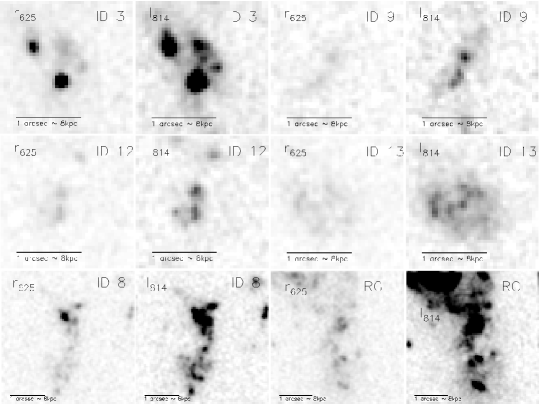
Figures 4, 5 and 6 show r625 and I814 ”postage-stamp” regions of the 13 [Oiii] candidates. From a visual inspection approximately half (8 objects) of the [Oiii] candidate emitters have morphologies characterized as a bright compact core surrounded by diffuse emission with significantly lower surface brightness. The remaining 5 candidates (including the radio galaxy shown in Fig. 6) have diffuse or clumpy morphologies. These objects have larger sizes and do not posses an obvious core. To quantify the sizes of these objects, the half light radius () of each emitter was measured using the program SExtractor on the I814-band images. The half light radius is defined as the radius of a circular aperture in which the flux is 50% of the total flux. The half light radii of the candidates range from 0.06 to 0.75 arcsec. The sizes of the candidate emitters in the –band are given in Table 3 . Galaxies that are diffuse or clumpy have larger uncertainties due to their irregular shapes. The measured physical sizes correspond to 1.2–4.8 kpc. The mean half light radius of isolated, unsaturated stars in the ACS field was found to be arcsec. One of the [Oiii] candidates, ID 6, is classified as unresolved. We compared the measured sizes of the confirmed Ly emitters (IDs 3, 6, 7 and 11) with that of Venemans et al. (2005). The sizes of the confirmed Ly emitting sources in Venemans et al. (2005) were also derived from the analysis of an ACS image taken within the I filter, and the halflight radius of each emitter was measured using the program SExtractor too. We found a good match within an error of kpc. The mean half-light radius of the [Oiii] emitters is 1.8 kpc, which is comparable to that of luminous LBGs at z (Bouwens et al., 2004; Ferguson et al., 2004).
We find a range of morphologies from simple compact to clumpy and diffuse typical of LBGs (Giavalisco et al., 1996; Lotz et al., 2004, 2006; Elmegreen, 2007). The ACS image of the radio galaxy shows several objects within 3″( kpc), surrounded by low surface brightness emission ( mag arcsec-2). Such a structure is typical for the rest-frame UV emission from the hosts of the most luminous, radio-loud sources at high redshift (Pentericci et al., 1999; Venemans et al., 2005; Zirm et al., 2005; Miley et al., 2006; Hatch et al., 2008).
Objects IDs 3, 8, 9, 12 and 13 are clumpy with two or three clumps clearly visible in the I814-band image (Fig. 6). They are probably single extended objects with a lot of structure and clumps that we interpret as different regions of star formation, perhaps induced by a galaxy merger. According to Elmgreen et al. (2005) the clumpy objects may not be mergers,but rather unstable discs. Objects IDs 2, 4, 5 and IDs 6, 7, 10 and 11 are identified with single objects in the ACS images (Fig. 4 and 5). However, in some cases where the objects appear to be single ones in the [Oiii], the I814 images reveal “double-core” (ID 2, 4, 9 and 10). On average those two cores are separated less than 0.5 kpc from each other.
| Source ID | (arcsec.) | (kpc) | morphology |
|---|---|---|---|
| [arcsec] | [kpc] | ||
| (1) | (2) | (3) | (4) |
| 1 | – | – | clumpy (RG) |
| 2 | 0.13 | double–core | |
| 3* | 0.26 | clumpy | |
| 4 | 0.27 | double–core | |
| 5 | 0.10 | single compact–core | |
| 6* | 0.06 | single compact–core | |
| 7* | 0.20 | single compact–core | |
| 8 | 0.75 | clumpy | |
| 9 | 0.15 | single–core | |
| 10 | 0.17 | single compact–core | |
| 11* | 0.12 | single compact–core | |
| 12 | 0.19 | clumpy | |
| 13 | 0.43 | clumpy |
We note that the compact clumps seen in the HST images may contain substructure on a smaller scale than the HST resolution, that prevents one from concluding that they have spheroiodal or disky morphologies. This can be seen from a comparison with the rest-frame UV morphologies of a sample of local analogs of high redshift LBGs as well as with gravitationally lensed LBGs (Overzier et al., 2007). Both clumpy and compact core-dominated galaxies clearly show extended diffuse emission around or extending from them, which could be an indication of interacting systems (Younger et al., 2007). In a few cases, the [Oiii] emission coincides with the mean centroid of the UV continuum. In other cases, the [Oiii] emission mainly comes from one of the two components visible in the UV. Fig. 6 shows three objects (IDs 3, 9 and 12) that associate the position of the single [Oiii] selected candidate with respectively a double (IDs 3 and 9) and a triple (ID 12) detection in the ACS UV images (most clearly seen in the I814). In all the three cases the detection box gives the position of the candidate as referred in the [Oiii] selected list. In summary, the [Oiii]-emitting galaxies show a range of diverse morphologies.
4 discussion
4.1 Space Density of [Oiii] Emitting Galaxies
How do the redshifts of galaxies detected on the basis of their redshifted [Oiii] emission relate to the protocluster at found by Venemans et al. (2005) ? At , [Oiii] is the most easily observed bright emission line in star-forming galaxies, since H is redshifted beyond the near-infrared and Ly is only present in a small fraction of LBGs (Pettini et al. 1998, Shapley et al. 2003). However, the selection of [Oiii] emitters at high redshift using narrow-band imaging in the infrared is far less common than similar techniques used to target Ly or H (Teplitz et al., 2000; Moorwood et al., 2000). Consequently, not much is known about the number density and clustering statistics of [Oiii]-selected objects at .
Moorwood et al. (2000) detected five [Oiii] emitters at redshift 3.1 in a 18.9 arcmin2 field with flux greater than erg cm-2 s-1, consistent with the statistics of 1 object in 3 arcmin2 found by Teplitz et al. (1999). Including the radio galaxy, we detect 13 candidate [Oiii] emitters in this field, and we have obtained redshifts for 7 of these. Four objects had previously determined redshifts based on Ly, and are among the protocluster galaxies at . The remaining three objects were spectroscopically identified as galaxies at , and have colours consistent with Lyman break galaxies (objects #2 and #4 in Table 1) and red galaxies (#5). It thus seems likely that the remaining [Oiii] emitters also have redshifts . If we constrain our sample to the same limiting depth as obtained by Moorwood et al. (2000), and take into account that our field area is 3.5 times smaller, we obtain a local density in the [Oiii] field of 3.5 x the field density and finally, according eq. 21 in Venemans et al. (2005), a galaxy overdensity of 2.5. If the [Oiii] emitting galaxies are a subset of the general population of star-forming galaxies at , their distribution can be expected not to be random, but relatively strongly clustered both in real space and in velocity space (e.g. Ouchi et al. 2004, Monaco et al. 2005, Lee et al. 2006). This makes it difficult to assess the statistical significance of the apparent enhancement in the observed number density of [Oiii] emission line galaxies, without additional observations or a detailed comparison with simulations. Nevertheless, the observed space density of [Oiii] galaxies is consistent with the the overdensity of 2.3 derived for Ly galaxies in the MRC 0316-257 protocluster by Venemans et al. 2005).
It is interesting to note that the three newly obtained redshifts all
have , compared with for the Ly protocluster.
These [Oiii] emitters appear therefore to be
blueshifted by 2100 km s-1 relative to the radio galaxy and its
associated protocluster of Ly emitters. It is unclear whether this
apparent shift truly reflects the distribution of the [Oiii] emitters
in this field, or whether it is due to small-number statistics
resulting from the % incompleteness of our spectroscopic
follow-up.
It is unlikely that the [Oiii] lines are systematically shifted with respect to the Ly line, as the shift of 2100 kms-1 is larger than the typical 600 kms-1 shift that one would expect.
The [Oiii] filter covers a larger redshift range than the Ly filter, extending to lower redshifts.
It is possible that another structure exists at z3.10 which is not detected through Ly emitters due to the limited range of the Ly filter.
The formal, co-moving distance between and
is Mpc. Simulations of structure
formation show that protoclusters originate from gravitationally
collapsing regions as large as 20–40 Mpc at high redshift
(e.g. Suwa et al. 2006), and proto-cluster regions having sizes as
large as these have been found in a number of cases (e.g. Campos et al., 1999; Shimasaku
et al., 2003; Hayashino et al., 2004; Intema
et al., 2006).
It is possible that the [Oiii] emitters at
trace a sub-cluster that will eventually merge with the
”radio galaxy” protocluster at .
Alternatively, the numbers of
galaxies in the vicinity of overdense regions may be significantly
enhanced relative to the general field due to an additional bias
associated with the larger walls or filaments in which proto-clusters
form. Such structures may have sizes of up to 100 Mpc on a
co-moving scale.
4.2 Ionisation of [Oiii] Emission
[Oiii] emission is commonly observed in the spectra of both star-forming and active galaxies. It is therefore interesting to consider whether the emission from our [Oiii] excess galaxies at is purely due to star-forming galaxies or whether there are contributions to their ionisation by AGN. The comparision of the [Oiii] and UV continuum emission, and the morphology of the galaxies provide several interesting clues as to the origin of the [Oiii] emission. At low redshift the UV and optical continuum of star–forming galaxies containing an AGN is dominated by the stellar light (Kauffmann et al., 2003), while the emission lines are excited by both the AGN and the young stars. Therefore objects for whose SFRs derived from [Oiii] emission are larger than those measured from their UV continua are likely to contain AGN that contribute to the ionisation of the O+ gas.
The SFRs derived from the [Oiii] luminosities are comparable to the SFRs derived from the UV continua for approximately half of the [Oiii] emitters. These [Oiii] galaxies all have clumpy morphologies in the ACS images and their [Oiii] emission is likely to be ionised by hot young stars. The radio galaxy and ID 8 have very extended clumpy structures that are suggestive of possible mergers or tidal streams. Five [Oiii] galaxies have [Oiii] fluxes that are formally larger by a factor 7 compared with the fluxes expected from their UV-derived SFRs, indicating that these galaxies harbour a hidden AGN. All five of these galaxies have compact core–dominated morphologies and ID 2 has a nearby companion galaxy. However, the uncertainties in the conversion between [Oiii] fluxes and SFR are large (factor of 3–4) and only in the cases of ID 2 and 6 are the enhanced [Oiii] luminosities significiant by greater than . If those two candidates are confirmed, the AGN fraction in this small field would be 14 % of the total number of [Oiii] emitters compared with 5–10 % for the AGN overdensity in Ly emitting galaxies in protoclusters at 2–4 (Pentericci et al., 2002; Croft et al., 2005) and 3–5 % for the AGN fraction in LBGs at 3 (Ouchi et al., 2007). Although the larger fraction of AGN in our [Oiii] small sample is only marginally significant, we note that this would be consistent with the fact that [Oiii] selection is known to be an efficient technique for finding low-luminosity AGN (type 2 Seyfert galaxies) in the optical (Zakamska et al., 2004). The conversion between SFR and [Oiii] luminosity is too uncertain to be able to make any strong conclusions as to the nature of the remaining 3 galaxies which have a larger [Oiii] luminosity than can be explained by star formation given their UV SFRs. We conclude that the [Oiii] galaxies detected at are ionized by a mixture of young stars and AGN.
5 Conclusions and future work
Searching for [Oiii]–emitting galaxies is a new feasible method for detecting protocluster members. We have detected a new population of [Oiii] emitting galaxies in the neighbourhood of the radio galaxy MRC 0316-257 at =3.13. About half of the [Oiii] candidates emitters are LBGs and a third were also previously detected by the Ly selection technique. The [Oiii] technique complements narrow-band searches using Ly and H emission, and observations of the Lyman and Balmer breaks, for finding members of protoclusters. All of these different galaxy selection techniques are needed to study the different galaxy populations and to obtain a complete understanding of protocluster evolution. 13 candidate [Oiii] emitters were detected, including the radio galaxy, and 8 of these were spectroscopically confirmed. Three [Oiii] emitting galaxies lie in a small redshift interval at , which is blushifted by 2100 with respect to the overdensity of Ly emitting galaxies associated with the protocluster structure surrounding the radio galaxy. These three [Oiii] emitters may trace a substructure that lies in front of the previously known 0316-257 protocluster. Further narrow-band imaging and spectroscopy of this field are necessary to establish the existence of such a structure. A possible explanation for the [Oiii]–Ly redshift separation are the difference in the filter band pass together with the existence of a possible big supersructure around the radio galaxy. The observed space density of [Oiii] galaxies is consistent with the overdensity of 3.3 derived for Ly galaxies in the MRC 0316-257 protocluster by Venemans et al. (2005) The detected [Oiii] candidate emitters exhibit a wide range of morphologies. About half have compact structures with an unresolved core on the HST ACS image. All three spectroscopically confirmed [Oiii] emitters are compact. The median size of these objects is typically , which at the average redshift correspond to kpc. The remaining sources are clumpy, consistent with merging or interacting systems. Using the next generation of wide-field infrared imagers and spectrographs, it will be possible to increase the number of high-z detected [Oiii] emitters in the MRC 0316-257 by an order of magnitude and carry out comprehensive infrared studies of several protoclusters at high redshift. Not only will such observations result in greatly improved statistics, but they will also facilitate detailed mapping of the cosmic web at high redshifts.
Acknowledgments
This research is based on observations made with the VLT at ESO Paranal with program numbers 077.A-0310(A,B) and 078.A-0002(A,B), and on observations made with the NASA/ESA Hubble Space Telescope, obtained from the data archive at the Space Telescope Science Institute. STScI is operated by the Association of Universities for Research in Astronomy, Inc. under NASA contract NAS 5-26555. NAH and GKM acknowledge funding from the Royal Netherlands Academy of Arts and Sciences.
References
- Bertin & Arnouts (1996) Bertin E., Arnouts S., 1996, A&AS, 117, 393
- Blakeslee et al. (2003) Blakeslee J. P., Anderson K. R., Meurer G. R., Benítez N., Magee D., 2003, in Payne H. E., Jedrzejewski R. I., Hook R. N., eds, Astronomical Data Analysis Software and Systems XII Vol. 295 of Astronomical Society of the Pacific Conference Series, An Automatic Image Reduction Pipeline for the Advanced Camera for Surveys. pp 257–+
- Bouwens et al. (2004) Bouwens R. J., Illingworth G. D., Blakeslee J. P., Broadhurst T. J., Franx M., 2004, ApJ, 611, L1
- Calzetti et al. (2000) Calzetti D., Armus L., Bohlin R. C., Kinney A. L., Koornneef J., Storchi-Bergmann T., 2000, ApJ, 533, 682
- Calzetti & Heckman (1999) Calzetti D., Heckman T. M., 1999, ApJ, 519, 27
- Campos et al. (1999) Campos A., Yahil A., Windhorst R. A., Richards E. A., Pascarelle S., Impey C., Petry C., 1999, ApJ, 511, L1
- Croft et al. (2005) Croft S., Kurk J., van Breugel W., Stanford S. A., de Vries W., Pentericci L., Röttgering H., 2005, AJ, 130, 867
- De Breuck & Reuland (2005) De Breuck C., Reuland M., 2005, in Renzini A., Bender R., eds, Multiwavelength Mapping of Galaxy Formation and Evolution Star Formation in High Redshift Radio Galaxies. pp 374–+
- Elmegreen (2007) Elmegreen D. M., 2007, in Combes F., Palous J., eds, IAU Symposium Vol. 235 of IAU Symposium, Clumpy Galaxies in the Early Universe. pp 376–380
- Ferguson et al. (2004) Ferguson H. C., Dickinson M., Giavalisco M., Kretchmer C., Ravindranath S., Idzi R., Taylor E., Conselice C. J., 2004, ApJ, 600, L107
- Ford et al. (1998) Ford H. C., Bartko F., Bely P. Y., Broadhurst T., Burrows C. J., Cheng E. S., Clampin M., Crocker J. H., Feldman P. D., Golimowski D. A., Hartig G. F., Illingworth G., Kimble R. A., 1998, in Bely P. Y., Breckinridge J. B., eds, Proc. SPIE Vol. 3356, p. 234-248, Space Telescopes and Instruments V, Pierre Y. Bely; James B. Breckinridge; Eds. Vol. 3356 of Presented at the Society of Photo-Optical Instrumentation Engineers (SPIE) Conference, Advanced camera for the Hubble Space Telescope. pp 234–248
- Giavalisco et al. (1996) Giavalisco M., Livio M., Bohlin R. C., Macchetto F. D., Stecher T. P., 1996, AJ, 112, 369
- Hatch et al. (2008) Hatch N. A., Overzier R. A., Röttgering H. J. A., Kurk J. D., Miley G. K., 2008, MNRAS, 383, 931
- Hawarden et al. (2001) Hawarden T. G., Leggett S. K., Letawsky M. B., Ballantyne D. R., Casali M. M., 2001, MNRAS, 325, 563
- Hayashino et al. (2004) Hayashino T., Matsuda Y., Tamura H., Yamauchi R., Yamada T., Ajiki M., 2004, AJ, 128, 2073
- Intema et al. (2006) Intema H. T., Venemans B. P., Kurk J. D., Ouchi M., Kodama T., Röttgering H. J. A., Miley G. K., Overzier R. A., 2006, A&A, 456, 433
- Kauffmann et al. (2003) Kauffmann G., Heckman T. M., Tremonti C., Brinchmann J., Charlot S., White S. D. M., Ridgway S. E., Brinkmann J., Fukugita M., Hall P. B., Ivezić Ž., Richards G. T., Schneider D. P., 2003, MNRAS, 346, 1055
- Kennicutt (1998) Kennicutt R., 1998, in Kaldeich B., ed., LIA Colloq. 34: The Next Generation Space Telescope: Science Drivers and Technological Challenges Vol. 429 of ESA Special Publication, Emission-Line Diagnostics of Galaxy Evolution with NGST. pp 81–+
- Kennicutt (1992) Kennicutt Jr. R. C., 1992, ApJ, 388, 310
- Kong et al. (2004) Kong X., Charlot S., Brinchmann J., Fall S. M., 2004, MNRAS, 349, 769
- Kurk et al. (2004) Kurk J., Venemans B., Röttgering H., Miley G., Pentericci L., 2004, in Plionis M., ed., Astrophysics and Space Science Library Vol. 301 of Astrophysics and Space Science Library, Proto-clusters Associated with Radio Galaxies from z=2 to z=4. pp 141–+
- Large et al. (1981) Large M. I., Mills B. Y., Little A. G., Crawford D. F., Sutton J. M., 1981, MNRAS, 194, 693
- Le Fevre et al. (1996) Le Fevre O., Deltorn J. M., Crampton D., Dickinson M., 1996, ApJ, 471, L11+
- Lotz et al. (2004) Lotz J. M., Madau P., Giavalisco M., Primack J., 2004, in Bulletin of the American Astronomical Society Vol. 36 of Bulletin of the American Astronomical Society, Comparing the Rest-Frame FUV Morphologies of of Star-Forming Galaxies at z ~ 1.5 and z ~ 4. pp 1615–+
- Lotz et al. (2006) Lotz J. M., Madau P., Giavalisco M., Primack J., Ferguson H. C., 2006, ApJ, 636, 592
- Madau et al. (1998) Madau P., Pozzetti L., Dickinson M., 1998, ApJ, 498, 106
- McCarthy et al. (1990) McCarthy P. J., Kapahi V. K., van Breugel W., Subrahmanya C. R., 1990, AJ, 100, 1014
- Meurer et al. (1995) Meurer G. R., Heckman T. M., Leitherer C., Kinney A., Robert C., Garnett D. R., 1995, AJ, 110, 2665
- Miley et al. (2006) Miley G. K., Overzier R. A., Zirm A. W., Ford H. C., Kurk J., Pentericci L., Blakeslee J. P., Franx M., Illingworth G. D., Postman M., Rosati P., Röttgering H. J. A., Venemans B. P., Helder E., 2006, ApJ, 650, L29
- Moorwood et al. (1999) Moorwood A., Cuby J.-G., Ballester P., Biereichel P., Brynnel J., Conzelmann R., Delabre B., Devillard N., 1999, The Messenger, 95, 1
- Moorwood et al. (1998) Moorwood A., Cuby J.-G., Biereichel P., Brynnel J., Delabre B., Devillard N., van Dijsseldonk A., 1998, The Messenger, 94, 7
- Moorwood et al. (2000) Moorwood A. F. M., van der Werf P. P., Cuby J. G., Oliva E., 2000, A&A, 362, 9
- Moustakas et al. (2006) Moustakas J., Kennicutt Jr. R. C., Tremonti C. A., 2006, ApJ, 642, 775
- Mullis et al. (2005) Mullis C. R., Rosati P., Lamer G., Böhringer H., Schwope A., Schuecker P., Fassbender R., 2005, ApJ, 623, L85
- Oke (1974) Oke J. B., 1974, in Reiz A., ed., Research Programmes for the New Large Telescopes Current research programmes at the Hale Observatories. pp 29–34
- Ouchi et al. (2007) Ouchi M., Shimasaku K., Akiyama M., Simpson C., Saito T., Ueda Y., Furusawa H., Sekiguchi K., Yamada T., Kodama T., Kashikawa N., Okamura S., Iye M., Takata T., Yoshida M., Yoshida M., 2007, ArXiv e-prints, 707
- Overzier et al. (2008) Overzier R. A., Bouwens R. J., Cross N. J. G., Venemans B. P., Miley G. K., Zirm A. W., Benítez N., 2008, ApJ, 673, 143
- Overzier et al. (2007) Overzier R. A., Heckman T. M., Kauffmann G., Seibert M., Rich R. M., Basu-Zych A., Lotz J., Aloisi A., Charlot S., Hoopes C., Martin D. C., Schiminovich D., 2007, ArXiv e-prints, 709
- Overzier et al. (2006) Overzier R. A., Miley G. K., Bouwens R. J., Cross N. J. G., Zirm A. W., Benítez N., Blakeslee J. P., Clampin M., Demarco R., Ford H. C., Hartig G. F., Illingworth G. D., 2006, ApJ, 637, 58
- Pentericci et al. (2002) Pentericci L., Kurk J. D., Carilli C. L., Harris D. E., Miley G. K., Röttgering H. J. A., 2002, A&A, 396, 109
- Pentericci et al. (1999) Pentericci L., Röttgering H. J. A., Miley G. K., McCarthy P., Spinrad H., van Breugel W. J. M., Macchetto F., 1999, A&A, 341, 329
- Persson et al. (1998) Persson S. E., Murphy D. C., Krzeminski W., Roth M., Rieke M. J., 1998, AJ, 116, 2475
- Seymour et al. (2007) Seymour N., Stern D., De Breuck C., Vernet J., Rettura A., Dickinson M., Dey A., Eisenhardt P., Fosbury R., Lacy M., McCarthy P., Miley G., Rocca-Volmerange B., Röttgering H., 2007, ApJS, 171, 353
- Shimasaku et al. (2003) Shimasaku K., Ouchi M., Okamura S., Kashikawa N., Doi M., Furusawa H., Hamabe M., Hayashino T., Kawabata K., Kimura M., 2003, ApJ, 586, L111
- Spergel et al. (2003) Spergel D. N., Verde L., Peiris H. V., Komatsu E., Nolta M. R., Bennett C. L., Halpern M., Hinshaw G., Jarosik N., Kogut A., Limon M., Meyer S. S., Page L., Tucker G. S., Weiland J. L., Wollack E., Wright E. L., 2003, ApJS, 148, 175
- Stanford et al. (2005) Stanford S. A., Eisenhardt P. R., Brodwin M., Gonzalez A. H., Stern D., Jannuzi B. T., Dey A., Brown M. J. I., McKenzie E., Elston R., 2005, ApJ, 634, L129
- Teplitz et al. (2000) Teplitz H. I., Malkan M. A., Steidel C. C., McLean I. S., Becklin E. E., Figer D. F., Gilbert A. M., Graham J. R., Larkin J. E., Levenson N. A., Wilcox M. K., 2000, ApJ, 542, 18
- Venemans et al. (2005) Venemans B. P., Röttgering H. J. A., Miley G. K., Kurk J. D., De Breuck C., Overzier R. A., van Breugel W. J. M., Carilli C. L., Ford H., Heckman T., Pentericci L., McCarthy P., 2005, A&A, 431, 793
- Venemans et al. (2007) Venemans B. P., Röttgering H. J. A., Miley G. K., van Breugel W. J. M., de Breuck C., Kurk J. D., Pentericci L., Stanford S. A., Overzier R. A., Croft S., Ford H., 2007, A&A, 461, 823
- Vernet et al. (2001) Vernet J., Fosbury R. A. E., Villar-Martín M., Cohen M. H., Cimatti A., di Serego Alighieri S., Goodrich R. W., 2001, A&A, 366, 7
- Villar-Martín et al. (2006) Villar-Martín M., Sánchez S. F., De Breuck C., Peletier R., Vernet J., Rettura A., Seymour N., Humphrey A., Stern D., di Serego Alighieri S., Fosbury R., 2006, MNRAS, 366, L1
- Younger et al. (2007) Younger J. D., Huang J.-S., Fazio G. G., Cox T. J., Lai K., Hopkins P. F., Hernquist L., Papovich C. J., Simard L., Lin L., Cheng Y.-W., Yan H., Keres D., Shapley A. E., 2007, ArXiv e-prints, 708
- Zakamska et al. (2004) Zakamska N. L., Strauss M. A., Ivezic Z., Schmidt G. D., 2004, in Bulletin of the American Astronomical Society Vol. 36 of Bulletin of the American Astronomical Society, The multi-wavelength properties of type II quasars. pp 678–+
- Zirm et al. (2005) Zirm A. W., Overzier R. A., Miley G. K., Blakeslee J. P., Clampin M., De Breuck C., Demarco R., Ford H. C., Hartig G. F., Homeier N., 2005, ApJ, 630, 68