Thermal Analysis of the Pioneer Anomaly:
A method to estimate radiative momentum transfer
Abstract
We present a methodology based on point-like Lambertian sources that enables one to perform a reliable and comprehensive estimate of the overall thermally induced acceleration of the Pioneer 10 and 11 spacecraft. We show, by developing a sensitivity analysis of the several parameters of the model, that one may achieve a valuable insight on the possible thermal origin of the so-called Pioneer anomaly.
pacs:
07.87.+v, 24.10.Pa, 44.40.+a Preprint DF/IST-6.2008I Introduction
I.1 General Background
The existence of an anomalous acceleration on the Pioneer 10 and 11 spacecrafts, sun-bound and with a magnitude of has been put forward a decade ago, using two independent code analyses JPL ; Mark . Attempts to account for these phenomena as a result of a misestimation of the systematic effects of thermal nature were first considered in Ref. Katz ; Lou . Possible additional contributions, ranging from electric or magnetic forces, to mechanical effects or errors in the Doppler tracking algorithms used, have all be shown to be unsuccessful.
Although initially dismissed, a much touted hypothesis for a physical explanation of the effect lies in the reaction force due to thermal radiation arising from the main bus compartment and the radiothermal generators (RTGs), either directly pointing away from the sun, or reflected by the main antenna dish. Clearly, an acceleration arising from the thermal dissipation should present a similar secular trend as the RTGs available power decay; regarding this point, one must note that another analysis has shown that such a signature in the anomaly may be found (i.e., it also possesses statistical significance), characterized by a linear decay with a time constant larger than 50 years Mark : given the years half-life of the plutonium source in the radio-thermal generators, which should be somewhat lowered due to degradation of the thermal coupling, this still leaves room for thermal radiation to account for the Pioneer anomaly. The latter is being thoroughly examined by groups within the Pioneer collaboration team team ; Toth .
In what concerns other effects, one can safely disregard electromagnetic forces, solar radiation and solar wind pressure as the cause for the anomalous acceleration JPL . Other sources for anomalous effects have been discarded, including the possibility that the Kuiper Belt’s gravitational pull may give rise to the reported acceleration; this would require an abnormally high mass for this extended object, about two order of magnitude higher than the commonly accepted value of JPL ; Vieira ; Nietokuiper (for a variety of mass distribution models Vieira ).
The two Pioneer probes are following approximately opposite hyperbolic trajectories away from the Solar System. The fact that the same anomaly was found indicates a common origin to both spacecraft. This prompts for an intriguing question: what is the fundamental, and possibly new, physics behind this anomaly?
Many proposals have been advanced to explain the anomaly as a previously undiscovered effect of new physics (see Ref. Paramos and references therein, and also Refs. Reynaud ; Moffat ; Lobo ). However, before one seriously considers the possibility for new physics, an unambiguous description of the anomaly should be given. Unfortunately, the distances at which the originally available Doppler measurements were conducted do not allow for a clear discrimination of the direction of the acceleration: in particular, it is still not possible to discern between an acceleration towards the sun or the Earth, along the line of sight. Ascertaining this would provide a relevant insight concerning the origin of the anomaly: a line of action pointing towards the sun would indicate a gravitational origin (since solar radiation pressure is manifestly too low to account for the effect), while a Earth-bound anomaly would hint at either a modified Doppler effect (due to new physics affecting light propagation and causing an effective blue shift) or an incorrect modeling of Doppler data, possibly due to mismodeled Earth orientation parameters, incorrect ephemerides estimates, Deep Space Network (DSN) and software clock drifts, i.e., an unaccounted systematic effect. An intriguing possibility could be a “congenital” relationship between the Pioneer anomaly and the so-called flyby anomaly flyby . The anomalous acceleration may also lie along the spin axis of the spacecraft: this would indicate that onboard, underestimated systematic effects to be held responsible for it; finally, an anomaly along the velocity vector would hint at some sort of drag effect.
Regarding the latter, it is worth stating that this additional drag does not seem to be due to dark matter or dust distribution, since these are currently known to a good accuracy, and yield much lower effects. Conversely, one may ask what density should the environment have, so that a dependent drag force would account for the anomaly: a straightforward calculation shows that this should be of order (see, e.g., Ref. Vieira ); for comparison, the density of interplanetary dust, arising from hot-wind plasma Kimura , is below ; the density of interstellar dust (directly measured by the Ulysses spacecraft) is even smaller, at about . Also, a modification of geodetical motion, hinting at an extension of General Relativity, could also account for a velocity dependent anomalous acceleration (see, e.g., Ref. zacuto for a detailed discussion).
Furthermore, it is clear that a careful study of secular and spatial trends should be carried out, aiming to relate with possible thermal or engineering causes for the anomalous acceleration. The previously available data is likely to refer to an insufficiently long mission timespan, which does not allow for a clear discrimination of a hypothetical variation of the anomaly; to overcome this difficulty, recently recovered data of the full mission is being analyzed by distinct groups within the Pioneer collaboration team, with several approaches aiming to obtain convergent answers to the above questions (see e.g. Ref. Agnes ).
Although initially disregarded, the issue of the Pioneer anomaly has grown in and number of peer-reviewed publications, reflecting the increasing concern of the physics community. The characterization of any additional anomalous acceleration was part of the scientific objectives of several mission proposals put forward to the recent ESA Cosmic Vision 2015-2025 programme zacuto ; missions ; unfortunately, these efforts were ill-fated, leaving the community without the means to get a direct answer to this intriguing enigma.
I.2 Previous Work
| Item | Description of error budget constituents | Bias | Uncertainty |
|---|---|---|---|
| 1 | Systematics generated external to the spacecraft: | ||
| a) Solar radiation pressure and mass | |||
| b) Solar wind | |||
| c) Solar corona | |||
| d) Electro-magnetic Lorentz forces | |||
| e) Influence of the Kuiper belt’s gravity | |||
| f) Influence of the Earth orientation | |||
| g) Mechanical and phase stability of DSN antennae | |||
| h) Phase stability and clocks | |||
| i) DSN station location | |||
| j) Troposphere and ionosphere | |||
| 2 | On-board generated systematics: | ||
| a) Radio beam reaction force | |||
| b) RTG heat reflected off the craft | |||
| c) Differential emissivity of the RTGs | |||
| d) Non-isotropic radiative cooling of the spacecraft | |||
| e) Expelled Helium produced within the RTGs | |||
| f) Gas leakage | |||
| g) Variation between spacecraft determinations | |||
| 3 | Computational systematics: | ||
| a) Numerical stability of least-squares estimation | |||
| b) Accuracy of consistency/model tests | |||
| c) Mismodeling of maneuvers | |||
| d) Mismodeling of the solar corona | |||
| e) Annual/diurnal terms | |||
| Estimate of total bias/error |
A clear assessment of several systematic contributions to the overall acceleration may be found on Table 1, extracted from Ref. JPL . These baseline figures give a good measure of the different orders of magnitude of the various effects involved, and show that they do not account for the reported anomaly. As it turns out, unaccounted thermal effects are the most conspicuous sources of a systematic effect. In Refs. Katz ; Lou , estimates were performed for the heat dissipation of several spacecraft components, and claimed that a combination of several sources could account for the anomalous acceleration. In order to ascertain or disprove these and other claims, a more recent and thorough study has carried out the convoluted task of carefully modeling the Pioneer probes, in order to reproduce all relevant thermal effects with a sufficient accuracy Toth ; a similar, independent effort is being undertaken by other groups within the Pioneer collaboration team.
Although still preliminary, these attempts seem to indicate that thermal effects may account for up to one third of the total magnitude of the reported anomaly Slava . As we shall see this result is consistent with our own estimates which indicate that thermal effects can account from about 35% to 67% of the anomalous acceleration. However, it is the authors’ opinion that the many parameter estimation and modeling strategies available up to now somehow cloud the overall picture, with the physical significance being hindered by the technical depth of the thermal behavior reconstitution. For this reason, the present work attempts to drift somewhat away from the full modeling of every engineering detail, and directs its attention to the physical basis of the aforementioned thermal behavior. This stated, it is clear that our approach is a complementary tool to the current endeavors: indeed, while a poorer modeling of specific details will reduce the overall confidence of the obtained results, the added simplicity, computational clarity and speed allow for a convenient and much needed sensitivity analysis of the several relevant parameters.
In this paper, we present the main features and the first results of a method based on point-like Lambertian sources. As we shall see, the presented method is already compatible with previous studies; further developments shall focus on a more detailed analysis of the reflectivity effects, while still aiming at a good balance of model simplicity, computational speed and physical realism.
II Source Distribution Method
II.1 Motivation and Rationale
As discussed in the previous section, no definitive statements about the origin of the anomaly can be put forward until its full characterization. This justifies an intensive effort to recover and analyze the full flight data, and to develop approaches to understand the overall thermal behavior of the Pioneer probes, so to measure any previously unaccounted thermal radiation effects and to isolate, rule out, or constrain possibly remaining, yet unknown, effects.
However, the authors feel that this pursuit should be countered with an approach focusing on the physical effects directly relevant to the understanding of the problem. The central issue is how thermal radiation is emitted, and reabsorbed and/or reflected, by the external surfaces of the spacecraft and what is the resultant reaction force. Hence, instead of a complex finite elements model, that requires modeling of the whole spacecraft, we propose to develop a faster, more versatile approach based on a distribution of a few point-like thermal sources, simulating the thermal radiation emitted from the spacecraft, and analyzing the effect of radiation when emitted directly to space or when reflected or absorbed by another surface of the spacecraft. This approach is complementary to the ones based on finite element analyses and does not focus on the inner behavior of each component or surface, but instead attempt to isolate different contributions from the major constituents of the vehicles, namely the RTGs, antenna dish, and main bus compartment.
There are several arguments justifying the interest and the effectiveness of the present approach. It is impossible to model the Pioneer spacecraft in a very precise way: it was built decades ago, accuracy of the blueprints or existing models is limited and the precise properties and degradation or damage of the materials, after decades in space, is unknown. This implies that even in the case of a full model of the spacecraft educated guesses will have to be done, limiting the accuracy of the obtained results.
The impossibility of reliably describing several key parameters should also limit the accuracy of any conclusions derived from a more encompassing approach. Specifically, the limited temperature data (provided only by six sensors on the main bus and two sensors on the RTGs) and poor knowledge of the optical properties of the materials introduce substantial uncertainties in the final result, whatever is the adopted strategy. Thus, it is clear that the total and electrical power, which are well known, must be the fundamental parameters for any analysis. As will be shown, our approach is based on this principle.
Moreover, thermal radiation possibly contributing to the anomalous acceleration depends on the external surfaces of the spacecraft and how the total power (and temperature profile) is distributed among them. The insulation of the spacecraft walls should limit the gradient of the temperature along each of the main external surfaces (except in special places as, e.g., the louvers, that can be modeled as separate sources if required) and make all the modeling of the details of the compartment unessential to address the problem. We argue that small details and small gradients in temperature of the spacecraft external surfaces will not affect the results considerably since, as we will see, the results are not too much affected by the number of point-like sources representing an extended surface (keeping the power constant). A small number of point-like sources can then be used to simulate any foreseen temperature gradient along each surface or a small localized extra source of radiation. From the thermal radiation point of view this is similar to a unevenly distribution of power by the few point-like sources representing the surface. Sensitivity analysis regarding the details of the spacecraft: shape modeling, temperature gradients, and total power emitted by each surface, can be then performed by varying the power assigned to each individual source in a prescribed way.
The Pioneer spacecraft is spin stabilized and any reaction force component due to radiation will cancel away over time except in the direction of the axis of rotation. Most of the small contributions possibly not taken into account should be irrelevant since, due to the geometry of the spacecraft, most of them are expected to be normal to the axis of rotation. This effect can be verified through the sensitivity analysis if slightly different radiation distributions by the sources lead to similar values of the anomalous acceleration, as expected. It should be noted that, as we are modeling relatively large radiating surfaces as point-like sources, the present model cannot provide too reliable information about the total reaction torque induced by the thermal radiation into the spacecraft.
It is clear that any study of this scope necessarily involves a large number of assumptions and hypotheses. Therefore, it is important to have the ability to quickly test a wide variety of scenarios and reach unambiguous conclusions about their plausibility: this sensitivity analysis is crucially facilitated by the short computation time of the present method. In addition, the simplicity of the formulation keeps the involved physics visible throughout the entire process, allowing for scrutiny of every step. Finally, we emphasize that the key goal of our effort is to perform a wide spectrum study of the parameter space for several physical properties relevant to the thermal modeling of the Pioneer probes. Our approach, while less comprehensive than a finite element model, allows for a direct interpretation of results, easy adaptability, as well as rather short computation times.
Obviously, this endeavor would be incomplete if its self-consistency could not be assessed. Thus, before tackling the more interesting, physical case of the Pioneer anomaly, a set of test cases is performed to ascertain the effectiveness of the method. Furthermore, the choice for a point-like source approach should also be verified; this may be achieved by increasing the number of sources and observing the convergence of the relevant quantities and results. If deemed satisfactory, one may safely assume that continuous surfaces and components can be suitably modeled by point-like sources, so to still reproduce the physical interplay between them, and hence allow for an extrapolation to the Pioneer vehicles.
II.2 Physical Formulation
Our method is based on a distribution of isotropic and Lambertian point-like sources. If is the emitted power, the time-averaged Poynting vector-field for an isotropic source located at is given by
| (1) |
In the case of a Lambertian source the intensity of the radiation is proportional to the cosine of the angle with the normal
| (2) |
Typically, one uses isotropic sources to model point-like emitters and Lambertian sources to model surfaces. The Poynting vector field of the source distribution is, then, integrated over the surfaces in order to obtain the amount of energy illuminating these, and the force produced. The former is given by the time-averaged Poynting vector flux
where the function parameterizes the relevant surface. The radiation illuminating the surface will produce a perpendicular force; integrating this force, i.e., the radiation pressure multiplied by the unitary normal vector, will give us the total force acting upon the corresponding surface. The radiation pressure is thus given by
| (4) |
taking into account a radiation pressure coefficient . The case corresponds to full absorption while indicates full diffusive reflection.
There will also be a force acting on the source of the radiation; this can be obtained by integrating the radiation pressure multiplied by a normalized radial vector field along a generic surface
| (5) |
If the object in study has a reasonably complex geometry (such as the Pioneer spacecraft) there will be shadows cast by the surfaces that absorb and reflect the radiation. The shadowing effect of the illuminated surfaces is calculated with this same expression and then subtracted to the force obtained for the emitting surface. Alternatively, one may use an integration surface that encompasses the illuminated surfaces. The total result is the sum of all effects — force on the emitting surface, shadows and radiation pressure on the illuminated surfaces .
II.3 Test Cases
In order to demonstrate the efficiency of the proposed method, we define a set of test cases to assess the quality of our approximation. The key point is the ability to adequately represent the thermal radiation emitted from an extended surface by a small number of point-like sources, as opposed to having many small thermal radiating elements.
In the performed test cases, a square emitting surface with is considered. The three components of the force are then computed: force on the emitting surface, shadow caused by another surface at a given position, and radiation pressure on the surface. We compare the results for different numbers of sources, while maintaining the total power fixed. It is expected that the result converges to the exact solution as the number of radiation sources increases. Our study shows that one is able to get a reliable error estimate even when using a small number of sources to model a surface.
For a surface emitting radiation that does not illuminate other surfaces, one finds that the force is perpendicular to the former and only depends on the total emitted power. Using Eq. (5) with Lambertian sources on a surface on the plane, one obtains a force in the -axis direction, of magnitude .
Computation of the shadow and pressure radiation on other surfaces yields results that are not independent from the source distribution. In order to acquire some sensibility on that dependence, we plot the variation of the radiation intensity with the elevation and the azimuth for 1, 4, 16, 64 and 144 source meshes, as depicted in Figs. 1 and 2.
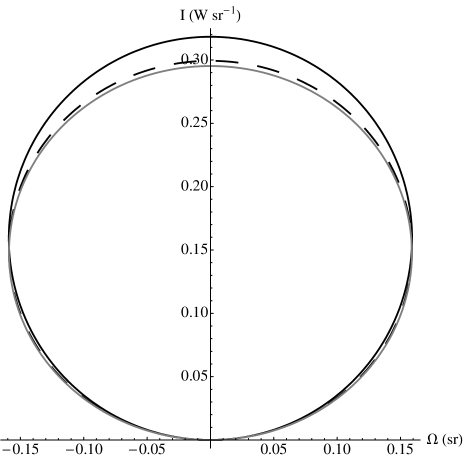
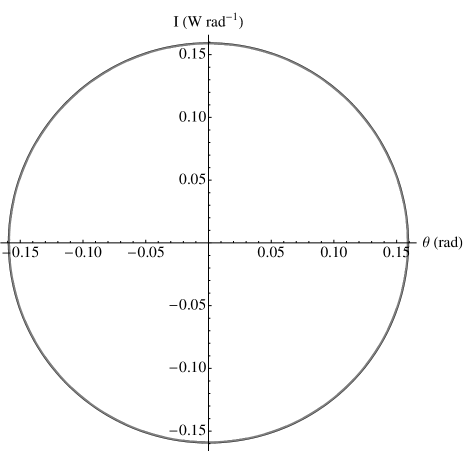
A visual inspection of the results indicate that, even for one source, the maximum deviation occurs at the higher angles of elevation and is less than 10%. For the relevant angles for the Pioneer spacecraft configuration, deviations will be considerably smaller. In order to confirm this estimate, the force acting on a second surface for several different positions is computed. A total of nine representative configurations were considered, with different positions and tilt angles, as summarized in Table 2. The deviation between the 1, 4, 16, 64 and 144 source meshes is then verified.
| Test case | Surface center position | Surface tilt angle |
|---|---|---|
| # | () | (∘) |
| (, , ) | ||
| (, , ) | ||
| (, , ) | ||
| (, , ) | ||
| (, , ) | ||
| (, , ) | ||
| (, , ) | ||
| (, , ) | ||
| (, , ) |
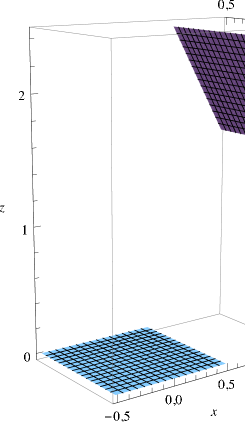
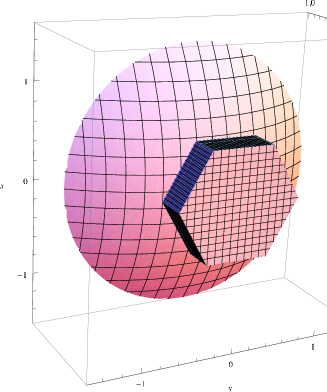
Our study shows that the highest deviation occurs for Test Case 8, which confirms our expectation, since the second surface is set at high elevation from the emitting surface, as depicted in Fig. 3. The results in Table 3 show a difference of approximately 6% between the force obtained with one source and the results for the finer meshes (16, 64 and 144 sources). Nevertheless, the latter are all within 0.5% of each other, and the intermediate 4 source mesh has a deviation of only 1.5%.
| Sources | Energy flux | Force components |
|---|---|---|
| # | () | () |
| (, 0, ) | ||
| (, 0, ) | ||
| (, 0, ) | ||
| (, 0, ) | ||
| (, 0, ) |
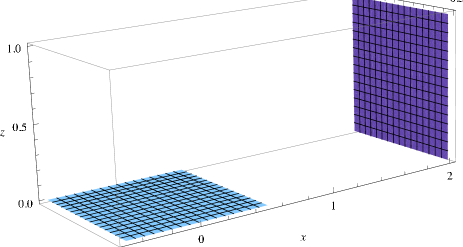
For the typical angles of the Pioneer probe’s configuration, one may take as figure of merit Test Cases 1 and 3. For the first case, depicted in Fig. 4, the radiation pressure and shadow yield the results shown in Table 4. The analysis of these results shows that, for 16, 64 and 144 sources, the variation in the energy flux and force is less than 0.5%. In addition to that, the difference when compared with the results from finer meshes is less than 5% for 1 source and less than 1.5% for a 4 source mesh. The results in Table 5 show, for Test Case 3, a variation of less than 5% between the results for 1 source and 144 sources. The convergence is, as in both previous cases, achieved for the 16, 64 and 144 source meshes, with a variation of less than 0.25%.
| Sources | Energy flux | Force components |
|---|---|---|
| # | () | () |
| (, 0, ) | ||
| (, 0, ) | ||
| (, 0, ) | ||
| (, 0, ) | ||
| (, 0, ) |
| Sources | Energy flux | Force components |
|---|---|---|
| # | () | () |
| (, 0, ) | ||
| (, 0, ) | ||
| (, 0, ) | ||
| (, 0, ) | ||
| (, 0, ) |
For all test cases examined, the convergence of the results occurs at a similar pace and yields, for all cases, similar small deviations. Ultimately, we conclude that a 4 source mesh, with deviations around 1.5%, would be adequate for the desired balance between precision and simplicity. These results provide a fairly good illustration of the power of our method and how well we can estimate the radiation effects on the Pioneer probes. In particular, the deviation is always well below 10%, even with the roughest simplifications allowed by the chosen method. One may then conclude that, for the scales and geometry involved in the Pioneer anomaly problem, the source distribution method is, not only consistent and convergent, but that it provides a very satisfactory estimate of the thermal radiation effects, even considering all uncertainties involved.
Finally, after analysing the convergence of the method, we have also considered two additional test cases to assess the effect of ignoring some surface features, such as the equipment attached to the external walls of the spacecraft. These results indicate that, unless large temperature gradients are present, no significant errors will arise from considering flat surfaces and not taking into account all the details of the spacecraft.
III Thermal Radiation Model of the Pioneer Spacecraft
III.1 Geometry
The problem of modeling the Pioneer spacecraft can be considerably simplified with some sensible hypotheses. The first and most important one rests upon the fact that the probes are spin stabilized. Since it is also assumed that the probe is in a steady-state thermal equilibrium through out most of their journey, the time-averaged radial components of any force generated by anisotropic radiation will be negligible. In addition, the probe’s axis of rotation (taken as the -axis) is approximately pointing towards Earth, which is also the approximate direction of the anomalous acceleration.
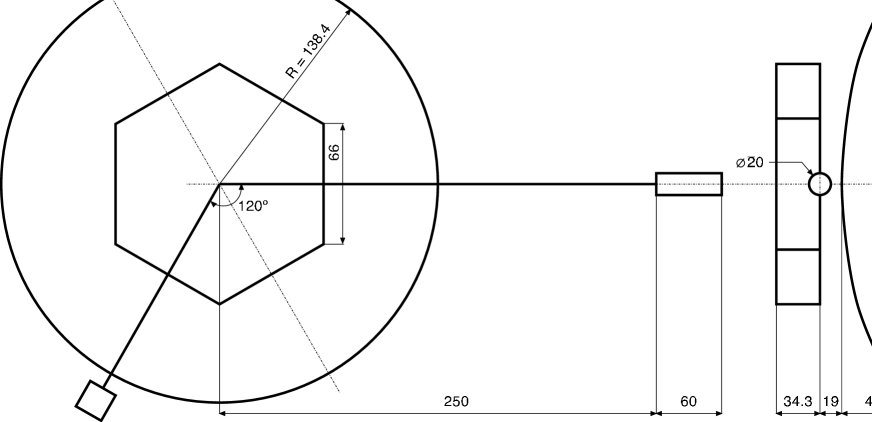
In this study, we consider a simplified version of the spacecraft geometry, which retains only its most important features, as depicted in Figs. 5 and 6. Our model considers the RTGs, a prismatic equipment compartment and the antenna — a paraboloid, parametrized by the function , with a parabolic coefficient (c.f. Eq. (II.2)). Dimensions are taken from the available Pioneer technical drawings. Our results are obtained through the integration of the emissions of the RTG and lateral walls of the equipment compartment along the visible portion of the antenna. Note that radiation emitted from the front surface of the Pioneer cannot be reflected by other surfaces and will be counted as a whole. The surface of the compartment facing the antenna will be discarded for now as its contribution is fairly small for obvious geometric reasons: escaping radiation will be attenuated by multiple reflections between these two components and will be mainly in the radial direction, not contributing significantly to the anomalous acceleration. The antenna itself is expected to have a very low temperature () with an approximately uniform distribution, not only axially, but also considering the front and back surfaces of the paraboloid (as visible in the results from Ref. Slava ); therefore, its contribution can be regarded as negligible, with the surface acting solely as a reflector for the incoming radiation.
As we shall see, this simplified model captures the most important contributions to the thermal reaction force. The RTGs and the main equipment compartment are actually responsible for most of the emitted thermal radiation. In the case of the equipment compartment, the most important contribution is from the louvers located in the front wall (facing away from the sun) with consequences for the total power distribution.
III.2 Point-like Source Distribution
In order to estimate the thermal effects, a separate analysis of the three main contributions must be performed. The front wall of the probe, where the louvers are located, is perpendicular to the axis of rotation: its contribution corresponds to a force pointing in the sun-ward direction along the probe’s axis. The contribution from the side walls of the main compartment is obtained from the integration of the shadow and radiation pressure components along the antenna. The shadow of the RTGs was neglected since they are small, relatively distant, and most of its effect would be in the radial direction. Following an approach similar to the one used in the test cases, in order to verify the convergence of the result, the integration is performed for an increasing number of sources. The results converge fairly quickly and the deviations are all below 2.5%, confirming the consistency previously demonstrated in our test cases. The obtained values show that between 16.8% to 17.3% of the power emitted from the side walls of the compartment is converted into a sun-ward thrust along the -axis.
It is also important to verify how the results are affected by a non-uniform temperature distribution. This is simulated by varying the relative power of the point-like sources in each surface, keeping the total power attributed to the surface constant. A variation of 20% in power between sources (simulating a 5% temperature variation) gives no significant changes in the final result — with relative differences smaller than 1%.
Finally, the RTG contribution is computed through two different models. The first, simpler scenario, mimics each RTG with a single isotropic source. In this case, the point-like source has the whole power of the RTG. In the second model, the cylindric shape of the RTG is taken into account and a Lambertian source is placed at each base. Actually, it is only necessary to consider the source facing towards the centre of the spacecraft, as the remaining RTG radiation will be emitted radially and its time-averaged contribution vanishes. In this case, the Lambertian source has a certain amount of the total RTG power, as discussed in the following sections. Depending on the model considered, either 1.9% of the total power or 12.7% of the power emitted from the base of the cylinder (equivalent to approx. 2% of total RTG power, if the temperature is uniform) is converted into thrust.
These preliminary results do not take into account diffusive reflection, as allowed by Eq. 4. In the subsequent section, more accurate results will be presented and discussed.
III.3 Available Power
The available power on the Pioneer spacecraft is one of the few measured or inferred parameters that is reasonably well known. In addition, it is physically more consistent to consider the power instead of the temperature readings as it is the independent variable from which all estimates of the resulting thermal effects are derived. Of course, the energy balance to the spacecraft in steady-state conditions relates the temperature of a surface with the power budget of the spacecraft
| (6) |
where are the relevant areas and the emissivity of each surface .
Notice that, since the optical properties of the surfaces, as well as their evolution with time, are not well known, temperature estimates are quite uncertain. Furthermore, as a variation in the emissivity implies the violation of the conservation of energy, a new solution for the temperature must be obtained iteratively for each different set of optical properties used so to maintain the correct power.
All the power generated onboard the probes comes from the two plutonium-238 RTGs. Given that just a fraction of the generated heat is converted into electricity, the remaining power is dissipated as heat. There will be some conduction of this heat through the truss to the central compartment, however, considering the small section of this structure, it is reasonable to admit that it will have a reduced impact on the total RTG radiated power111Assuming the RTGs trusses as hollow cylinders, with radius and a temperature gradient of , one obtains about of dissipated power, which is clearly negligible.. It is, thus, considered that all of the RTG thermal power is dissipated as radiation from the RTG itself.
The electrical power is consumed by the various instruments located in the main compartment, despite a considerable portion of it being used in radio transmissions from the high gain antenna. As mentioned in Ref. JPL , the total RTG thermal power at launch was 2580 W, producing 160 W of electrical power. This means that, at launch, approximately 2420 W of thermal power has been dissipated by the RTGs. Taking into account the plutonium decay with a half-life of 87.74 years, the total on-board power variation with time (in years) is given by
| (7) |
Telemetry data reveals that the electrical power decays at a faster rate than the plutonium radioactive decay; in the latest stages of the mission, about 65 W were available. Most of the electrical power is dissipated inside the main compartment. The electrical heat in the spacecraft body was around 120 W at launch, dropping to less than 60 W at the latest stages of the mission Toth , following an approximate exponential decay with a half-life of about 24 years. This difference in decay rates is mostly attributable to thermocouple degradation.
IV Results and Discussion
IV.1 Order of Magnitude Analysis
Before undertaking a more rigorous numerical estimate, one may use the results described above to perform a preliminary order of magnitude analysis. This allows one to obtain a concrete figure of merit for the overall acceleration arising from thermal effects, which can be compared with the scale of the Pioneer anomaly.
From the spacecraft specifications, one has a total mass , and separate RTG and equipment compartment powers and . As already discussed, the integration of the emissions of the RTG and instrument compartment indicate the proportion of emitted power that is effectively converted into thrust. If we consider the simpler model discussed is section III.2 and the power emitted from each surface proportional to its area (equivalent to assuming uniform temperature and emissivity in the RTGs and equipment compartment), we obtain
| (8) | |||||
One can easily estimate the acceleration of the spacecraft due to the thermal effects arising from the power dissipation of the RTGs and equipment compartment:
| (9) | |||||
This clearly indicates that both contributions are relevant to account for the reported anomalous acceleration of the Pioneer probes. Furthermore, it also shows that the RTGs and the instrument compartment yield similar thermal effects, so that one cannot focus solely on one of these sources when modeling the spacecraft (this had already been revealed by the analysis of Ref. Toth ).
IV.2 Thermal Force Estimate
Encouraged by the estimate outlined above, one may now proceed with a more thorough evaluation of the existing thermal effects, using our point-like source modeling.
In this section we shall use a model with 4 sources in each side panel of the equipment compartment and Lambertian sources at the bases of the RTGs, as discussed in section III.2. We believe this model gives us the best compromise between accuracy and computation time — the deviation of the source distribution relative to the finer meshes is less than 0.5 %. Integrating the radiation pressure and shadow components using the methodology presented in section II.2 and extracting the axial component, we obtain an expression that yields the thermal acceleration
| (10) |
where and are the powers emitted from the side panels and front of the equipment compartment and is the power emitted from the base of the RTG facing the centre of the spacecraft. Remaining contributions are much smaller, as discussed in sections III.1 and III.2.
A critical analysis of this expression, bearing in mind the spacecraft geometry, reveals that all considered contributions yield a sun-ward acceleration: the component radiates directly in a direction away from the sun, while the other two components and radiate laterally, illuminating the high gain antenna — which will yield a significant shadow and radiation pressure. The question now resides in correctly estimating each one of these powers. We shall consider the 1998 readings, as found in the graph of Ref. Toth , namely: and . These are the dissipated thermal powers at the RTG and equipment compartment.
The simplest scenario, with uniform temperature and optical properties (emissions proportional to the surface area, as in the previous section), leads to
| (11) | |||||
yielding an acceleration . This amounts to about 35% of the anomalous acceleration. However, it is wise to undertake a critical analysis of this figure: considering the available temperature maps of Refs. Toth ; Slava , we see that the temperature anisotropies along the sides of the equipment compartment fall within the tested cases, as discussed in section III.2. However, the RTG temperature distribution should deserve further attention, as there are significant temperature changes between the wall of the cylinder, the bases and the fins. In addition, it is expected that the front wall of the equipment compartment will have a larger contribution than the side walls, due to the presence of the louvers.
Taking these considerations into account, one can analyze the variation of the emitted power in the louvers and at the base of the RTG, since these are the two critical parameters in the calculation. If we consider that the louvers are closed and have a similar emissivity to the rest of the equipment platform, we can plot the variation of the acceleration with the temperature ratio between the louvers and the mean temperature of the platform, while keeping the total power constant. This is depicted in Fig. 7. One can perform a similar analysis for the RTGs, considering the ratio between the temperatures at the base of the cylinder and the fins (Fig. 8).


Figs. 7 and 8 are illustrative of the main strength of our method: it allows for a fairly quick and accurate analysis of the dependence of the final result on different parameters. Through Eq. (10) and sensible variation of the power parameters, one can match temperature readings and consider hypotheses for the variation of the optical properties.
We can now perform a second estimate considering the RTG cylinder bases and wall as having a 15% and 30% higher temperature than the fins, respectively. Assuming also that the closed louvers have similar emissivities, although a 100% higher temperature than the rest of the equipment compartment could be possible, one obtains the following values for the powers:
| (12) | |||||
In this case, one can account for 57% of the anomalous acceleration, that is, .
So far, our results do not consider reflections, i.e., full absorption of the radiation by the illuminated surfaces. In this study, we shall introduce diffusive reflection by assigning a value to the parameter in Eq. (4). For the kind of aluminum used in the construction of the antenna, the reflectivity is, typically, around 80% for the relevant wavelengths, yielding . For the multi-layer insulation of the equipment platform, a value of is considered. In these conditions, the illumination factors in Eq. (10) are modified to account for the reflection. With the same temperature conditions as in the previous case, the resulting acceleration is — approximately two thirds of the anomalous acceleration.
The results presented in this section give us a fairly good idea of the changes involved when considering different hypotheses and parameters. The three discussed scenarios here illustrate how one can use our method to identify the most sensitive parameters and quickly assess the effect of the existing uncertainties, suggesting where models must be refined in order to increase confidence in results.
V Conclusions
In this work we have developed a method to account for the acceleration of the Pioneer spacecraft due to thermal effects, based on point-like Lambertian sources. The flexibility and computation simplicity of our method allow for a reliable and fast estimate of the acceleration due to the various thermal contributions of the spacecraft components. This is sharply contrasting with the complexity and computationally demanding nature of the finite element analysis. Our methodology is potentially useful for a thorough parametric study of the various thermal contributions, as discussed in sections III and IV.
Our method allows for a reasonable degree of accuracy and the numerical error estimates provided by the numerical calculation package are of the order of or less, while the approximation of the geometry with point-like sources results in a deviation of less than 1%, as discussed in sections II.3 and III.2. This should not be understood as an indication of the accuracy of the resulting accelerations, when compared to the reported case of the Pioneer anomaly, but as a measure of self-consistency and reliability of the developed method — which should be expanded to model the physical system of the Pioneer spacecrafts more closely, while maintaining the desired flexibility and computational speed.
We find, after identifying the main contributions for the power of the various components of the spacecraft (RTGs, antenna and equipment bus compartment), figures ranging from 35% to 57% of the anomalous acceleration disregarding reflection. Inclusion of reflection implies that one can account for about 67% of the anomaly.
The natural continuation of this work will involve the refinement of the geometrical modeling, including the specular component reflection. In addition, and possibly more relevantly, we aim to pursue the identification of parameters that most significantly affect the final result — namely temperatures, emissivities and reflectivities of the various components, such as the louvers and the RTG case. In any case, our analysis does achieve a reasonable level of agreement with other thermal models based on finite element methods Toth ; Slava .
Acknowledgements.
This work is partially supported by the Programa Dinamizador de Ciência e Tecnologia do Espaço of the FCT — Fundação para a Ciência e Tecnologia (Portuguese Agency), under the project PDCTE/FNU/50415/2003, and partially written while attending the third Pioneer Anomaly Group Meeting at the International Space Science Institute (ISSI) at Bern, from 19 to 23 of February 2008. The authors would like to thank ISSI and its staff, for hosting the group’s meeting and accommodating for logistic requirements. The work of JP is sponsored by the FCT under the grant BPD 23287/2005.References
- (1) J. D. Anderson, P. Laing, E. Lau, A. Liu, M. M. Nieto and S. G. Turyshev, Phys. Rev. Lett. 81, 2858 (1998); Phys. Rev. D65, 082004 (2002).
- (2) C. Markwardt, gr-qc/0208046.
- (3) J. I. Katz, Phys. Rev. Lett. 83 1892 (1999).
- (4) L. Scheffer, Phys. Rev. D67, 084021 (2003).
- (5) Pioneer Anomaly Collaboration, European Space Agency Cosmic Vision: Space Science for Europe 2015 - 2025, BR-247, gr-gc/0506139.
- (6) V. T. Toth and S. G. Turyshev, AIP Conf. Proc. 977, 264 (2008).
- (7) O. Bertolami and P. Vieira, Class. Quantum Gravity 23, 4625 (2006).
- (8) M. M. Nieto, Phys. Rev. D72 . 083004 (2005).
- (9) O. Bertolami and J. Páramos, Class. Quantum Gravity 21, 3309 (2004).
- (10) M. Jaekel and S. Reynaud, Class. Quantum Gravity 22, 2135 (2005).
- (11) J. R. Brownstein and J. W. Moffat, Class. Quantum Gravity 23, 3427 (2006).
- (12) O. Bertolami, C. G. Boehmer, T. Harko and F. S. N. Lobo, Phys. Rev. D 75, 104016 (2007).
- (13) J. D. Anderson, J. K. Campbell, J. E. Ekelund, J. Ellis and J. F. Jordan, Phys. Rev. Lett. 100, 091102 (2008).
- (14) I. Mann and H. Kimura, J. Geophys. Res. A105, 10317 (2000).
- (15) O. Bertolami and J. Páramos, Int. J. Mod. Phys. D 16, 1611 (2007).
- (16) A. Levy, B. Christophe, P. Berio, G. Metris, J. M. Courty and S. Reynaud, arXiv:0809.2682 [gr-qc].
- (17) B. Christophe et al., Exp. Astron. 10.1007/s10686-008-9084-y; P. Wolf et al., Exper. Astron. 10.1007/s10686-008-9118-5.
- (18) S. G. Turyshev, The Pioneer Anomaly: Effect, New Data and New Investigation, communication to the American Physical Society Meeting in St. Louis, on April 13, 2008.