Descent curves and the phases of collapse of WTC 7
Abstract
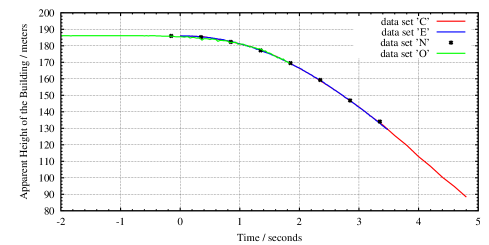
We examine four WTC 7 descent curves, labeled “C,” “E,” “N,” and “O,”
either anonymously published, or confidentially communicated to us.
Descent curve describes apparent height of a collapsing building
as a function of time.
While all sets are mutually consistent, it is set “C” which suggests
that there are three active phases of collapse.
Phase I is a free fall for the first m or s,
during which the acceleration is that of the gravity, m/s2.
In Phase II, which continues until drop m,
or s, the acceleration is m/s2,
while in Phase III which continues for the remaining of the data set,
m/s2.
We propose that the collapse of WTC 7 is initiated by a total and sudden
annihilation of the base (section of the building from the ground level to
), which then allows the top section (building above ) to
free fall during Phase I, and then collide with the ground in Phase II
and III.
We interpret the latter two phases of the collapse as the top section being
comprised of two zones, the 60% damaged
primary zone (below ) and the intact secondary zone (above ).
We derive a physical model for collision of the building with the ground,
in which we correct the “crush-up” model of Bažant and Verdure,
J. Engr. Mech. ASCE, 133 (2006) 308.
The magnitude of resistive force in the two zones of the top section
obviates the catastrophic failure mechanisms of Bažant and
Verdure (ibid.), and of Seffen, J. Engr. Mech. ASCE, 134 (2008) 125.
The total duration of the collapse, assuming that Phase III continues
to the end, is in the range s.
We compare our findings to those of NIST investigators and find an agreement
with respect to the distribution of damage in the primary zone.
We conclude that the building was destroyed in a highly controlled
fashion.
pacs:
45.70.Ht 45.40.Aa 45.20.dfI Introduction
World Trade Center (WTC) 7 perished after WTC 1 and 2 collapsed on September 11, 2001. Its demise was examined by Federal Emergency Management Agency (FEMA), which in 2002 issued a report. FEMA 403/2002 (2002) In the report it was claimed that the most likely cause of the collapse was the gradual weakening of vertical columns in the lower part of the building following their exposure to the mechanical and thermal stress. As the sources of mechanical stress the falling debris and the earthquake from the collapse of WTC 1 and 2 were given, while the fires raging inside the building, some of which were fueled by the heating oil known to have been stored in the building, were cited as a source of thermal stress. In November 20, 2008 the NIST investigators issued a report in which it was claimed that the fires that followed the impact of debris from the collapse of WTC 1 (the north tower) led to the collapse of WTC 7. NIST National Construction Safety Team (2008)
One easy-to-capture feature of a collapse of any high rise building is the motion of its top as a function of time - its descent curve. If the falling building collides with the Earth at a relatively well defined collision plane, then, on one hand side, the motion of the top reflects the motion of the moving part of the building. On the other, this feature allows us to write down the equation of motion for the moving part. The physical model that follows from the equation of motion, can be fitted to the descent curve, which in turn allows us to estimate how the collapse was initiated and when, and what was the damage distribution in the building.
The goal of this report is the analysis of motion of the top of WTC 7 as recorded in four descent curves: “C”Data set by Mr. David Chandler (November 14, 2008), “E”Data set by einsteen (November 6, 2008), “N”9-11 Research (2008), and “O”Data set by OneWhiteEye (November 6, 2008), cf. Fig. 1. We develop a physical model of the descent and fit it to the curves in order to obtain a local building’s strength. We compare so obtained values to the estimates provided by us Beck (2007), by Bažant and Verdure Bažant and Verdure (2006) and by Seffen Seffen (2008). We propose a scenario of collapse initiation which is consistent with the descent curve in its entirety, and which distribution of damage prior to collapse agrees with that of the NIST investigators. NIST National Construction Safety Team (2008)
II Descent Curve and Its Physical Model
II.1 Finite Differences Analysis of Descent Curve “N”
| index | frame | time | displacement | |||
| (i) | (sec) | (m) | (m/s) | (m/s) | (m/s2) | |
| 0 | - | 0.00 | 0.00 | 0.00 | ||
| 1 | 2 | 0.35 | 0.73 | 11.35 | 3.64 | 10.39 |
| 2 | 3 | 0.85 | 3.66 | 8.15 | 8.05 | 8.82 |
| 3 | 4 | 1.35 | 8.78 | 9.51 | 12.80 | 9.51 |
| 4 | 5 | 1.85 | 16.46 | 10.24 | 17.92 | 10.24 |
| 5 | 6 | 2.35 | 26.70 | 9.51 | 22.68 | 9.51 |
| 6 | 7 | 2.85 | 39.14 | 5.12 | 25.24 | 5.12 |
| 7 | 8 | 3.35 | 51.94 |
The descent curve shows the motion of the top of the building as a function of time. We use the term “top section” to label the part of the building which motion is common to that described by the descent curve. Our analysis of descent of WTC 7 then has two goals: to find the extent of the top section, and to determine its acceleration. We recall that the acceleration of the top section is a result of the forces acting on it. We discuss the forces acting on the top section later when we derive a physical model of the event.
We start with data set “N” because it is short: it contains 8 points at 0.5 s apart. A reader interested in full presentation of how the data was obtained is kindly directed to the original publication 9-11 Research (2008). We note that the estimated error of the distance is m.
The results of the finite differences analysis of the descent curve “N” are given in Tbl. 1 together with two intermediate velocities: the mean velocities on intervals , and the momentary velocities at the end points . We immediately notice that the mean acceleration of the top section has two distinctive values, which we associate with the phases of descent and label with Roman numerals. During Phase I the average acceleration is m/s2, which is within 1% from the free fall acceleration given by the gravity m/s2. This phase lasts for the first s. Phase I is thus a free fall phase. Phase II continues during which the mean acceleration, , drops to m/s2. This phase presumably continues for the remaining one second of recorded data.
Now that we have determined the acceleration of the top section, we answer the question of how far below the top of the building does the top section extend. We notice that the 2.35 s long free fall corresponds to a distance of m. We label this 26 m section of the building in the path of the top section “the base.” The question thus becomes at what height is the bottom of “the base.” The clue about where is “the base” comes from the NIST investigation on the collapse of WTC 1 and 2, where it is explicitely hypothesized NIST National Construction Safety Team (2005) (p.146, Sec. 6.14.4)
The structure below the level of collapse initiation offered minimal resistance to the falling building mass at and above the impact zone. The potential energy released by the downward movement of the large building mass far exceeded the capacity of the intact structure below to absorb that through energy of deformation.
In other words, when a steel frame (the top section) collides with another steel frame (“the base”) it feels minimal to no resistance. However, as indicated by the descent curve, when the top section finishes destroying “the base” its acceleration suddenly drops to half its value. We conclude that at that point the top section collides with the only other object a falling body can collide with - the Earth’s surface. This puts “the base” to the base of the building, from the ground level to the height m, and the top section from all the way to the top. This positioning of “the base” is consistent with the visual appearance of the collapse, where the visible part of the building moves uniformly. Behavior of the base of the building, on the other hand, is completely hidden in the cloud of dust created at the onset of collapse.
Here however, the following comment is due. The visual appearance of collapse, and positioning of “the base” to the base of the building do not imply that the NIST hypothesis stated above is correct. Had the top section started its motion from m down and accreted the mass of the base in its path this would create an inertial brake which would prevent the top section from ever achieving the free fall acceleration. As the top section starts immediately with the free fall acceleration this implies that , the base is converted into a free falling rubble prior to the top section falling through it, and , the crushing of the base is not done by the top section. We return to this point later in the report, when we discuss it in more quantitative fashion.
Based on this argument we assert that the collapse of WTC 7 begins with a sudden and total annihilation of the base, which, on one hand, allows the top section to free fall for the height of the base, and on the other, leads to the observed change in acceleration once the top section reaches the ground. We label euphemistically the collapse initiation moment a “release,” and the height m from which it occurs a “release point.” While Phase I describes the free fall of the top section to the ground following its release, in Phase II the top section collides with the ground. Bažant and Verdure Bažant and Verdure (2006) label Phase II of the collapse a “crush-up,” and we adhere to their terminology for the rest of the report.
II.2 Physical Model of Collision of a Building with the Ground
II.2.1 Derivation of General Model
Use of an one-dimensional model for description of a collapsing building is justified providing that the building of interest, WTC 7, collapsed almost perfectly in its footprint. This remarkable feature allows us to exclude any transverse coordinates from the analysis and use only the height to describe the motion of the building. In doing so, we in effect average the behavior of the building with respect to the excluded coordinates. Most importantly, we do not need to consider a failure of individual load-bearing structural elements, e.g., vertical columns, and instead concentrate on their collective response.
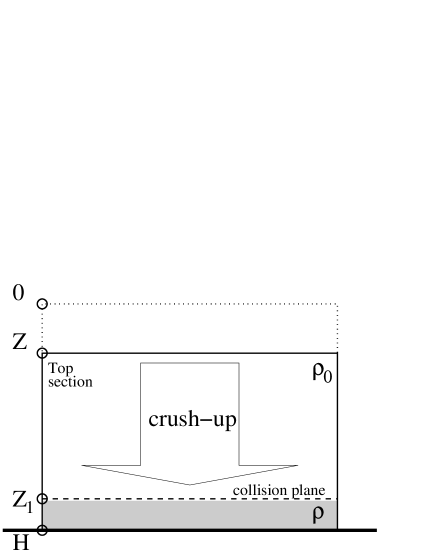
The collapse dynamics of the building in “crush-up” mode is shown in Fig. 2. The falling building, the top of which is at , collides with the ground at a collision plane at . As a result of a finite compaction ratio the collision plane crawls up, toward the top section. First, we assume that the building is of uniform mass density , where is the total mass of the building and its height. We introduce a compaction ratio , as
| (1) |
where is the density of compacted building. For simplicity, we assume that the compaction is uniform as well, i.e., that is a constant. Second, we introduce two coordinates to mark the progression of “crush=up,” an apparent drop of the top of the building, , and, a position of the collision plane, . The two coordinates are connected by the requirement that the mass of the building is conserved,
| (2) |
yielding
| (3a) | |||
| (3b) |
and
| (4) |
We proceed with the derivation of equation of motion for the apparent drop of the building . This is most easily accomplished by using the energy formalism. The kinetic energy of the moving part of the building is
| (5) |
while its momentum is
| (6) |
The potential energy of the building is given by , giving
| (7) |
The gravitational force with respect to the coordinate follows from , and is given by
| (8) |
Last energy in the problem is the “latent” energy , from which the force with which the building resists its destruction, call it resistive force , is derived. We have,
| (9) |
The resistive force with respect to the coordinate follows, as before, , and is given by
| (10) |
This said, the equation of motion for follows from Newton’s law,
| (11) |
The loss of momentum (mass, energy) occurs at the avalanche front where the momentum is transferred to the stationary part of the building. The loss rate is , where is the mass of the moving part, yielding for the equation of motion,
| (12) |
We observe that while in the limit Eq. (12) coincides with the result of Bažant and Verdure Bažant and Verdure (2006), for their model does not correctly incorporates compaction.
The resistive force describes how the building resists its destruction at the avalanche front. It is a function of strength of the structural elements of the building, as well as their failure mode. Most notable contribution comes from the vertical columns, the strength of which varies with height . For simplicity, we assume that the dependence of on is at most linear, yielding
| (13) |
where and are two dimensionless parameters. With this parameterization of we obtain the ordinary differential equation (ODE) for ,
| (14) |
Finally, we note that if we set , we immediately obtain the equation of motion for a free fall,
| (15) |
It has to be kept in mind that Eq. (14) contains an assumption of what happened to the base at the onset of collapse: it was instantaneously converted into a free floating pile of debris, which for starts to free fall to the ground and contributes to motion of the collision plane at .
When we solve Eq. (14) later, we always assume that the top section starts its motion from rest, .
Parameters of the building that enter Eq. (14) are the total height of the building, m, and the parameters and of the local resistive force, . Furthermore, in our simplified model the building comprises 47 floors, each 3.66 m high, and the 14 m high lobby.
Though it might not be obvious, the compaction parameter is of secondary importance. Thus, in what follows we further simplify Eq. (14) by taking .
II.2.2 Apparent Weight of the Building During the Collapse
An apparent weight the top section exerts during the collapse on the Earth’s crust, , is given by
| (16) |
where is the scaled drop, and is the scaled velocity, with being a free fall time from height . Index in and keeps track of the phase of collapse so it is a function of the time, as well.
In Eq. (16), is the mass of the top section, s is the duration Phase I, the free fall, while m is the distance. The terms appearing in are, from left to right, , the weight of the top section that has already reached the ground, ; , reaction force due to the change of momentum of the crushed material at the collision plane, ; and , the resistive force at the collision plane, . The last term is present because the crushing of the building at the collision plane is performed between the ground and the top section.
We believe that , and in particular its time derivative, can be used in interpretation of the seismic signal of the building’s collapse. As an attempt to connect the two brings forth numerous additional complications which need to be properly addressed, we leave this topic to future publications.
III Descent Curve “C”
Data set “C,” as presented to us, consists of two descent curves, one at 10 samples per second, and the other at 5 samples per second. We leave presentation and discussion of the descent curve to future publication by their author. Data set by Mr. David Chandler (November 14, 2008) In what follows we use low resolution data set only, which consists of 25 data points, with an estimated error in distance of m.
The importance of the physical model (14) is that it allows us to identify the phases of collapse (stages of descent between which the acceleration changes discontinuously) to the zones of the top section being destroyed in the collision with the ground.
As a measure of how close is a solution of Eq. (14), call it , to the data set “C” we use a sum-of-absolute-errors (SAE),
| (17) |
Inspection of data suggests that there are three zones in the building, each with its own and .
We estimate as follows. We perform a sequential fitting where in the first step we fix heights and while varying simultaneously the parameters of the resistive force in all three zones. In the second step we vary the positions of one of the bounds, or , in 0.5 and 1 m increments, respectively, where we use the results obtained in the previous step as the initial conditions. For minimization of SAE we use a simplex method of Nelder and Mead, as it does not require computation of derivatives. For solving the ODE we use a Runge-Kutta Prince-Dormand (8,9) method. Both methods are implemented in the GSL.111M. Galassi and J. Davies and J. Theiler and B. Gough and G. Jungman and M. Booth and F. Rossi, GNU Scientific Library, Reference Manual, Version 1.3, 2002, http://www.gnu.org/software/gsl.
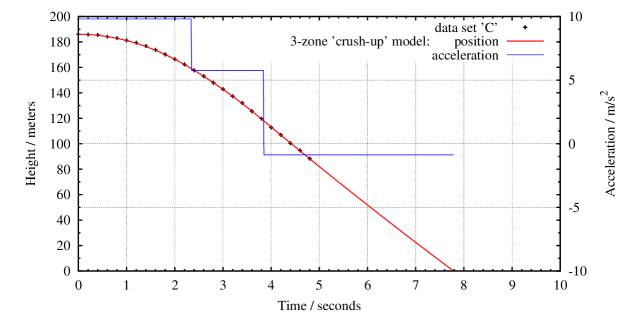
The results of the minimization are shown in Fig. 3. In the three-zone model the best fit achieves m. The boundaries between the zones are at m and m, where , and , for Phases I, II, and III of descent, respectively. The fit of the model to the data is excellent with an average error per point being m, thus smaller then the m margin given by the set “C” author. We estimate the width of the boundaries by introducing a number of “micro” zones at and . This procedure yields for the width of transition at of 1 m and 2 m at , which we write as m and m. The accelerations during the descent are for the free fall phase (Phase I), m/s2 for the “crush-up” of the primary zone (Phase II) and m/s2 for the “crush-up” of the secondary zone (Phase III).

We estimate uncertainties in as follows. We perform a large number of optimizations , where we randomly choose initial values for , while keeping and fixed. Further, of all so obtained we keep only those which SAE is within 1% of the best (smallest) value. In Fig. 4 we show the results of minimization. While remain unremarkably close to 0, in Phase II we find that ’s spread along the line,
| (18) |
For Phase III we find that ’s spread along the line,
| (19) |
This indicates that SAE posses shallow minima along the lines Eq. (18) and Eq. (19).
We further reduce a number of zone parameters in the three-zone model by considering that the top section throughout both zones is comprised of load bearing elements of identical properties. Then, the anticipated difference in strength between the zones comes from varying their number of elements. We introduce a constant , which couples the resistive force in the primary and the secondary zone, or in Phase II and III, respectively, as follows
| (20) |
While the results of optimization remain unremarkably close to the one listed previously, this procedure yields a very narrow estimate . In other words, the primary zone appears to be 60%, or so, compromised compared to the secondary zone.
III.1 The Secondary Zone
To our knowledge, there were no attempts to estimate the magnitude of resistive force in WTC 7. However, such estimates were provided for WTC 2 by Bažant and Verdure Bažant and Verdure (2006), and for WTC 1 and 2 by us Beck (2007). The following discussion is based on an assumption that those estimates represent reasonable values for WTC 7, as well:
-
•
Bažant and Verdure’s estimate: The authors make an educated guess that the crushing energy per floor in an intact building is GNm. 222In their numerical modeling they also allow arbitrary halving of their estimate of the resistive force. They argue that the reduction is due to increased temperature of the environment. The resistive force is then given by , where m is the floor height. They take mass of WTC 1 and 2 to be kg which yields . The authors defend their estimate being so small by introducing a scenario of collapse which is currently being disputed.333Most recent objections being raised by Szuladzinski, whose simulations of compression failure of individual columns suggest that their resistive force is much greater than Bažant and Verdure allow in their report. Seffen Seffen (2008) proposes an alternative, more obscure, catastrophic mechanism, which net effect is the same: a near-zero resistive force in a collapse of otherwise an intact building.
Given the magnitude of the resistive force in three phases of collapse, the two catastrophic mechanisms can, at best, be applied to the rapid reduction of the base’s strength to zero in Phase I. We note that the physical processes behind both mechanisms require the top section to produce “destruction waves” at the collision plane with the base. The “waves” propagate through the structure in front of the top section and reduce its resistive force to near-zero, after which the top section collects the pieces in its path. However, this cannot explain a free fall seen in WTC 7: the collected mass acts as an inertial brake which prevents the top section from ever reaching the free fall acceleration. We quantify this analysis in the next section.
We conclude that their physical mechanisms, and consequently their estimates of resistive force, do not apply to WTC 7. Whether they apply to WTC 1 and 2 is yet to be seen.
-
•
Beck’s estimate: we argued that it suffices to consider a textbook model of resistive force,444Please note, Bažant and Verdure (ibid.) and Seffen(ibid.) recognize the textbook model as an upper limit for the resistive force. Considering that the experiment is the mother of all theories it would be beneficial if members of scientific community would take upon themselves to examine the video footage of the collapse and measure or verify the descent curves for all three buildings. To this date the descent curves for WTC 1 and 2 are unavailable, and the NIST investigators ignore them in their investigation. , where is the ultimate yield strength of the vertical columns as a function of drop from the building’s top, while is the ultimate yield strain of the structural steel used in the building. Using the estimates for properties of the vertical columns in WTC 1 and 2 (their cross section, strength and the weight they carry) one arrives to , that is, in an intact building. On the other hand, the parameters of the secondary zone of WTC 7 are on the line . We see that, within a margin of error of under 5%, the two overlap. We base our error estimate on the ratio of a distance between the two () to , and which is under 0.05. This is illustrated in Fig. 4 where we plot and in the primary and the secondary zone in WTC 7 and compare it to their values in intact WTC 1 and 2, and to the contribution from perimeter columns only.
We conclude that the secondary zone of WTC 7 appears to be intact.
III.2 The Primary Zone and the NIST Hypothesis Regarding the Collapse Initiation
The descent curve provides us with a precise estimate of the primary zone being 60%, or so, damaged compared to the intact secondary zone. Here, the primary zone stretches from m (4th floor) to m (15th floor). We use the findings by the NIST investigators to posit that the core columns are absent in the primary zone.
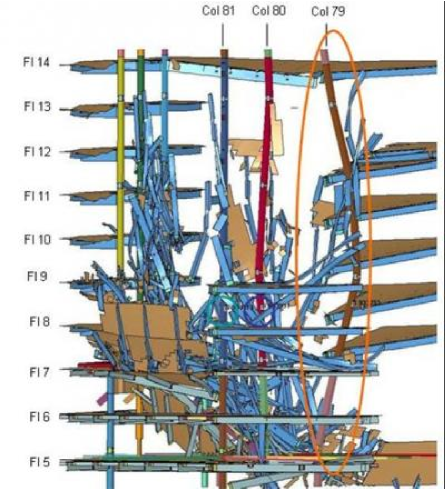
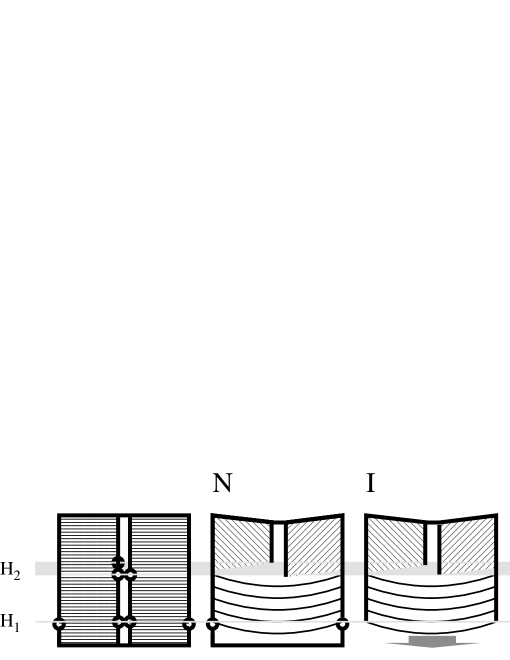
We start by stating the hypothesis of the NIST investigators, NIST National Construction Safety Team (2008) regarding the distribution of damage prior to the collapse and its initiation, both illustrated in Fig. 5. The report blames a failure of the column No. 79 near the 13th floor for the collapse initiation. Its failure presumably induces a cascade of floor failures, which cause the buckling of “additional columns” and “within seconds, the entire building core is failing.”
We immediately note that the last statement in their hypothetical failure scenario is not correct: according to the descent curve it is not the entire building core that is failing but only the core below . We recall that the descent curve indicates that the secondary zone (the building above ) managed to stay intact not just at the initiation of collapse but also until the collision plane of destruction reached it some 4 seconds into the collapse. Now, if it is only the core below that is failing, than this failure for sure includes the core columns of the primary zone, and possibly the core columns of the base. This is only the first of disagreements between the NIST hypothesis and the descent curve.
Second, it is not clear what drives the failure of the core below . It is not the weight of the building above: the core columns are severed at so below they carry little more then their own weight. Thus, the mass participating in the “cascade of floor failures” at best corresponds to the mass of the core below .
Third, a connection between the cascade of floor failures and the release of the top section at m is not clear in the findings by the NIST investigators. The hypothetical failure that starts near propagates downwards through the center, possibly to the ground level, on one hand side. On the other, at this “cascade” surfaces at the sides of the building and severs the perimeter columns so that the free fall may commence. If the “cascade” indeed surfaces near , and is “spontaneous,” then should vary considerably at the exit points along the perimeter of the building. In terms of the descent curve this would manifest itself as being a range over which the resistive force changes from zero to some other value. Contrary to being “spontaneous,” the descent curve indicates a sudden transition from Phase I to Phase II, where its width is less than 1 m.
We conclude that the NIST report, as is, agrees with the descent curve only in regard to the distribution of damage in the primary zone: in a cascading floor failure that started at the top of the primary zone the building, most likely, lost all of its core columns in the primary zone and in the base. We emphasize this point in Fig. 4 which, among others, shows that and in the primary zone of WTC 7 are rather close to the estimated contribution from the perimeter columns in WTC 1 and 2, we presented in Beck (2007).
The NIST investigators, on the other hand, ignore the demise of the base and a role it played in initiation of the collapse.
III.3 Free Fall and the Demise of the Base
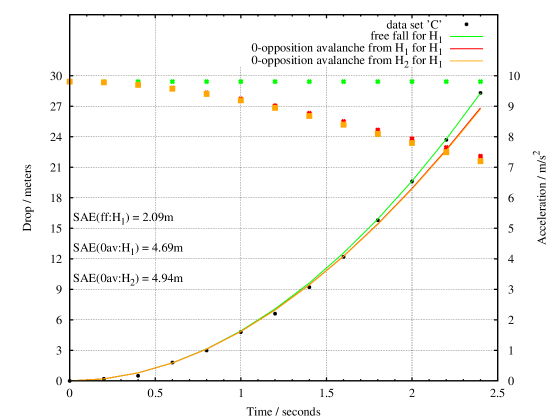
From the beginning it transpired that the top section flew through the base in a fashion awfully close to a free fall. Later when discussing the secondary zone we mentioned an alternative physical model of descent: an actual avalanche. We now examine more closely Phase I of the descent for a distance m as described by the data set “C” and compare it to the free fall motion, and to a motion of a fictional avalanche that started at some height in the building, say, and continued for .
Here we recall that a difference between the avalanche and the free fall is that in the avalanche it is the top section that destroys a part of the base in its path and then adsorbs it, while in the free fall the base is quickly converted into the free floating chunks so the entire building simultaneously free falls. Also, as discussed earlier, Bažant and Verdure Bažant and Verdure (2006), and Seffen Seffen (2008) proposed a highly speculative mechanisms which net-result is that the avalanche by the top section feels almost-zero resistance when crushing, presumably, intact structure of the base in its path. NIST investigators imply the same in the quotation we stated earlier.
We start by stating the equation of motion of a 0-opposition avalanche that at time has dropped to position ,
| (21) |
where for simplicity we neglect the effects of compaction . Assuming that the motion at starts from rest, , at drop , Eq. (21) can be integrated once, yielding a relationship between the current velocity and the position. The time it takes the avalanche to propagate from to is given by
| (22) |
where is the hyper-geometric function Gradshteyn and Ryzhik (2000). Similarly, the acceleration as a function of position for is given by
| (23) |
Finally, we use Eq. (22) and Eq. (23) to find the drop of the avalanche and its acceleration at the times at which data set “C” was recorded. For completeness we consider two avalanches, the first, that starts at and propagates to the ground level, , and the second, that starts at and propagates for to .
In Fig. 6 we show the data set “C,” the respective theoretical trajectories, and their accelerations and SAE. Here, SAE is calculated over the first 13 points of the data set “C” and the positions predicted by each theoretical model. We note that the free fall has SAE m, on one hand side, and on the other, that SAE for the entire three-zone crush-up model over 25 points ( m) is less than SAE for either of the 0-opposition avalanche models ( m). This finding reaffirms our previous conclusion that Phase I is a free fall for m and not an avalanche that started somewhere in the building and propagated for the same distance.
In light of our discussion of the secondary and the primary zone we speculate what must happen to the base for a free fall of the top section to be possible:
-
1.
The core of the base is destroyed in the same sequence as the core of the primary zone. The NIST investigators appear to be hypothesizing this to be the case: what they believe is a cascade of floor failures may in fact be a staged destruction (severing) of the core columns in the primary zone and then continues throughout the base. However, the damage to the base is more extensive than the damage to the primary zone in that in the base the floors and their web of trusses are destroyed as well. The top section is later, at , released by severing the perimeter columns at . These columns offer little to no resistance to the falling top section due to their marginal position and small cross section.
-
2.
The destruction of the entire base at is inconsequential to an earlier destruction of the core columns in the primary zone. The strength, of otherwise intact, base is sufficient to arrest the fallout of staged destruction of the core columns in the primary zone. Here, the base being annihilated is what releases the top section.
We note that in terms of the apparent weight the building exerts on the Earth’s crust during its collapse, Eq. (16), the two cases differ. There are two type of terms contributing to the apparent weight: “arrest,” created by a large chunk of the building coming to a stop after hitting the ground or a part of the building in its path, and “release,” created by a large chunk breaking off the building and starting a free fall. It is a reasonable assumption that the seismic signal is excited by changes in the apparent weight of the building, , given by , where is the sampling rate, while is a difference operator acting on a time series of collected at the sampling rate.
It can be shown that if the interior, core and floors, of the base and the core of the primary zone are destroyed prior to the release of the top section (Case 1) than the peak in from the first release (the top section being allowed to free fall) is comparable to, possibly weaker than, the peak of the first arrest (the top section reaching the ground). On the other hand, if the destruction of the entire base marks the release of the top section (Case 2) then the peak of the first release is much stronger than the peak of the first arrest.
We believe it is the seismic signal of the collapse that can be used to deduce which of the two cases is more likely to have had occurred. We leave this analysis to future publications with our collaborators. Given our current knowledge Kim et al. (2001), we favor Case 1.
IV Conclusion
Given the descent curves, the results of physical modeling, some video evidence and the damage review by the NIST investigators we conclude that the collapse of WTC 7 is comprised of four phases:
-
•
Phase N: Null or Preparatory phase starts 8, or so, seconds before the collapse. During that phase, we argue, the core between m (15th floor) and m is destroyed together with the base interior.
The appearance of the building during that period, which features, among others, sinking of the penthouses on the top into the building, is consistent with severing of the core columns below . The sinking results from the sections of the core columns above being left suspended from the hat truss and the perimeter columns. That these hanging sections of core columns in the secondary zone are not destroyed becomes apparent during Phase III when the top section in its last moments regains its full (local) strength.
-
•
Phase I: Free Fall phase begins at with a sudden and total annihilation of the base (part of the building between the ground level and ). This allows the top section (part of the building above ) to free fall to the ground.
-
•
Phase II: “Crush-up” begins s into the collapse when the top section reaches the ground. For the next 42 m the primary zone of the top section, which was compromised during Phase N, is destroyed in collision with the ground.
-
•
Phase III: “Crush-up” of the top section continues for the next s as the secondary zone is being destroyed. While the top section now begins to decelerate, this, in itself, is not sufficient to arrest the collapse. The phase continues some 7.8-8.8 s into the collapse when the last remains of the building fall on the ground.
We conclude that the building was destroyed in a highly controlled fashion and, contrary to the common sentiment, did not spontaneously collapse.
Acknowledgements.
This report was first published on-line on www.arxiv.org and was based on, to that date available, descent curve “N” published by an organization 9-11 Research. It motivated Mr. JPA to contact us in November of 2008, and through his contacts provide us with to date most extensive descent curve “C.” Without curve “C” by Mr. David Chandler, the main findings of this report - free fall and a presence of two zones in the top section, one of which is intact - would be highly speculative, as readers can verify from the earlier versions of this report. We acknowledge stimulating discussions with Mr. JAP, Mr. Chandler, and Mr. E, and their critical remarks. We acknowledge the feedback provided by the members of different public Internet forums and their critical remarks.References
- FEMA 403/2002 (2002) FEMA 403/2002, World Trade Center Building Performance Study: Data Collection, Preliminary Observations, and Recommendations (Federal Emergency Management Administration, Washington D.C., 2002).
- NIST National Construction Safety Team (2008) NIST National Construction Safety Team, NIST NCSTAR 1A: Final Report on the Collapse of World Trade Center Building 7 (2008).
- Data set by Mr. David Chandler (November 14, 2008) Data set by Mr. David Chandler (November 14, 2008), communicated through Mr. JPA.
-
Data set by einsteen (November 6,
2008)
Data set by einsteen
(November 6, 2008), communicated through Mr.
JPA, also available at http://the911forum.freeforums.org/
withering-critique-of-the-new-wtc7-report-t44-120.html#p642. - 9-11 Research (2008) 9-11 Research, Frames of the facade movement of wtc7 (2008), [Online; accessed 29-February-2008], http://911research.wtc7.net/wtc/analysis/wtc7/speed.html.
-
Data set by OneWhiteEye (November 6,
2008)
Data set by OneWhiteEye
(November 6, 2008), communicated through Mr.
JPA, also available at http://the911forum.freeforums.org/
technical-notes-on-video-motion-analysis-t55-30.html#p664. - Beck (2007) C. M. Beck (2007), submitted to J. Engr. Mech. ASCE. Preprint available on-line at http://www.arxiv.org, article physics/0609105.
- Bažant and Verdure (2006) Z. P. Bažant and M. Verdure, J. Eng. Mech. ASCE 133, 308 (2006).
- Seffen (2008) K. A. Seffen, J. Eng. Mech. ASCE 134, 125 (2008).
- NIST National Construction Safety Team (2005) NIST National Construction Safety Team, NIST NCSTAR 1 - Final Report on the Collapse of the World Trade Center Towers (U. S. Government Printing Office, Washington D.C., 2005).
- Gradshteyn and Ryzhik (2000) I. Gradshteyn and I. Ryzhik, Table of Integrals, Series, and Products (Academic Press, San Diego, 2000), sixth ed.
- Kim et al. (2001) W.-Y. Kim, L. R. Sykes, J. Armitage, J. Xie, K. H. Jacob, P. G. Richards, M. West, F. Waldhauser, J. Armbruster, L. Seeber, et al., Trans. Am. Geo. Un. 82, 565 (2001).
Appendix A Data Set “C”
| Time | Drop |
| (sec) | (m) |
| 2.0 | 155.80 |
| 2.2 | 155.60555We use value 155.80 m instead, and posit that the uncertainty in the drop is m. Only effect of this action is that SAE is reduced by 0.2 m by hand. |
| 2.4 | 155.60 |
| 2.6 | 155.30 |
| 2.8 | 154.00 |
| 3.0 | 152.80 |
| 3.2 | 151.00 |
| 3.4 | 149.20 |
| 3.6 | 146.60 |
| 3.8 | 143.60 |
| 4.0 | 140.00 |
| 4.2 | 136.20 |
| 4.4 | 132.10 |
| 4.6 | 127.50 |
| 4.8 | 122.90 |
| 5.0 | 117.80 |
| 5.2 | 112.70 |
| 5.4 | 107.10 |
| 5.6 | 101.80 |
| 5.8 | 95.38 |
| 6.0 | 89.52 |
| 6.2 | 82.63 |
| 6.4 | 76.77 |
| 6.6 | 70.14 |
| 6.8 | 64.52 |
| 7.0 | 58.15 |