ALPHA Collaboration
Compression of Antiproton Clouds for Antihydrogen Trapping
Abstract
Control of the radial profile of trapped antiproton clouds is critical to trapping antihydrogen. We report the first detailed measurements of the radial manipulation of antiproton clouds, including areal density compressions by factors as large as ten, by manipulating spatially overlapped electron plasmas. We show detailed measurements of the near-axis antiproton radial profile and its relation to that of the electron plasma.
pacs:
36.10. k, 34.80.Lx, 52.20.Hv
Cold antihydrogen atoms () were first produced by the ATHENA collaboration Amoretti et al. (2002), and, shortly thereafter, by ATRAP Gabrielse et al. (2002) at the CERN Antiproton Decelerator (AD) Maury (1997) in 2002. They were produced by mixing positrons (e+) and antiprotons () held in Penning-Malmberg traps. Such traps use an axial magnetic field to provide radial confinement and electrostatic wells to provide axial confinement. Penning-Malmberg traps confine only charged particles and, consequently, do not confine neutral atoms. All the atoms produced to-date have ionized in the electrostatic well fields or annihilated on the trap walls immediately after their formation.
The current generation of experiments Andresen et al. (2007); Gabrielse et al. (2007) aims to trap atoms as this is likely necessary for precision CPT and gravity tests. Neutral atoms have a small permanent magnetic moment and can be trapped by a local, three-dimensional minimum of a magnetic field Pritchard (1983). Traps based on this effect are called Minimum-B traps. To trap both charged and neutral species simultaneously, the Minimum-B and Penning-Malmberg traps must be co-located. The compatibility of Minimum-B and Penning-Malmberg traps remains controversial Fajans et al. (2005); Andresen et al. (2007); Gabrielse et al. (2007), but it is clear that the two are most compatible if the ’s and e+’s are held close to the trap axis where the perturbations from the Minimum-B trapping fields are smallest Fajans and Schmidt (2004); Fajans et al. (2006); Zhang et al. (2007). Furthermore, holding the ’s and e+’s near the axis increases their overlap, and slows the drifts of the ’s. These drifts increase the kinetic energy of the ’s that form from the ’s, and make the ’s more difficult to confine in the very shallow Minimum-B traps.
Successful compression has been briefly reported elsewhere Yamazaki (2001); Kuroda et al. (2005); Torii et al. (2005); here we present the first carefully controlled and quantitative characterization of the process, as well as the first accurate measurements of the near-axis radial distribution of ’s. We have demonstrated areal density increases by as much as a factor of ten, and have produced clouds with radii as small as 0.29 mm. Clouds of this size are far from the loss limits Fajans et al. (2006) of our trap Andresen et al. (2007), and promise to be much easier to confine.
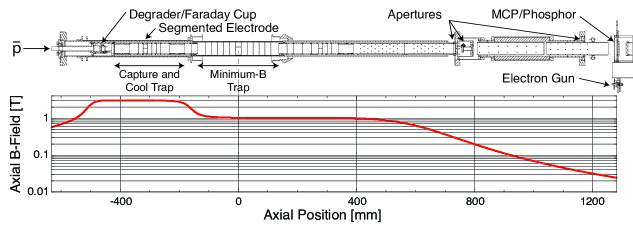
A schematic drawing of our apparatus is shown in Fig 1. The experimental cycle begins by injecting million electrons (e-’s) into a 136 mm long electrostatic well located in the 3 T Capture and Cool trap. The e-’s are later used to cool the ’s Gabrielse et al. (1989), and form a plasma with a radius of mm. They quickly cool (calculated energy e-folding time of 0.44 s) via cyclotron radiation in the 3 T field to near the temperature of the cryogenically cooled trap walls of diameter 33.6 mm Hyatt et al. (1987); Beck et al. (1996). We then adjust the radius of this plasma by applying a rotating electrostatic potential to an azimuthally segmented electrode (see Fig. 1). This technique, called a rotating wall (RW) potential Huang et al. (1997); Greaves and Surko (2000), is commonly used in non-neutral plasma research to adjust the plasma density and radius, and works by applying a torque to a plasma. If the RW frequency is higher than the plasma rotation frequency, this torque will compress the plasma; if it is lower, it will expand the plasma. (The plasma rotates because the radial electric field in the trap engenders an azimuthal drift.)
After the e- are injected and their radial profile is adjusted to optimize cooling, as discussed later, we compress them axially into a well of length 30 mm by manipulating the electrostatic potentials. Next, we inject a pulse of antiprotons from the AD. The ’s pass through m aluminium-equivalent degrading foils so that have an energy of less than 5 keV Amoretti et al. (2004). These relatively slow ’s are captured by directing them into a one-sided, 5 kV, electrostatic well. Before they bounce out of this well, we erect a second 5 kV wall at the entrance end of the trap, thereby confining them in the now complete well Gabrielse et al. (1986); Amoretti et al. (2004). These hot ’s then cool by collisions with the e- Gabrielse et al. (1989); Amoretti et al. (2004) for 30 s, after which the well potential walls are lowered to our working voltages of 10-100 V.
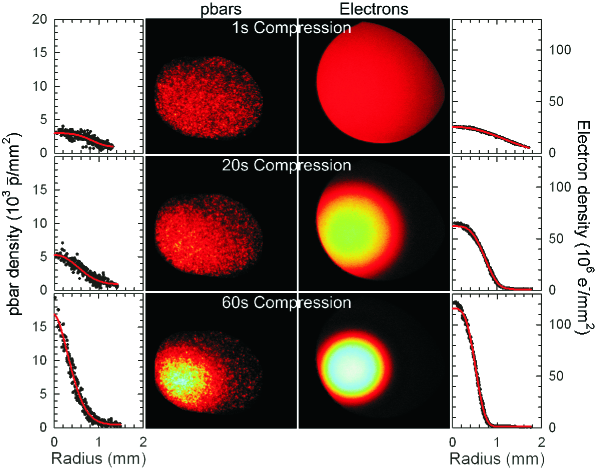
We image the e-’s and ’s by allowing them to escape along the magnetic field lines onto a microchannel plate (MCP)/phosphor screen assembly. We capture the resultant images with a CCD camera Peurrung and Fajans (1993). Some typical images, described in detail below, are shown in Fig. 2. The spatial distribution of the particles in the trap can be deduced by mapping the images back from the MCP to the particle trap. Since the MCP is in a B-field of 0.024T, which is much lower than the trap field of 3T, the field lines, and, hence, the particles, expand by a factor of . The e-’s are tightly bound to the field lines and follow them closely. However, the heavier ’s exhibit small drifts, most notably the centrifugal drift Chen (1984) in the low magnetic field region near the MCP. These drifts cause the ’s to rotate about the magnetic axis during extraction. There are several apertures in our apparatus located near the positions indicated in Fig. 1; these apertures are clearly visible in Fig. 2 and limit the maximum size of the plasmas that we can image. Because the ’s drift, and because the trap’s magnet and mechanical axes are not perfectly aligned, the apertures are imaged differently for the two species. As a result, the aperture image centers are not coincident, and the apertures limit the image area differently; the aperture image area is about 40% smaller than the e- aperture image area.
We calibrate the image brightness by independently measuring the charge with a Faraday cup (e-’s) and with scintillators (’s). The brightness is linearly Peurrung and Fajans (1993) related to the charge, and the calibrations are accurate to about 20%. As there are far fewer ’s than e-’s, we operate the MCP at higher gain () for ’s than for e-’s (). Before imaging the ’s we extract all the e-’s by momentarily lowering the trap wall, thereby allowing the light e-’s to escape before the heavy ’s have time to react Amoretti et al. (2004). We repeat these “e-kick” cycles many times to ensure that we remove all the e-’s, while simultaneously monitoring annihilations to verify that we do not also lose ’s. When we do not load ’s from our trap (by blocking the incoming beam, or by not applying the 5 kV catching potentials), but otherwise run a normal cycle, we observe a null image.
Figure 3 shows the effect of varying the radius of the e- plasma on the cooling process. In Fig. 3a, we establish that the radius of the cooled cloud scales with the radius of the cooling e- plasma. We vary the e- plasma radius by varying the RW frequency. Before the RW is applied, the e- radius is about 0.80 mm, and is unchanged by a RW frequency of 400 kHz. We can compress the plasma to radii as small as 0.65 mm and expand it to 1.95 mm by applying RW frequencies that are, respectively, above (3 MHz) and below (10 kHz) this frequency. Above a radius of about 1.39 mm we do not observe enough of the e- plasma edge to accurately measure its half-width-half-maximum [HWHM (our definition of the radius.)] For these plasmas we assume that the e- plasma radial profiles are self-similar, and infer the plasma radius from the peak density. The inset graph in Fig. 3a validates this approach.
In Fig. 3b we plot the cooling efficiency as a function of the e- plasma radius. (Less detailed measurements of this quantity have been reported by ASACUSAKuroda et al. (2005).) The cooling efficiency is the ratio of the number of cooled ’s to the total number of captured ’s, as measured by separately dumping these two populations into the degrader and recording the number of annihilations. If we do not expand the e- plasma with the RW, we cool only about 24% of the captured ’s. With expansion to about 1.95mm, we can cool up to about 72%. Computer simulations using the MAD Grote et al. (1989) and SRIM Ziegler et al. (1985) packages predict that the radius (sigma) of the incoming ’s is about 4 mm, which is compatible with our measurements when one considers that the plasmas extend beyond the HWHM, and the uncertainties in the simulations and their input parameters.
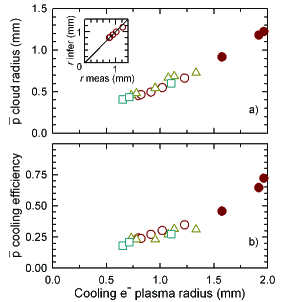
Figure 3 shows that efficient cooling requires e- plasmas which are several millimeters in radius, and that the resulting clouds will be of comparable radius. This radius is larger than optimal for the Minimum-B trap, particularly as the ’s expand by a factor of when they are transferred from the 3 T Capture and Cool trap to the 1 T Minimum-B trap (see Fig. 1). Consequently, we use a second RW cycle, now operating on the mixed e-- plasma, to compress the e-’s and ’s before effecting the transfer. Typical results of this compression cycle are shown in Fig. 2; systematic compression studies are shown in Figs. 4 and 5. For the expansion RW cycle we used a chirped frequency drive, and controlled the radius and density by changing the final frequency. For compression we could not use a chirped drive because of unwanted resonances in our system; instead, we used a single high frequency drive (10 MHz for the data in Figs. 2, 4 and 5), and controlled the e-radius by varying the time that the RW was applied. As can be seen from Figs. 2 and 5, the density and radius follow those of the e-’s; the results are shown in Figs. 4b and 5. In this series, the density increased by a factor of 5, and the radius decreased to about 0.42 mm; about 11000 ’s were compressed. Using a higher frequency RW drive (20-25 MHz) yielded densities twice as high and radii of 0.29 mm.
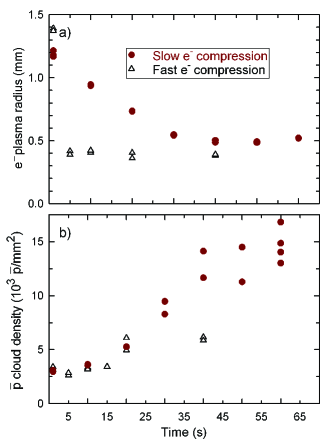
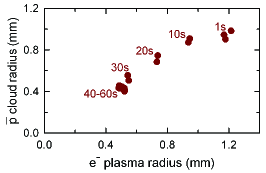
Our measurements suggest that the ’s come into equilibrium with the e-’s, and that this equilibrium drives the cloud radius towards the e- plasma radius. Presumably, the charges interact through collisionally-mediated drag forces. Such “sympathetic” compression has been observed in laser controlled multi-species ion plasmas Larson et al. (1986). We commonly observe that when we compress the e-’s too quickly, the ’s do not follow the e-’s. (See, for instance, the fast e--compression data in Fig. 4, where the compression speed was increased by increasing the RW drive voltage by a factor of 5.) With fast e--compression, it is likely that the ’s are left behind in a region of low e- density where the interspecies collision rate is too low to keep the species coupled. Though the ’s do not compress if we eject the e-’s before the compression RW cycle, we cannot rule out the possibility that the RW compression acts directly on the ’s when the RW is applied to a mixed e-- plasma.
For the density and temperature conditions of our e-’s and ’s, the global thermal equilibrium condition should place the ’s in a ring just outside the e-plasma O’Neil (1981). Such distributions have been observed in laser cooled plasmas Larson et al. (1986), but we do not observe them. We do not know if this is because the ’s have not yet fully relaxed, they are redistributed during the e-kicking process, the e- plasmas are substantially hotter than we believe them to be, the imaging system smears our images, or something more fundamental is responsible.
In conclusion, we report the first detailed measurements of trapped radial compression. We can compress the density by a factor of ten and decrease the radii to 0.29 mm. These clouds are 10-20 times smaller in radius than the clouds reported by ATHENA Fujiwara et al. (2004) and ATRAP Oxley et al. (2004). Control of the radial profile of the ’s is critical to their survival in a Minimum-B trap. We have also studied the effect of the e- plasma radius on the cooling of hot ’s. Finally, we have developed a diagnostic that gives a detailed radial profile of ’s near the trap axis. In the crucial near-axis region, this new diagnostic is a marked improvement over methods based upon annihilation imaging Fujiwara et al. (2004), or two data point extrapolations Oxley et al. (2004).
This work was supported by CNPq, FINEP (Brazil), ISF (Israel), MEXT (Japan), FNU (Denmark), NSERC, NRC/TRIUMF (Canada), DOE, NSF (USA), EPSRC and the Leverhulme Trust (UK) and HELEN/ALFA-EC.
References
- Amoretti et al. (2002) M. Amoretti, C. Amsler, G. Bonomi, A. Bouchta, P. Bowe, C. Carraro, C. Cesar, M. Charlton, M. J. T. Collier, M. Doser, et al., Nature 419, 456 (2002).
- Gabrielse et al. (2002) G. Gabrielse, N. S. Bowden, P. Oxley, A. Speck, C. H. Storry, J. N. Tan, M. Wessels, D. Grzonka, W. Oelert, G. Schepers, et al., Phys. Rev. Lett. 89, 213401 (2002).
- Maury (1997) S. Maury, Hyperfine Interactions 109, 43 (1997).
- Andresen et al. (2007) G. Andresen, W. Bertsche, A. Boston, P. D. Bowe, C. L. Cesar, S. Chapman, M. Charlton, M. Chartier, A. Deutsch, J. Fajans, et al., Phys. Rev. Lett. 98, 023402 (2007).
- Gabrielse et al. (2007) G. Gabrielse, P. Larochelle, D. L. Sage, B. Levitt, W. S. Kolthammer, I. Kuljanishvili, R. McConnell, J. Wrubel, F. M. Esser, H. Glückler, et al., Phys. Rev. Lett. 98, 113002 (2007).
- Pritchard (1983) D. E. Pritchard, Phys. Rev. Lett. 51, 1336 (1983).
- Fajans et al. (2005) J. Fajans, W. Bertsche, K. Burke, S. F. Chapman, and D. P. van der Werf, Phys. Rev. Lett. 95, 155001 (2005).
- Fajans and Schmidt (2004) J. Fajans and A. Schmidt, Nucl. Instr. Meth. Phys. Res. A 521, 318 (2004).
- Fajans et al. (2006) J. Fajans, W. Bertsche, K. Burke, A. Deutsch, S. F. Chapman, K. Gomberoff, D. P. van der Werf, and J. S. Wurtele, in Non-Neutral Plasma Physics VI: Workshop on Non-Neutral Plasmas, edited by M. Drewsen, U. Uggerhøj, and H. Knudsen (AIP, Melville, N.Y., 2006), vol. 862, p. 176.
- Zhang et al. (2007) J. Zhang, C. L. Taylor, and F. Robicheaux, J. Phys. B 40, 1019 (2007).
- Yamazaki (2001) Y. Yamazaki, Hyperfine Interactions 138, 141 (2001).
- Kuroda et al. (2005) N. Kuroda, H. A. Torii, M. Shibata, Y. Nagata, D. Barna, D. Horváth, M. Hori, J. Eades, A. Mohri, K. Komaki, et al., in Physics with Ultra Slow Antiproton Beams, edited by Y. Yamazaki and M. Wada (American Institute of Physics, Wako, Japan, 2005), vol. CP793, p. 307.
- Torii et al. (2005) H. A. Torii, N. Kuroda, M. Shibata, Y. Nagata, D. Barna, M. Hori, A. Mohri, K. Komaki, and Y. Yamazaki, in Low Energy Antiproton Physics-LEAP ’05, edited by D. Grzonka, R. Czyzykiewicz, W. Oelert, T. Rozek, and P. Winter (Amer. Inst. of Physics, 2005), vol. CP796, p. 413.
- Gabrielse et al. (1989) G. Gabrielse, X. Fei, L. A. Orozco, R. L. Tjoelker, J. Haas, H. Kalinowsky, T. A. Trainor, and W. Kells, Phys. Rev. Lett. 63, 1360 (1989).
- Hyatt et al. (1987) A. W. Hyatt, C. F. Driscoll, and J. H. Malmberg, Phys. Rev. Lett. 59, 2975 (1987).
- Beck et al. (1996) B. R. Beck, J. Fajans, and J. H. Malmberg, Phys. Plasmas 3, 1250 (1996).
- Huang et al. (1997) X.-P. Huang, F. Anderegg, E. M. Hollmann, C. F. Driscoll, and T. M. O’Neil, Phys. Rev. Lett. 78, 875 (1997).
- Greaves and Surko (2000) R. G. Greaves and C. M. Surko, Phys. Rev. Lett. 85, 1883 (2000).
- Amoretti et al. (2004) M. Amoretti, C. Amsler, G. Bonomi, A. Bouchta, P. D. Bowe, C. Carraro, M. Charlton, M. Doser, V. Filippini, K. S. Fine, et al., Nucl. Instr. Meth. A 518, 679 (2004).
- Gabrielse et al. (1986) G. Gabrielse, X. Fei, K. Helmerson, S. L. Rolston, R. L. Tjoelker, T. A. Trainor, H. Kalinowsky, J. Haas, and W. Kells, Phys. Rev. Lett. 57, 2504 (1986).
- Peurrung and Fajans (1993) A. J. Peurrung and J. Fajans, Rev. Sci. Instrum. 64, 52 (1993).
- Chen (1984) F. Chen, Introduction to plasma physics and controlled fusion (Springer, 1984).
- Grote et al. (1989) H. Grote, F. C. Iselin, E. Keil, and J. Niederer, in Proc. 1989 IEEE Particle Accelerator Conference, edited by F. Bennett and J. Kopta (Chicago IL, USA, 1989), p. 1292.
- Ziegler et al. (1985) J. F. Ziegler, J. P. Biersack, and U. Littmark, The stopping range of ions in solids (Pergamon Press, New York, 1985), see also http://www.srim.org.
- Larson et al. (1986) D. J. Larson, J. C. Bergquist, J. J. Bollinger, W. M. Itano, and D. J. Wineland, Phys. Rev. Lett. 57, 70 (1986).
- O’Neil (1981) T. M. O’Neil, Phys. Flu. 24, 1447 (1981).
- Fujiwara et al. (2004) M. C. Fujiwara, M. Amoretti, G. Bonomi, A. Bouchta, P. D. Bowe, C. Carraro, C. L. Cesar, M. Charlton, M. Doser, V. Filippini, et al., Phys. Rev. Lett. 92, 65005 (2004).
- Oxley et al. (2004) P. Oxley, N. S. Bowden, R. Parrott, A. Speck, C. H. Storry, J. N. Tan, M. Wessels, G. Gabrielse, D. Grzonka, W. Oelert, et al., Phys. Lett. B 595, 60 (2004).