Echelle long-slit optical spectroscopy
of evolved stars
Abstract
We present echelle long-slit optical spectra of a sample of objects evolving off the Asymptotic Giant Branch (AGB), most of them in the pre-planetary nebula (pPN) phase, obtained with the ESI and MIKE spectrographs at the 10 m Keck II and 6.5 m Magellan-I telescopes, respectively. The total wavelength range covered with ESI (MIKE) is 3900 to 10900Å (3600 to 7200Å). In this paper, we focus our analysis mainly on the H profiles. Prominent H emission is detected in half of the objects, most of which show broad H wings (with total widths of up to 4000 km s-1). In the majority of the H-emission sources, fast, post-AGB winds are revealed by P-Cygni profiles. In 37% of the objects H is observed in absorption. In almost all cases, the absorption profile is partially filled with emission, leading to complex, structured profiles that are interpreted as an indication of incipient post-AGB mass-loss. The rest of the objects (13%) are H non-detections. We investigate correlations between the H profile and different stellar and envelope parameters. All sources in which H is seen mainly in absorption have F-G type central stars, whereas sources with intense H emission span a larger range of spectral types from O to G, with a relative maximum around B, and also including very late C types. Shocks may be an important excitation/ionization agent of the close stellar surroundings for objects with late type central stars. Sources with pure emission or P Cygni H profiles have larger color excess than objects with H mainly in absorption, which suggests the presence of warm dust near the star in the former. The two classes of profile sources also segregate in the IRAS color-color diagram in a way that intense H-emitters have dust grains with a larger range of temperatures. Spectral classification of the central stars in our sample is presented. For a subsample (13 objects), the stellar luminosity has been derived from the analysis of the O I 7771-5Å infrared triplet. The location in the HR diagram of most of these targets, which represent 30% of the whole sample, is consistent with relatively high final (and, presumably, initial) masses in the range 0.6-0.9 (3-8).
1 Introduction
Intermediate mass stars (1-8) evolve from the Asymptotic Giant Branch (AGB) to the Planetary Nebula (PN) phase through a short-lived ( 103 yr) and fascinating evolutionary stage designated as the post-AGB (pAGB) or pre-planetary nebula (pPN) phase. At some point in the late-AGB or early pAGB stage, a process (or processes) becomes operative that accelerates and imposes severe asymmetries upon the slow, spherical AGB winds: the spherical, slowly expanding ( 15 km s-1) AGB circumstellar envelope (CSE) becomes a PN with clear departures from sphericity and fast ( 100 km s-1) outflows directed along one or more axis. Although there is no consensus yet for what causes this spectacular metamorphosis, fast jet-like winds have been hypothesized to play an important role (see e.g. the review paper on PNs shaping by Balick & Frank, 2002). These outflows carve out an imprint within the AGB CSE producing and shaping the fast, bipolar lobes observed in most pPNs and PNs (Sahai & Trauger, 1998). The mechanism that powers and collimates pAGB jets is a fundamental issue on stellar evolution that remains a mystery.
Optical spectroscopic observations of pPNs and PNs have allowed considerable advances in our understanding of pAGB evolution and, in particular, are very useful for probing the interaction between pAGB winds and the CSE formed in the previous AGB phase. Our current (very limited) knowledge of pAGB evolution and, more particularly, of pAGB winds is derived mainly in two ways. The first is indirect, that is, based on the effects of the pAGB winds on the AGB CSEs. Many pPNs/PNs show extended lobes with, often, bow-shaped features at their tips that are visible through optical recombination and forbidden emission lines. Spectroscopic observations have been crucial for understanding the origin of these regions, which are found to be excited by the passage of fast (100 km s-1) shocks (e.g. Sánchez Contreras et al., 2000; Vázquez et al., 2000). From these results we infer the existence of fast, pAGB winds that interact hydrodynamically with the AGB CSE leading to the formation of shocks and, ultimately, to the acceleration and shaping of the nebular material.
Direct detection of pAGB winds is limited to a very few objects. In some cases, there is Balmer and forbidden line emission arising in a set of compact, shock-excited regions located along the nebular axis (e.g. Bujarrabal et al., 1998; Riera et al., 2006). These ‘knots’, which usually move away from the star at high velocity, are thought to result from the propagation of shocks in the pAGB wind itself, suggesting that pAGB winds are collimated and directed along the nebular axis. In some pPNs/PNs, fast, pAGB winds are also revealed by P-Cygni profiles close to the central star. One of the most exciting results recently provided by long-slit spectra with /STIS is the first direct observation of the spatio-kinematic structure of a fast collimated pAGB wind (jet) in a ‘pristine’ stage, i.e., not strongly altered by the interaction with the AGB shell (Sánchez Contreras & Sahai, 2001). The characterization of the pristine jet in Hen 3-1475, which is collimated and expands at more than 2000km s-1 at only 1016 cm from the central star, has had a direct impact on the different theories of pAGB wind collimation, ruling out purely hydrodynamical processes as the collimation agent in this object.
Recognizing the importance of optical spectroscopy of pAGB objects we have recently obtained optical long-slit spectra a large sample of objects evolving off the AGB, most of them pPNs and young PNs, in order to characterize the pAGB mass-loss process and the jet-sculpting of AGB winds. This forms part of our extensive, multi-wavelength survey program of imaging and spectroscopic observations of OH/IR stars (evolved mass-losing stars with OH maser emission), which may be the youngest pPNs (e.g. Sahai et al., 2007b; Sánchez Contreras & Sahai, 2004).
In this paper, we present the spectroscopic database resulting from our observations. Our work complements recent optical spectroscopic surveys of pPNs/PNs (e.g. Suárez et al., 2006; Pereira & Miranda, 2007) by providing deep, high spectral resolution spectra covering a wide wavelength range. Here, we focus on the characterization and analysis of the different types of H profiles and their correlation with several stellar and envelope parameters. The shape of the line profile is interpreted in terms of present-day mass-loss in these objects, which enable obtaining information on their on-going pAGB winds. We have also derived spectral types based on the absorption line spectrum of our targets. Whenever available, the O I 7771-5Å infrared triplet have been used as a luminosity indicator.
2 Observations and data reduction
2.1 Spectroscopy with ESI at the 10 m Keck II telescope
Observations of most targets (28 sources) were carried out in 2002 and 2003, using the Echellete Spectrograph and Imager (ESI; Sheinis et al., 2002) in echelle mode mounted on the 10 m W.M. Keck II telescope at Mauna Kea (Hawaii, USA). Table 1 presents a journal of the observations. The detector was a MIT-LL CCD with 20484096 squared pixels of 15m. Total wavelength coverage is 3900-10900Å. The reciprocal dispersion and the pixel angular scale range from 0.16 to 0.30 Å/pixel and from 0120 to 0168, respectively, for the ten echellette orders (15 to 6) of ESI. The velocity dispersion has a nearly constant value of 11.5km s-1 pixel-1 in all orders. We used a 0520″ slit. For extended objects with known morphology the slit was centered on the nucleus of the nebula and oriented along its main symmetry axis. For the rest of the objects the slit was oriented along the paralactic angle. For the object IRAS 055062414, we observed two different positions centered on the compact sources labeled as and in the images presented in Sahai et al. (2007b). Seeing ranged between 06 and 09. Weather conditions were photometric only for the nights 2003, June 4 and 2004, August 11.
All spectra were reduced using the IRAF111IRAF is distributed by the National Optical Astronomy Observatories, which are operated by the Association of Universities for Research in Astronomy, Inc., under cooperative agreement with the National Science Foundation. package following the standard procedure. The long-slit spectra were bias-subtracted (using the IRAF task esibias) and flat-fielded. Individual exposures for each object were combined and cosmic-rays removed. One dimensional (1D) spectra were extracted using the IRAF task apall. We used extraction apertures large enough to include all the nebular emission (except for Hen 3-1475; see § 3). Background regions were defined on each side of the aperture separated by a buffer zone for the different orders. The background level in these regions was fitted and subtracted. Wavelength calibration was done using exposures of copper-argon (CuAr) calibration lamps and the night sky lines. The comparison spectra were extracted using the same aperture as the objects. Lines were identified in the calibration spectra and a dispersion solution was found for, and applied to, each of our science targets. The velocity resolution achieved (FWHM of the lamp lines) is 37km s-1 for all orders. Flux calibration was obtained by observing a number of spectrophotometric standard stars (Hiltner 600, Feige 56, LTT 1788, BD+28°4211, BD+33°2642, and Feige 110) using a 6″-wide slit.
2.2 Spectroscopy with MIKE at the 6.5 m Magellan-I telescope
Spectra for IRAS 171503224 and IRAS 174403310 were obtained at the 6.5-m Magellan-I (Baade) telescope in Las Campanas Observatory (Chile) using the Magellan Inamori Kyocera Echelle (MIKE) spectrograph (Bernstein et al., 2003). (We also observed IRAS 174412411 with MIKE, however, the ESI spectrum for this source has a larger S/N and, therefore, MIKE data are not presented.) Observations were carried out on 2003, April 27-28. For the configuration used in these observations, the wavelength ranges covered were 3200–5000 Å and 4900–7300 Å, respectively for the blue and red arms. Each arm is equipped with a 20484096 15 m-pixels CCD. We used a 1″-wide slit, leading to a resolving power of R28,000 (22,000) for the blue-arm (red-arm) spectra. The images were binned 22 for a final reciprocal dispersion of 0.04 and 0.10 Å pixel-1, respectively for the blue and red arms, and a spatial scale of 0.28 arcsec pixel-1. Since our targets were more extended that the length of the slit projected onto the sky (5″), blank sky spectra with the same exposure time as for our source were taken right after observing each object for background subtraction. The average seeing was 1″ (15) for the night when IRAS 171503224 (IRAS 174403310) was observed.
For IRAS 174403310 and IRAS 171503224 the slit was centered on the nebular nucleus and the North-West lobe, respectively. The PAs along which the slits were oriented rotated during the exposure 5-7° around the position quoted in Table 1. This is because MIKE is located in one of the Nasmyth platforms of the Magellan telescope but is not attached to the instrument rotator neither it incorporates any mechanism to compensate for the field rotation. This setup provides an excellent stability but implies that the position of the slit in the sky changes continuously as the observation progresses.
These spectra were reduced using the MIKE pipeline developed by Daniel Kelson (see Kelson et al. 2000, Kelson 2003, 2007 for an extensive description of some of the numerical methods used). Although observations were performed under non photometric conditions, we corrected the data for the wavelength-dependent response of the system by acquiring spectra of the spectrophotometric standard stars HR 3454, HR 4468, HR 7596, HR 8634, and HR 7950. All the spectra were wavelength calibrated using observations of a lamp of Thorium-Argon taken right after observing each target. The velocity resolution achieved (FWHM of the lamp lines) is nearly constant for all the orders: 12-13km s-1 for the red arm and 10km s-1 for the blue arm. One dimensional spectra were extracted using the total length of the slit as the aperture. Our spectra probably do not include emission from the ends of the lobes of IRAS 171503224 and IRAS 174403310, which lied outside of the slit.
2.3 The sample
The objects observed in this work are listed in Tables 1 and 2. In Table 2 we give the type of H profile assigned in this study (§ 3.1) together with the class of object, the spectral type of the central star, the f12/f25 IRAS flux ratio, the 60µm IRAS flux (f60), the morphology of the optical and/or near-IR nebula, and the chemistry. We have adopted the primary morphology classification system by Sahai et al. (2007b), which establishes four main classes of nebular shapes: bipolar (B), Multipolar (M), elongated (E), and irregular (I). We have also included information on two secondary structural features defined by Sahai et al., namely, the presence of a dark obscuring waist across the center of the nebula (denoted by “w”) and direct visibility of the central star in the optical or near-infrared (denoted by “”). Objects with star-like appearance in the images, i.e. with no nebulosity detected around them, are denoted as stellar (S). References for the spectral type, published high-angular resolution images (optical and/or near-IR), and chemistry are given in the last column of Table 2. Many of the objects in our sample are listed in the “The Torun catalogue of Galactic post-AGB and related objects” by Szczerba et al. (2007), where additional information and references can be found.
Our sample has been mainly selected from our multi-wavelength surveys of OH/IR stars (e.g. Sahai et al., 2007b; Sánchez Contreras & Sahai, 2004) based on their IRAS colors and identification of optical counterparts. OH/IR stars generally show double-peaked OH-maser emission lines profiles, are strong infrared sources, and are believed to be evolved mass-losing stars with dense CSEs. The IRAS spectral energy distributions (SEDs) of most of our targets show a lack of hot dust ( ) – indicating a recent cessation of the large-scale AGB mass-loss process, which is believed to signal the beginning of pAGB evolution. The complex, aspherical morphologies of most objects as seen in high-angular resolution images indicate that pAGB wind interactions are taking, or have taken, place in these sources.
Although our sample is composed in its majority of pPNs, it also includes five long-period variable (AGB) stars: IRAS 01037+1219 (IRC+10011), IRAS 02316+6455 (V 656 Cas), IRAS 03507+1115 (IK Tau), IRAS 09452+1330 (IRC+10216) and IRAS 10131+3049 (CIT 6). Their IRAS colors ( ) indicate that the heavy AGB mass-loss process is still going on. The large-scale envelopes around these objects are roughly circularly symmetric, however, the core nebular structures are often asymmetric and display bipolar or irregular/clumpy morphologies. This indicates that these objects are likely precursors of bipolar pPNs in which the jet-sculpting of the AGB CSE by interaction with collimated (probably fast) outflows has already started. Our sample also contains several young PNs (yPNs). We have adopted the classification as yPNs for objects with O- and B-type central stars surrounded by newly formed, compact H II regions like the well known pAGB objects M 1-92 and Hen 31475 (see Table 2). We have also included in our sample the object IRAS 191140002 (also known as AFGL 2343), which has a controversial evolutionary status. IRAS 191140002 has been classified as either a pPN descended from low- or intermediate-mass progenitor (Reddy & Hrivnak, 1999) or a yellow hypergiant (YHG) descended from a massive (30) Population I supergiant (e.g. Jura & Werner, 1999; Castro-Carrizo et al., 2007). YHGs are believed to follow an evolutionary path similar to that of pPNs: they undergo a strong mass-loss process leading to massive CSEs while their central stars become progressively hotter, therefore, we consider appropriate to include IRAS 19114+0002 in our observations. The source IRAS 055062414, although satisfies our selection criteria, is most likely not an evolved star. This enigmatic outflow source was serendipitously discovered as part of our multi-wavelength survey of pPNs and is probably associated with an early stage of a massive star’s life (Sahai et al., 2008). The ESI spectra of IRAS 055062414 taken at position (see § 2.1) is presented here for completeness but this object is not further discussed except for spectral type assignation (§ 4.2). Finally, although most of the objects in this study are O-rich, we have also incorporated some C-rich envelopes as well as objects with a mixed or uncertain chemistry.
Our sample is not complete on any of the properties summarized in Table 2, but rather should be considered as a pilot sample. As happens in other studies based on optical data, our sample is necessarily biased toward objects with optical counterparts. This implies that we may be missing pAGB objects heavily obscured by thick, dusty envelopes, i.e. probably the most massive and youngest pAGB stars. What is the fraction of such massive, heavily obscured objects and what is the mass/age threshold in our sample is very difficult to determine because the star and envelope evolution (as well as their mutual influence) along the AGB and pAGB phases, which ultimately determine when the envelope becames visible in the optical, remain very poorly characterized.
3 Results
For most of the targets, our two-dimensional (2D), long-slit spectra show spatially unresolved or marginally resolved emission. For the sources IRAS 055062414, IRAS 174231755, IRAS 193432926, IRAS 212825050, IRAS 220365306, IRAS 173172743, IRAS 174403310, IRAS 174412411, and IRAS 171503224, the nebular emission is resolved. The 2D spectra of these spatially resolved nebulae will be studied in detail in the future. In this paper, we present and discuss extracted 1D spectra obtained using an aperture that includes emission from the whole nebula. In most cases, the spectrum is dominated by that of the bright nucleus, the emission from the extended nebulosity being undetected or very faint. In the case of Hen 3-1475, the aperture has been chosen to include emission only from the bright nebular core (inner 2″) and leaving outside the emission from the shocked, axial knots that are well separated from the nucleus (e.g. Sánchez Contreras & Sahai, 2001). For the objects in our sample with optically thick equatorial regions (a total of 8; see references given in Table 2), the light from the nucleus, including the stellar continuum, is indirectly seen scattered off by the dust in the lobes.
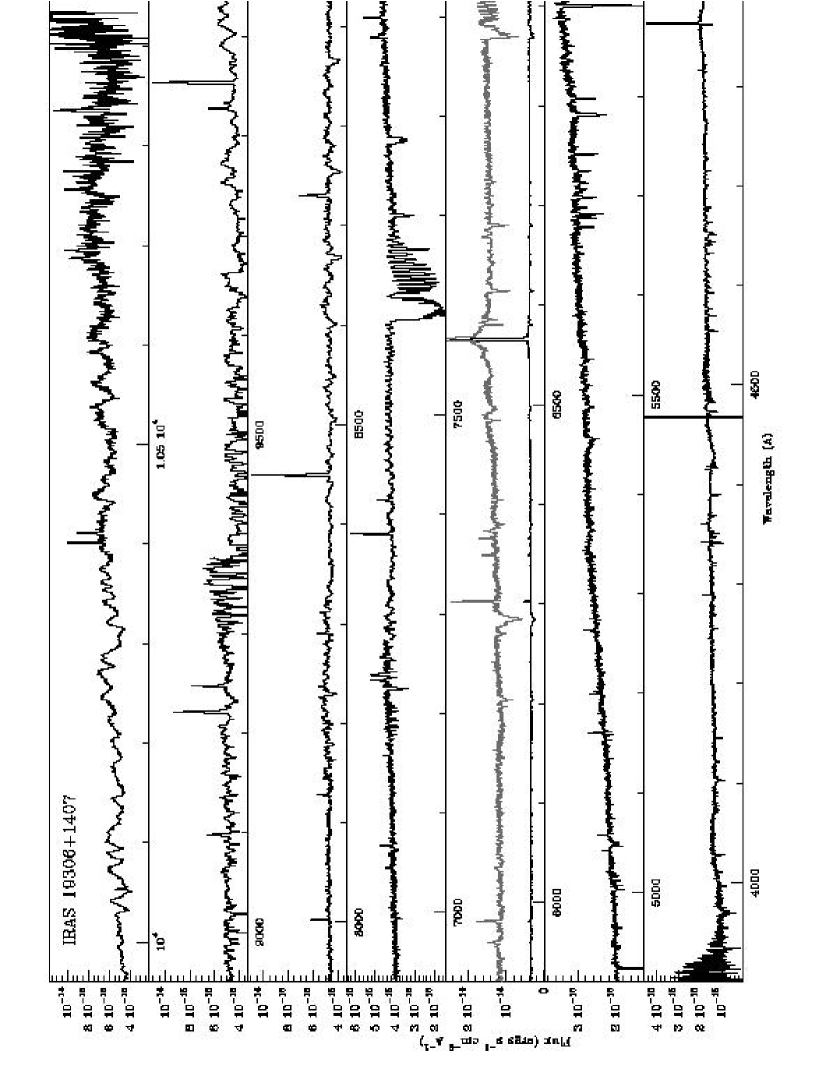
The spectra of our targets are composed by a number of absorption and/or emission lines superimposed on a fairly red continuum (Fig. 1). Most absorption lines are expected to be of photospheric origin whereas emission (recombination and forbidden) lines are most likely nebular. Other absorption features that may have an interstellar or circumstellar origin, such as the diffuse bands at 4430, 5780, 5797, and 6284Å (e.g. Luna et al., 2008, and references therein), are also observed in some of our targets. The continuum emission is dominated by the stellar photospheric continuum (we have checked that the contribution by nebular continuum is negligible, as expected, even for the objects displaying the most intense H emission).
3.1 Hydrogen lines
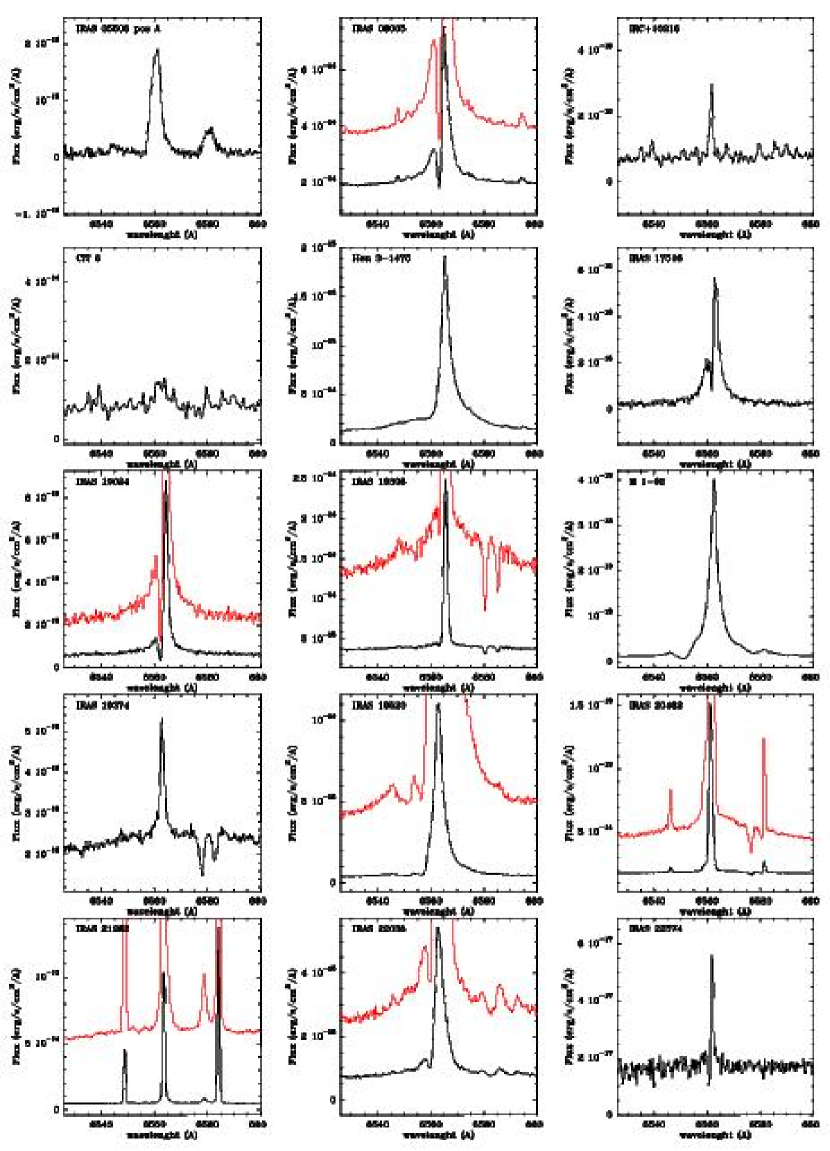
Half of the objects in our sample (15 out of 30) show H mainly in emission (Fig. 2) and 11 targets show H mainly in absorption (Fig. 3). We have also found 3 sources (all of them are AGB stars) with neither H emission or absorption and 1 object (the pPN IRAS 192921806) in which the low S/N of the spectrum prevents us from determining whether H emission or absorption is present.
Based on the H profile we can identify objects of different types (Table 2). Among the sources where H is observed mainly in emission (Fig. 2), we find two basic types of profiles, namely, symmetric and asymmetric. Only 2 sources belong to the first category (referred to as pure emission sources – pE): the yPN IRAS 193742359 and the AGB star IRAS 094521330 (IRC10216). In CIT 6 there is strong line blending around the H line222We note that the features around H are not due to the noise but represent real emission lines, many of which are also observable in the spectrum of IRC10216.; since H cannot be isolated, determining the shape of its profile is not possible. The rest of the H-emitting sources, which is also the majority (12 out of 15), show signs (in a different manner and amount) of absorption bluewards of the line core, which is responsible for their asymmetric profiles. Most sources show clear P Cygni like profiles, i.e. with a narrow/sharp blue-shifted absorption feature against the line wings. IRAS 080052356 and IRAS 190240044 display two of the most remarkable P Cygni profiles amongst the objects in this category (referred to as pcyg). In IRAS 195202759 (and tentatively IRAS 175162525 and IRAS 193061407), not one but two different blue-shifted absorption features are observed. In 3 objects (He3-1475, IRAS 212825050, and IRAS 204623416), the H blue wing is clearly weaker than the red one. Although a sharp blue-shifted absorption is not observed in our spectra, these objects belong to the pcyg class. In the case of the well known yPN Hen 31475, /STIS optical spectra show a remarkable H P Cygni profile with two distinct blue-shifted absorption features well delineated against the line wings (Sánchez Contreras & Sahai 2001). These absorption features appear smoothed out in our ESI spectra and, more generally, in ground-based observations probably due to their blending with emission components arising in different nebular regions superimposed within the PSF. In the case of IRAS 212825050 and IRAS 204623416, P Cygni like profiles are observed in other H I and He I lines (see e.g. H in Fig. 4), which supports H having a true, but partially masked out, P Cygni profile. Moreover, further confirmation of P Cygni line profiles exists from previous spectroscopic observations of both IRAS 212825050 and IRAS 204623416 (Smith & Lambert, 1994; Arrieta & Torres-Peimbert, 2003, and references therein).
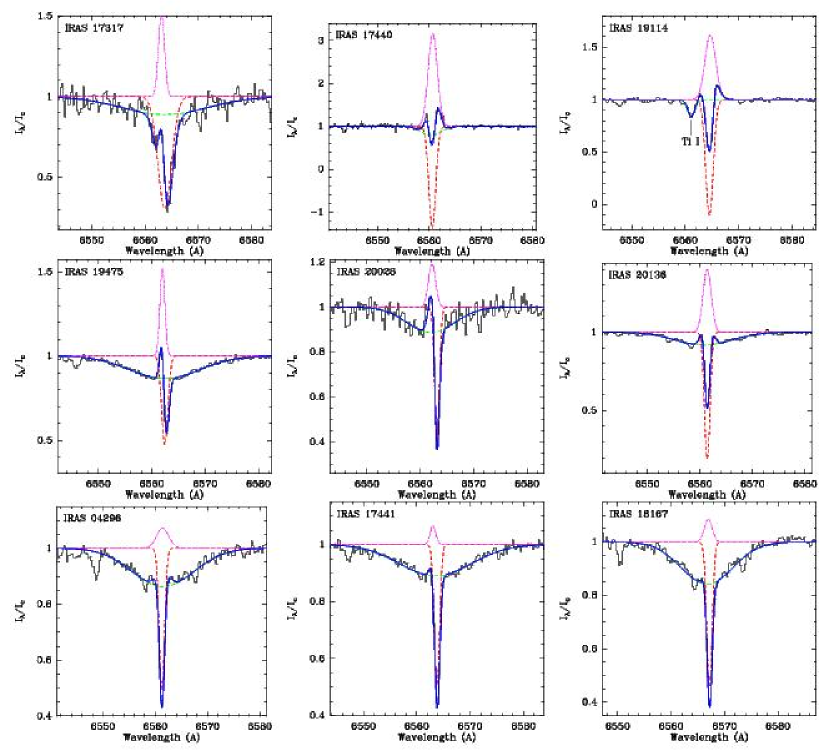
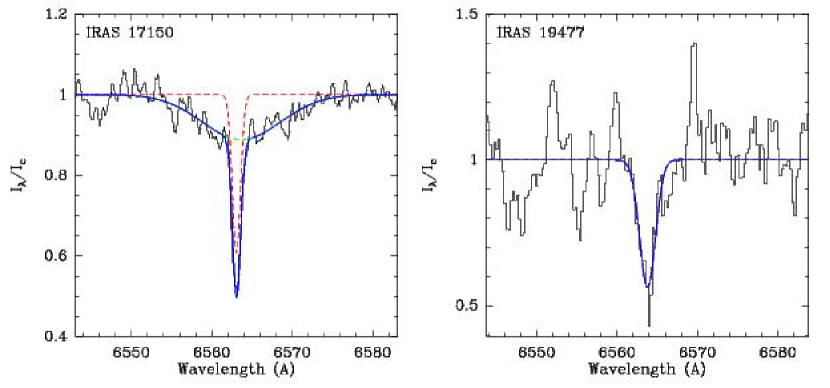
In most of the objects showing H absorption (Fig. 3), the line profile is found to be partially filled with emission (see a detailed fitting of the different absorption and emission components of the profile in § 4.1.) We refer to this objects as emission filled absorption sources (efA). The emission component is quite prominent, reaching or exceeding the continuum level, for example, in IRAS 174403310, IRAS 191140002, and IRAS 194753119. In other cases, the H absorption shows a peculiar, structured profile with an emerging emission feature or “hump” bluewards of the narrow, deep absorption core: e.g. IRAS 042963429, IRAS 174412411, and IRAS 181671209. Such complex emission-absorption H profiles are most likely the result of the superposition of two lines of different origin: a photospheric absorption core and an emission component that originates in the stellar close surroundings (see further discussion in § 5.3). There are only two objects in our sample, IRAS 171503224 and IRAS 194772401, for which the H line presents a pure absorption (pA) profile, at least, within the limited S/N of our data. In a number of efA and pA objects, the H absorption profile has two components: a deep, narrow central absorption feature and broad absorption wings. Similar H profiles are typically found in F-type supergiants, in which the broad wings are most likely due to the Stark broadening mechanism operating at deep layers of the stellar atmosphere, whereas the narrow component is consistent with being formed in the low surface gravity photosphere of these stars. The blue emission-hump observed in the absorption profile of some objects is also commonly found in F-type supergiants.
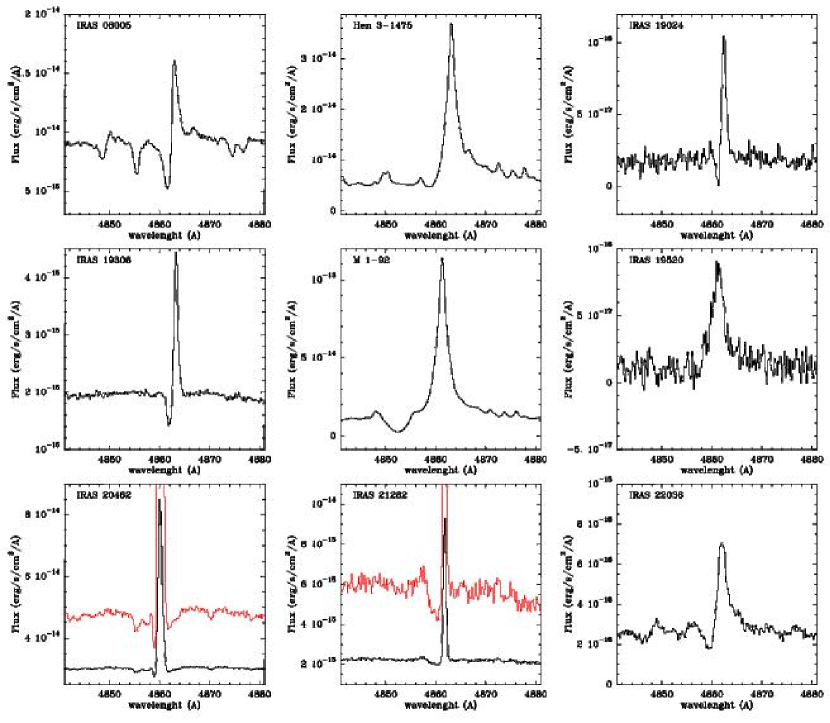
We briefly discuss now the profile of other recombination H I lines, whenever they are detected, and compare it with that of H. As expected, none of the 3 AGB stars with H non-detections show other H I lines either in absorption or emission. In the pPN IRAS 192921806, which is not detected in H because of low S/N in that spectral region, weak Paschen lines (from Pa16→3 at 8502Å to Pa9→3 at 9229Å) are seen in absorption. For pA and efA objects whenever other lines of the Balmer or Paschen series are detected they show pure absorption profiles — i.e. the incipient emission seen in H for efA objects is not visible in other H I lines. Among the two objects for which H is observed with a pure emission profile there are no other H I lines detected except for CIT 6, which shows H emission with a quite broad, most likely blended profile. Except for IRAS 175162525 and IRAS 225746609 (see below), all sources with H P Cygni profiles display the same type of profile in one or more of the Balmer lines and also, in some cases, in the Paschen series (observable in our ESI spectra from the Paschen discontinuity at 8200Å to Pa7→3 at 10049.4Å; note, however, that the Pa lines from upper levels =16, 15, and 13 at 8502, 8545, and 8665Å, respectively, are usually blended with the near-IR Ca II triplet and determining their profiles unambiguously is difficult). The P Cygni profile is more easily recognized and remarkable in H than in H, in which the intense emission wings partially infill the absorption component (see e.g. IRAS 212825050; Figs.2 and 4). The absorption component of the P Cygni profile appears more prominent (sharper and deeper) relative to the emission for bluer Balmer lines. This is partially an effect of the emission component becoming progressively weaker for the recombination lines from higher levels (which are expected to be less and less populated as the quantum number increases). In some cases, the emission component almost disappears completely for the bluest Balmer lines observed by us (H and H), resulting in a blue-shifted pure absorption profile. In contrast to the emission component, the absorption strongly depends on the population of level =2, which is the same for all the Balmer lines. IRAS 175162525 and IRAS 225746609 are the two only pcyg sources for which Pa lines are observed with a pE and pA profile, respectively, i.e. non P Cygni. (In both cases, the S/N in the spectral region of the Balmer series is too low to determine whether or not these lines are present.)
3.1.1 Variability of the H profile
We have noticed differences in the H profiles of some of our targets with respect to earlier observations. Here, we describe and briefly discuss such differences for compact (unresolved or marginally resolved) objects in which the observed variations most likely represent real changes, e.g. are unlikely to be due to the different slit width and orientation in our spectra and earlier datasets.
IRAS 191140002. Our H profile shows a narrow absorption feature (=6564.5Å) and two adjacent (blue- and red-shifted) emission components (Fig. 3). There is another absorption feature bluewards of H (=6561.1Å) that is most likely the Ti I 6559.57Å line as suggested by Začs et al. (1996). In fact, the center of the H absorption component and that attributed to the Ti I line yield a very similar value of the systemic velocity, =111 and 104 km s-1, respectively, in good agreement with earlier results from other absorption lines and CO measurements (e.g. Reddy & Hrivnak, 1999; Bujarrabal et al., 2001, and references therein). Začs et al. (1996) also observed a double-peaked emission component and a narrow absorption core in the H profile of this object, i.e. a shell profile, however, in our spectrum the red emission component is stronger than the blue one, in contrast to what these authors found. Moreover, the velocity difference between the two emission peaks measured by us, 145 km s-1, is larger than that observed by Začs et al. (1996), 128 km s-1.
IRAS 194753119. Variations of the H profile observed with ESI with respect to previous measurements are reported by Sahai et al. (2007a). Our H profile shows a broad absorption feature and a narrow inverse P Cygni shaped core (Fig. 3). The H profile observed by Klochkova et al. (2002) shows similar broad absorption wings, however, the line core shows two emission peaks neighboring a deep, narrow absorption feature. Klochkova et al. (2002) also present and compare their H profiles for three different epochs and show that the intensity of the red (blue) emission peak gradually increases (decreases) with time. The line-shape observed by us fits then quite well with the observed trend, representing the extreme case in which the blue peak has disappeared completely.
IRAS 204623416. Our H profile is different from that previously reported by Smith & Lambert (1994) and García-Lario et al. (1997), in particular, the blue-shifted absorption component of the P Cygni profile is less pronounced in our observations. These authors already noticed strong changes in the profile of H and other lines in a time-scale of days, which are interpreted in terms of mass-loss episodes (see also Arkhipova et al., 2001). We confirm such changes in some recombination lines, for example, we detect the He I6678Å line in absorption, however, this line has had a remarkable P Cygni profile in the past.
AGB stars: IRC+10216, CIT 6, and IK Tau. Line emission in long-period variable stars is known to be a transient phenomenon. H emission was not present in the spectrum of the C-rich variable star IRC10216 observed by Trammell et al. (1994) but was detected by Cohen & Schmidt (1982) as well as in this work. The other C-rich AGB star in our sample, CIT 6, has gone through emission-line phases showing intense Balmer line emission and other non-hydrogen lines like [O I], [N II], and [S II] suggestive of emission from a low-excitation shocked zone (Cohen, 1980; Cohen & Schmidt, 1982; Trammell et al., 1994). In our ESI spectrum, H appears much weaker than in earlier works and is blended with other (presumably metallic) lines with similar intensity. Finally, we do not detect H or any other emission lines in the O-rich Mira variable IK Tau, however, this object must have shown line emission in the past according to its M6e-M10e assignation in the General Catalogue of Variable Stars (GCVS).
3.2 Non-Hydrogen line emission spectrum
Most objects in our sample with intense H emission (i.e. pcyg and pE) also exhibit other emission lines by heavier elements. In two cases, namely, the yPNs M 1-92 and Hen 3-1475, the underlying stellar absorption spectrum is totally masked out by a wealth (hundreds to thousands) of emission lines by different neutral and ionized atoms, like He I, N I, N II, C I, O I, O II, S II, Fe I, Fe II,… (see full spectra of our targets in Fig. 1) — a comprehensive list of nebular emission lines identified in the optical spectrum of M 1-92 (many of them also detected in Hen 3-1475) is reported by Arrieta et al. (2005). The rest of the H-emitting sources in our sample, which is also the majority, show a small or moderate number of emission lines, lacking many of the intense forbidden emission lines typical of evolved pNe with hot (30,000K) central stars (e.g. van de Steene et al., 1996a, b). Although the spectrum of the two AGB stars in our sample with H emission, IRC+10216 and CIT 6, is clearly shaped by molecular (e.g. VO, TiO, and ZrO) absorption bands and metallic absorption lines typical of C-rich late type stars, several weak emission lines are also detected. Hydrogen and metallic emission lines are known to be present in the spectrum of long-period variables at certain phases of their pulsational cycle (e.g. Castelaz et al., 2000, and references therein). Such emission lines are interpreted as due to heating of the stellar atmosphere by shock waves. In these two objects we also detect very prominent C2 Swan bands 6059 (2,4), 6122 (1,3), and 6191 (0,2). To our knowledge, this is the first time that these particular bands are reported in these objects. In the spectrum of CIT 6, we also detect the band 5097 (2,2) and tentatively 5070 (3,3), 5635 (0,1), and 5585 (1,2). The Swan bands of the C2 molecule are commonly observed in C-rich stars and comets (see e.g. Klochkova et al., 1999; Bieging et al., 2006, and references therein).
Most sources in which H is observed in absorption, i.e. with a pA or efA profiles, have a spectrum dominated by absorption lines with no hint of nebular emission lines. The central stars of pA and efA objects all have F and G spectral types, therefore, the lack of emission lines is consistent with these relatively cool stars not being able to ionize a significant fraction of their circumstellar material. The are only three objects in which H is seen in absorption that also exhibit weak emission features: IRAS 042963429, IRAS 191140002, and IRAS 201361309. (We also find tentatively one weak emission line at 6604Å in the spectrum of IRAS 194753119, which could be identified with the very low excitation line Ni I6604.29Å.)
Two relatively intense emission features around 5632 and 5583Å are observed in the compact (unresolved) nuclear region of IRAS 042963429 (Fig. 1). These lines, which are very broad (FWZI5Å) and have a peculiar, triangular profile, are identified as the emission bands (0,1) and (1,2) of the Swan system of the C2 molecule at 5635 and 5585Å, respectively. The (0,0) 5165, (1,1) 5129, (0,2) 6188 C2 bands are also detected with a smaller S/N in our spectrum. The (0,1) and (0,0) Swan bands have been previously reported by Klochkova et al. (1999), whereas the other three vibrational transitions are reported by us for the first time. The emission band (1,0) 4735 is absent in our spectrum as well as in that presented by Klochkova et al. (1999). Hrivnak (1995), however, report detection of this band in absorption from low-resolution spectra. We confirm the presence of a weak emission feature around 4071Å previously noticed by Hrivnak (1995). This line roughly coincides in wavelength with an emission feature (attributed to a blend of [S II] lines) observed in the C-rich pPN CRL 2688. There are two other unidentified emission lines in the spectrum of IRAS 042963429 at 8065.6Å and 8102.9Å. The narrow profile of these emission features is consistent with being atomic or ionic lines rather than molecular bands.
There are only 2 emission lines (other than H) observed in the spectrum of IRAS 191140002 that we identify as the [Ca II] 7291.47,7323.89Å doublet. These lines, which arise in the compact (unresolved) circumnuclear region, are also observed in other objects in our sample: IRAS 175162525, M 1-92, Hen 3-1475, IRAS 220365306, and IRAS 080052356, and tentatively in IRAS 195202759. (We can’t rule out or assert the presence of these lines in the spectra of IRC+10216 and CIT 6, which display many emission lines strongly blended in that region). Since calcium has among the highest gas phase depletions, detection of these lines indicate that calcium is not depleted onto dust grains either because the [Ca II] doublet emission arises in a dust-free environment or because Ca is liberated from the grains. We consider grain destruction by moderate-velocity shocks a likely explanation in the case of IRAS 191140002 and, more generally, for the pPNs and yPNs in our sample with [Ca II]-emission (see e.g. Hartigan et al., 1987). Moderate speed motions are in fact deduced from the FWHM of the [Ca II] doublet in our targets, which range between 40 and 100km s-1. These values are larger than the typical expansion velocities of AGB CSEs and probably result from shock-acceleration produced by the pAGB-to-AGB wind interaction (§ 1). It is worth mentioning that the [Ca II] doublet is also observed in the young stellar object IRAS 05506, which shows a low-excitation shock spectrum (Sahai et al., 2008). The critical density for the [Ca II] doublet is 106 cm-3, therefore, emission of these lines arises in a relatively tenuous gas.
We detect a few weak emission lines in IRAS 201361309 (Fig. 1). Some of these features are also present in the spectra of the yPNs M 1-92 and Hen 3-1475 and the pPNs IRAS 080052356 and IRAS 220365306, for example, the emission around 5955 and 7911, which we tentatively identify with Fe I 5956.7Å and Fe I 7912.8Å, respectively, or the lines 7083 (Ti I 7084.2Å or C I 7085.5Å?) and 8045Å ([Cl IV] 8045.6Å or Mg I 8047.7Å?).
4 Analysis
4.1 Parameter analysis of the H-profile
The presence of H emission from the compact nebular core displaying either a pE, pcyg, or a structured efA profile is interpreted as an indication of on-going (i.e. pAGB) mass-loss most likely in the form of a stellar wind (see also § 5). In this section, we parameterize and analyze the observed line profiles, which is needed to derive information on the current stellar wind and other processes that may be affecting the observed line shape.
4.1.1 Pcyg and pE sources
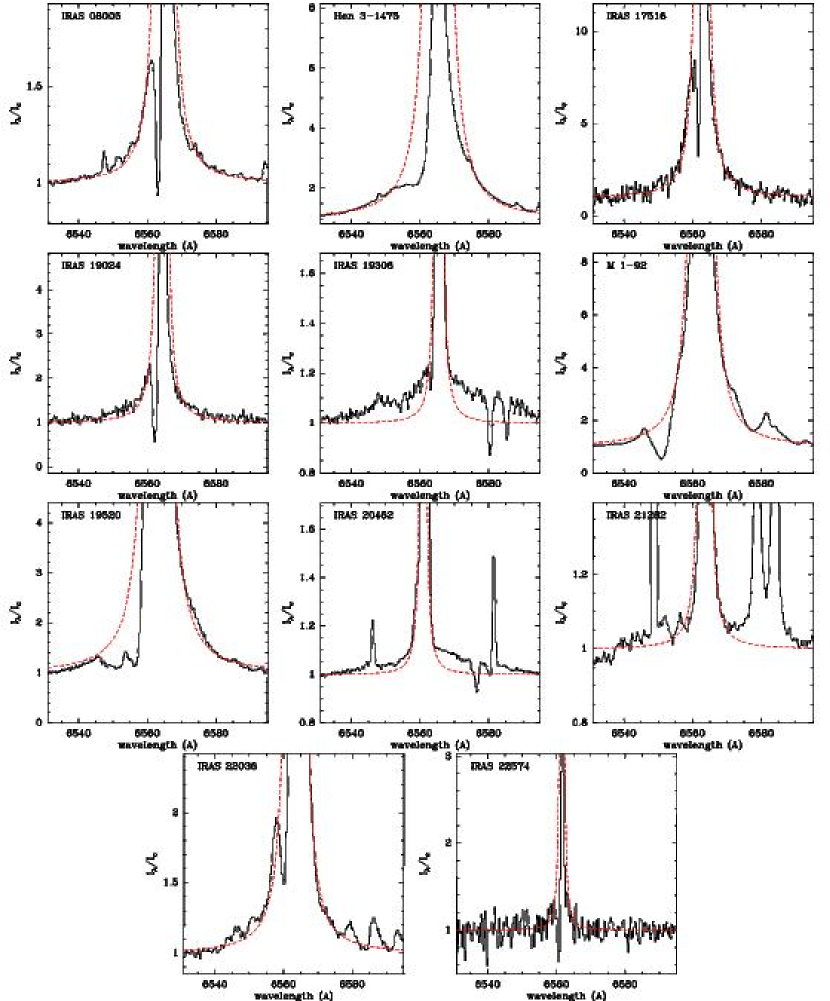
The parameters used to describe the H profile for pcyg and pE sources are given in Table 3. The emission component of the H profile consists of an intense core plus weak broad wings. In pcyg sources, the blue emission wing is affected by absorption, therefore, in order to estimate the full width at half maximum (FWHM) of the emission and absorption components separately in these cases, we have fitted a Lorentz profile to the line emission core and wings. The observed H profile has been subtracted from the Lorentzian fit to retrieve the absorption line-shape. In doing so, we are implicitly assuming that the intrinsic emission profile as produced in the nebula nucleus (i.e. before being altered by the absorption) is symmetric. Except for the FWHM of the absorption and emission lines, the rest of the parameters in Table 3 have been measured directly on the observed profile to avoid uncertainties resulting from the quality of the fit and/or the validity of our assumption of an intrinsic, symmetric emission profile. Accordingly, the equivalent widths, , given in the table333Although is normally defined to be positive (negative) for an absorption (emission) line, we express both the absorption and emission as a positive value for simplicity. represent the total (emission plus absorption) equivalent widths. For pcyg sources, is then a lower limit to the equivalent width of the intrinsic nuclear emission. Given the typical depth of the absorption feature, the emission is expected to be underestimated only by a small factor (less than 2). The parameters of the absorption component and are, respectively, the Doppler shift of the centroid and the blue edge of the absorption feature relative to the emission peak, which is located at LSR , in km s-1. The values of the full width at zero intensity level (FWZI) depend on the noise level in our spectrum and, therefore, they must be regarded as lower limits. Among the three objects with pE H profiles, the presence of broad wings is only confirmed for IRAS 193742359. In this case, however, the total width of the wings is uncertain partially due to the limited S/N of the spectrum and the poorly characterized shape of the underlying continuum. For the pE source CIT 6, the H line is strongly blended with other emission features and, therefore, the line parameters, which are expected to be very unaccurate, have not been calculated.
In order to study whether Raman scattering could explain the broad wings, we also fitted the profile of the H wings with a function of the type Iλ , which is expected if the wings are due to Raman scattering (see discussion in § 5.1). As shown in Fig. 5, the fits are satisfactory for all sources except for IRAS 193061407 and IRAS 204623416, which display wings significantly more intense than the synthetic profile. In these two cases a shallower power law, e.g. of the type , is needed. We note that IRAS 193061407 and IRAS 204623416 are among the objects with the broadest wings.
As shown in the table, the FWHM of the H core emission ranges between 50 and 200km s-1, whereas the wings reach widths of up to 2000km s-1. The mean velocity of the bulk of the gas producing the absorption ranges between 50 and 500km s-1, however, larger outflow terminal velocities of up to 800km s-1 are observed (see § 5.1). No correlation has been found between the FWHM of the H core component and the FWZI or of the line (Table 3). We also investigated the correlation between the H-line parameters and the stellar spectral type but no obvious trend has been found: although it is true that the largest equivalent widths (100Å) are observed for objects with hot, O- and B-type central stars, very small values of (20Å) are found for IRAS 193061407, IRAS 204623416, and IRAS 212825050, which have central stars of similar early spectral types. The low values of in these cases are comparable to those measured in pcyg sources with stars with types later than B. For these cool (A through G) stars, no detectable H emission is expected at all if photoinization were the only excitation agent in the stellar wind. The relatively large values of found in these cases are consistent with shocks being an important ionization mechanism. Alternatively, the large values of may indicate an additional source of energetic UV photons (for example a hotter companion?). In a future work, we will attempt determining quantitatively the importance of shock excitation in the stellar wind using diagnostic diagrams for other emission lines arising in the close stellar environment.
The observed values of for objects with the hottest central stars in our sample are consistent with UV stellar radiation being the main ionization mechanism. In this case, the H-line flux is directly proportional to the number of Lyman continuum photons (NLy) emitted by the star. This is true if the H-emitting region is radiation bounded. Under this assumption, we have computed for H emission arising in a H II region around the star using the ionizing fluxes provided by Vacca et al. (1996) and Smith et al. (2002) for different spectral types and adopting a conversion factor from NLy per second to H luminosity of 3.16710-12 erg (Brocklehurst, 1971). The intensity of the stellar continuum near H, which is needed to calculate , has been estimated from the MV and values given by Vacca et al. (1996) and Maíz-Apellániz et al. (2004) (see also Cox, 2000). The flux that corresponds to the zero -band magnitude, 2.1910-9 erg s-1 cm-2Å-1, is taken from Fukugita et al. (1995). The nebular continuum has been also estimated and taken into account to derive . We find that the apparent dichotomy among pcyg sources with hot central stars of similar spectral types (with values of 100Å in some cases and 20Å in others) could easily result from uncertainties in the spectral classification. This is because NLy and, thus, are very sentive to the stellar for late-O and early-B stars. In particular, for class I sources with of 28.1 (B 0), 26.3, and 25 kK (B 0.5) we find values of of 300, 80, and 50Å, respectively, i.e. there is a factor of 6 in for a difference of only 0.5 spectral subtypes. (The steep decline of with is because the stellar SEDs peak near the Lyman discontinuity for [O,B]-type stars.) For O9 stars, we obtain predicted values of 1000Å, i.e. larger than observed (20 and 130Å, respectively, for IRAS 212825050 and IRAS 195202759). In the case of IRAS 212825050, whose central source may be a Wolf-Rayet [WC11] star, the discrepancy between the observed and expected value of is smaller since WR stars produce less Lyman continuum than non-WR stars with the same (see Smith et al., 2002). Values of smaller than those predicted could also result in the case of a matter bounded H II region, for example, a non-spherically symmetric H-emitting region: if the H emission arises in a disk or a shell with cavities along a given axis, a large fraction of the ionizing UV photons will escape along the poles.
4.1.2 EfA and pA sources
In order to estimate the relative Doppler shift (), equivalent widths (), and FWHM of the absorption and emission components of the H line for efA+pA sources we have decomposed the observed profile using different Gaussian functions (Figs. 6-7 and Table 4). Two absorption components, one narrow and one broad, are needed in most cases. For IRAS 194772401 and IRAS 191140002 we have only fitted one narrow absorption component, however, a weak broad absorption feature cannot be ruled out: for IRAS 194772401 such broad absorption may be well hidden within the low S/N of our spectrum, and for IRAS 191140002, it could be totally masked out by the relatively intense emission that fills in the absorption profile. For IRAS 191140002 and IRAS 174403310, the line parameters derived are especially uncertain, in particular, the errors in are probably larger than those quoted in the table. This is because the absorption features are almost completely filled in with the emission and, therefore, the fit to the different absorption components is poorly constrained. This leads to a poor determination of the parameters of the emission feature as well. Finally, the observed H profile for the pPNs IRAS 042963429, IRAS 174412411, and IRAS 181671202, which shows an emission “hump” bluewards of the narrow absorption core, can also be reasonably well fitted without the emission (line parameters with or without the emission component are given in Table 4). Therefore, although the line shape is better reproduced including a weak emission feature, the line parameters derived for this component are somewhat uncertain.
Although the profile of photospheric absorption lines may be better represented by a Lorentz or a combined Lorentz-Gaussian (Voigt) function, we don’t expect the parameters derived using these more complex functions to be significantly different than those in Table 4 given the good match between the Gaussian fit and the observed line shape. Another way of attempting the characterization of the emission component in efA sources is to subtract from the observed profile a synthetic absorption line obtained from stellar atmospheric modeling. However, for an accurate characterization of the fundamental stellar parameters that determine the shape of the absorption profile, such as , gravity, turbulence velocity, etc, we need to identify and fit simultaneously not only H but all the absorption features in our spectra, which is beyond the scope of this paper.
4.2 Spectral classification: line absorption spectra
We have used our ESI and MIKE spectra to derive the spectral type of our targets and investigate the correlation of this fundamental stellar parameter with the type of H profile. For some of our targets, there was already an estimate of the spectral type available in the literature (see e.g. “The Torun catalogue of Galactic pAGB and related objects” at http://www.ncac.torun.pl/postagb and references given therein). Whenever no, or uncertain, spectral classification was found, we estimated the spectral type by comparing the normalized spectra of our targets with those of template stars obtained from published stellar libraries. Note that the slope of the continuum cannot be safely used for spectral classification due to the uncertain flux calibration in the majority of the objects in our sample, which were observed under non-photometric conditions, and also because these objects are expected to be very reddened by large amounts of dust in their envelopes. We have also double-checked the spectral types previously assigned to our sources. Our template spectra have been taken mainly from the Library of High-Resolution Spectra of Stars from the UVES Paranal Observatory Project (Bagnulo et al., 2003, http://www.sc.eso.org/santiago/uvespop/interface.html). We have also used as secondary templates some of our own targets for which a reliable spectral classification was already assigned, e.g. from detailed studies of the stellar parameters through model-atmosphere methods. We have assumed luminosity class I for our objects. For several sources, this assumption is in fact confirmed from the strength of the luminosity-dependent O I infrared triplet (§ 4.3). The main reference used for line identifications and laboratory wavelengths is the NIST Atomic Spectra Database (Version 3.1.0). In Table 2 spectral types obtained from this work are given using bold-face font.
In the following we briefly discuss the spectral types assigned in this work to individual sources with no spectral type available from the literature and objects for which our spectral classification does not agree with previous assignations.
IRAS 042963429. The central star of this object was classified as a G0 Ia supergiant based on low resolution optical spectra by Hrivnak (1995). Detailed chemical analysis and determination of atmospheric parameters on the basis of high-resolution spectra performed by different authors, however, indicate a higher effective temperature of 6400-7000 K (Klochkova et al., 1999; Decin et al., 1998; Van Winckel & Reyniers, 2000). By comparing our high-resolution data with F and G UVES template standards we find that the spectrum of IRAS 042963429 is, in fact, inconsistent with a G spectral type (e.g., Paschen lines are extremely weak in G-type stars) but, rather, supports the classification of the central star as an early-F. In particular, the best match is obtained with the UVES standard HD 74180 (F3 Ia).
IRAS 055062414. This enigmatic IRAS source, which is most likely associated with a YSO, was serendipitously discovered in our survey of pPNs ( see § 2.3 and Sahai et al., 2008). Its central source is listed as an M 6 in the SIMBAD database. Our ESI spectrum, however, is not consistent with such a late spectral type (note, e.g., the remarkable differences with respect to the spectra of M-type stars in our sample). The deep infrared Ca II triplet together with the absence of the Paschen series is indicative of a G-K star. Considering also the number and depth of metal lines in the 8400-8800Å window, e.g. Ti I and Fe I lines, we assign a spectral type G9-K2 to the central source of this object.
IRAS 171503224. The central star of this object has been previously classified as G2 I based on a low-spectral resolution spectrum in the 4000-6800Å range (Hu et al., 1993). However, the density and depth of the lines across the whole wavelength range observed with MIKE is most consistent with an F3-7 spectral type. (The windows 3890-4600, 5200-5400, 5800-6400, and 7050-7250Å are particularly useful for discriminating between F and G spectral types.) In particular, the shape of the profile of the Ca II H&K lines (at 3950Å) indicates an F3-7 star. The spectrum of the template UVES star HD136537, which is a G2 II, has a much more dense absorption line spectrum and the lines are deeper than in IRAS 171503224.
IRAS 173172743. The central star of this object is classified as a F5 I based on a low-resolution optical spectrum in the 4000-6900Å range by Suárez et al. (2006). We observe very deep near-IR Ca II triplet lines (in the 8500-8700Å range), which is consistent with an F or G spectral type. However, the absence of Paschen lines series indicates a G-type star. The spectrum of IRAS 173172743 best resembles that of the UVES template star HD 204075, which is a G4 Ib.
IRAS 174403310. There is no previous spectral classification for this object available in the literature. The spectrum of IRAS 174403310 is quite similar to that of IRAS 171503224 suggesting an F-type star. In the region of the Ca II H&K lines as well as in the 5200-5400, 5800-6000, and 6100-6300Å ranges, which are particularly useful to distinguish between early and late F spectral types, the spectrum of IRAS 174403310 is most consistent with an early-F spectral type. In the following we adopt an spectral type F3 I given the good agreement with the spectrum of our template UVES star HD 74180 (F3 Ia).
IRAS 175162525. No previous spectral type assignation is reported for this object. We are unable to obtain an accurate spectral type for this source since our ESI spectrum does not show any absorption lines but rather is dominated by nebular emission lines. The shape of the spectrum at long wavelengths enables ruling out an M-type classification. We note the remarkable similarity between the line-emission dominated spectrum of IRAS 175162525 and that of IRAS 19520+2759, especially redwards of 7400Å. Since the latter is tentatively classified as an O9 (see below), this may suggest a hot central star also in this case.
IRAS 181671209. There is no previous spectral classification for this object available in the literature. Its spectrum is similar to that of IRAS 191140002, suggesting a mid- or late-F type. The shape of the profiles of the near-infrared Ca II triplet and Paschen lines in the range 8400-8900 as well as the number and depth of the lines across the wavelength range covered by ESI (but particularly in the 5000-5600 and 6100-6300Å windows) are very similar to those observed in the UVES template star HD 1089668, F7 Iab.
IRAS 192921806. No spectral classification has been previously reported. The S/N in our spectrum is too low in most of the wavelength range observed, including the region around H. Relatively weak Paschen lines are seen in absorption in the 8400-8900Å window, which may indicate a B spectral-type in this case.
IRAS 193061407. Discrepant spectral types have been previously assigned to the central star of this object by Kelly & Hrivnak (2005) (B0:e) and Suárez et al. (2006) (G5). Both works are based on low-resolution optical spectra. A value for the stellar temperature of =21,000 K, typical of a B1 type star, has also been found by Lowe & Gledhill (2007) from detailed SED modeling leaving the stellar temperature as a free parameter. The absence of the near-IR Ca II triplet in our ESI spectrum argues against a G- or even an F-type assignation. Our ESI data support a B0-1 type central star based on the presence of relatively intense He I lines (e.g. at 5876 and 6678Å), the density and depth of many metal absorption lines, e.g., in the 4500-4700 and 5600-5800Å ranges, which are typical of early-B stars, and the relatively weakness of the Paschen lines. The presence of the C II lines at 6578.05 and 6582.88Å in IRAS 193061407 further supports its B-type classification, since these lines are very prominent in B-type stars but extremely weak or absent in other spectral types. In the following we adopt a spectral type B0-1 I given the similarity between IRAS 193061407’s spectrum and the template UVES stars HD 112272 (B0.5Ia) and HD 148688 (B1 Ia). Discrepant spectral types for this target (and other objects) are discussed in detail in Appendix A.
IRAS 193742359. The spectrum of this source is similar to that of IRAS 193061407, suggesting a B-type also in this case. The very weak P lines, the absence of metallic lines in the blue, e.g., in the 5100-5400 region, the presence of the He I 6678Å line, and the very deep C II 6578,6583Å lines, unequivocally indicate an early B-type star. The absence of strong metallic lines in the 5600-5700Å range and the relatively strong O I triplet suggest a spectral type later than B2. The spectrum of IRAS 193742359 best resembles that of the UVES template stars HD 168625 (B2/5 Ia) and HD 105071 (B6 Ia/Ib), therefore, we adopt an intermediate B3-6 I classification.
IRAS 194772401. Suárez et al. (2006) classify the central star of this object as an F4-7 I based on low-resolution optical spectra. We find, however, that the spectrum of IRAS 194772401 is rather different from those of objects with F3-F7 I central stars in our sample (see Table 2 and Fig. 1). The spectral differences are especially noticeable in the 8400-8900Å window, in which the weak Paschen lines and strong near-IR Ca II triplet lines are indicative of a later spectral type. The spectrum of IRAS 194772401 is most consistent with the UVES template G0 Ia star HD 174383.
IRAS 195202759. There is no previous spectral classification for this object in the literature. Spectral typing is difficult in this case, since the spectrum of IRAS 195202759 is dominated by intense nebular emission lines. The spectrum of this object shows a general lack of absorption lines, suggesting that it has a fairly hot star. For example, there is a clear absence of lines in the wavelength window around 5700Å. This region shows the presence of numerous lines for B1 Ia spectral types (see, e.g., our ESI spectra of IRAS 204623416), but not for hotter spectral types, e.g., O9 Ia. The line absorption spectrum of IRAS 195202759 is similar to that of IRAS 212825050, which is classified as an O9.5 I. Therefore, we tentatively assign a similar spectral type, O9, to this source.
IRAS 200283910. The central star of this object has been previously classified as a G4 (Kelly & Hrivnak, 2005, and references therein). The presence of the near-IR Ca II triplet is consistent with both a G and F type, however, the depth of the Paschen lines indicates a spectral type earlier than G0. The spectrum of IRAS 200283910 is very similar to that of IRAS 042963429, IRAS 181671202, IRAS 174412411, which suggests a mid-F classification. In fact, the relative intensity of the Ca II triplet and Paschen lines is most consistent with an F3-7.
IRAS 201361309. The central star of this object has been previously classified as a G0:I (Kelly & Hrivnak, 2005, and references therein). The spectrum of this object is similar to that of IRAS 200283910. It shows very deep near-IR Ca II triplet lines and relatively intense Paschen lines indicative of a mid- or late-F spectral type. The number and depth of many metal lines across the spectrum as well as the shape of the profile of the Ca II H&K lines support an F3-7 assignation.
IRAS 225746609. There is no previous spectral classification for this object. Since IRAS 225746609 is very faint in the optical (21.3), our spectrum has a poor S/N at wavelengths shorter than 6500Å and no absorption features are identified in this region. The infrared window 8300-8900Å is, however, very useful for spectral typing: the depth of the Ca II triplet lines, which are very weak, and their relative intensity with respect to the Paschen lines constrain the spectral type to A1-6. The best-matching UVES template star is HD 80057, which is an A1 Ia.
4.3 Luminosity and distance
The combined strength of the lines at 7771.94, 7774.17, and 7775.39Å of the O I 7773Å infrared triplet has been established as a powerful measure of the stellar luminosity (e.g. Arellano Ferro et al., 2003, and refereces therein). These lines form as a result of upward transitions from the metastable level, which has a high excitation potetial of 9.15 eV, to the levels of neutral oxygen. The O I infrared triplet is particularly strong in supergiants, especially for class Ia objects, and is easily observable for stars with spectral types from middle B to early G. For later G-type stars the O I 7773Å feature weakens progresively (Faraggiana et al., 1988).
We have used the relationship between the absorption equivalent width of the triplet, (O I), and the absolute visual mangitude of the star, , calibrated by Slowik & Peterson (1995), to derive the luminosity class of the objects for which the O I 7773Å feature appears in absorption. The O I triplet is partially resolved in our observations, i.e., the 7771.94 line is observed partially separated from the 7774.17 and 7775.39, which appear blended. For IRAS 080052356, Hen3-1475, and IRAS 22036+5306, (O I) cannot be accurately measured because the O I 7773Å feature shows a P Cygni profile and we cannot rule out some underlying O I emission partially filling the absorption. In addition, the O I lines may be blended with some other absorption features falling in that wavelength range. Therefore, we have not estimated for these objects. The derived values of (Table 5) agree quite well (within 0.2m) with the mean of obtained from eqs. [1] and [2] by Arellano Ferro et al. (2003). (These authors obtain two separate relationships between and the equivalent width of the O I 7771 line, eq. [1], and the O I 7774+7775 blend, eq. [2].). This agreement indicates that the -(O I) relationship used is valid for the domains A1-G8 and from 9.5 to 0.35, i.e, for the spectral and domain covered by most of our targets. One exception may be IRAS 191140002, with a very large value of consistent with this object being a luminous, massive star. We note, however, that the relative atmospheric oxygen abundance of its central star has been found to be 0.5 dex higher than that in normal F supergiants (Začs et al., 1996; Reddy & Hrivnak, 1999), which could result in an overestimate of the luminosity as derived from the -(O I) relationship. The -(O I) relationship may not provide reliable estimates of the luminosity either for the yPNs IRAS 193061407, IRAS 193742359, and IRAS 225746609, which have B-type central stars.
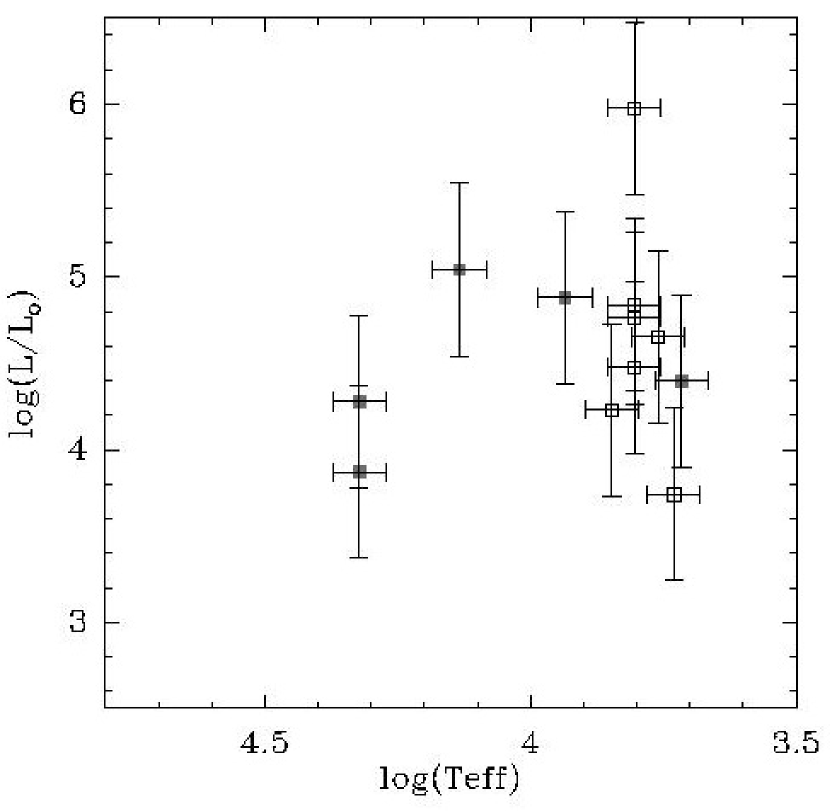
The errors of are expected to range between 0.7 and 1.2m, taking into account the errors in the coefficients of the -(O I) relationship and the error of our measurement of (O I), which is expected to be 0.1Å. As shown in Table 5 most objects have (O I)1Å. These high values are restricted to Class I sources (Thomas et al., 1979), implying luminosities of 104-105. In particular, according to these authors (see their Fig. 1) and taking into account the spectral type of our targets (Table 2), the large majority of our sources belong to luminosity class Ia. IRAS 201361309 and IRAS 194772401 are the two only objects that are most consistent with class Ib. We also find that the value of (O I) measured for IRAS 193061407 is comparable with, but slightly larger than, the expected value for a B0-1 Ia star. We have estimated the total luminosity () for objects in Table 5 using the values of the bolometric correction (B.C.) that correspond to their stellar spectral types.
By comparing the position of our targets in the HR diagram (Fig. 8) with theoretical evolutionary tracks for pAGB objects, we find that a significant fraction of our targets (10 out of 13 with (O I) measurements) seem to have central stars with high remnant masses of 0.8, which would point to initial masses of 3 (Bloecker, 1995). IRAS 20462+3416, IRAS 20136+13090 and IRAS 19477+2401, are most consistent with lower remnant masses of 0.6, implying initial masses of 3. Note, however, that the large errorbars in the luminosity, 0.5, together with the uncertainties arising in the evolutionary models themselves and the initial-to-final mass relationship, prevent us from obtaining accurate values for the masses.
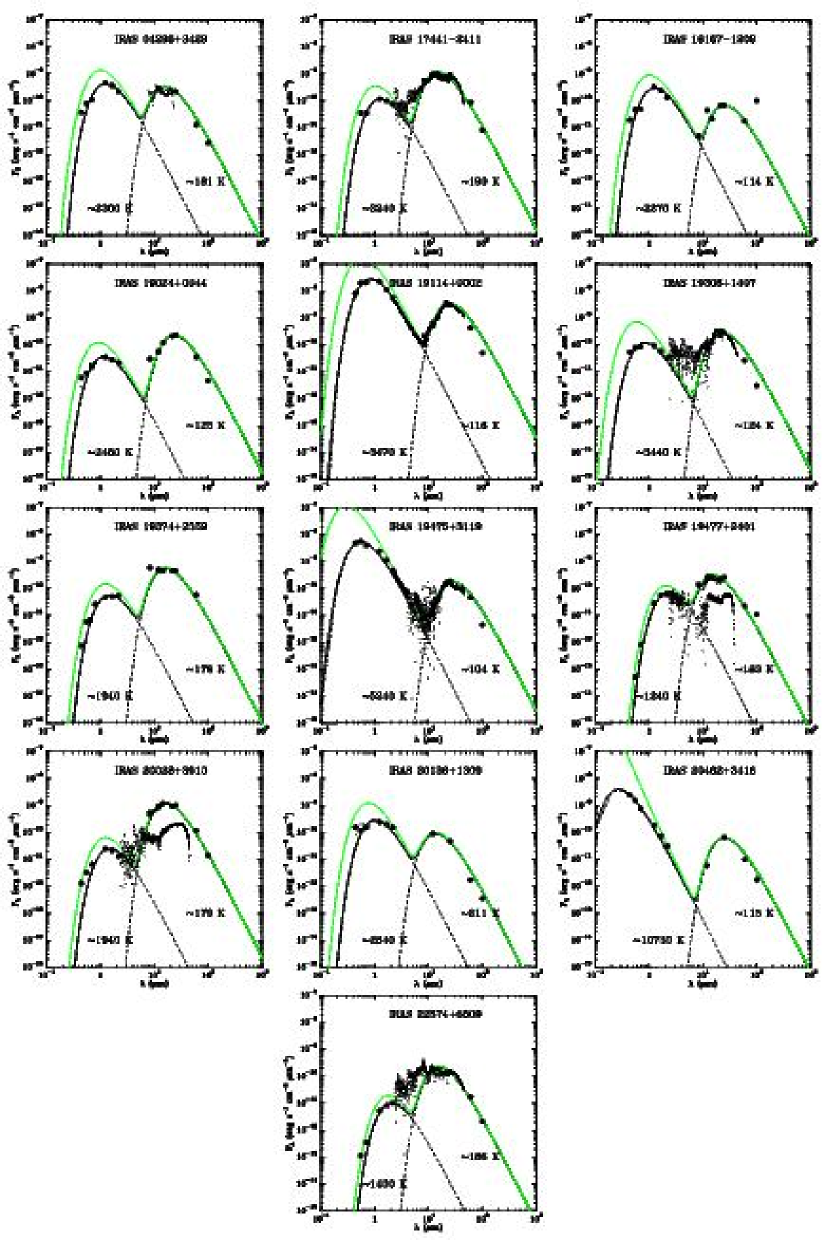
We have computed the luminosity of our objects, , by integrating their SEDs. We have fitted the double-peaked SEDs by two blackbody curves, one representing the reddened stellar photosphere, which is mainly visible from the optical to the NIR, and the other representing the emission at longer wavelengths by cool circumstellar dust (Fig. 9). The sum of the integrated fluxes of the two blackbodies represents . By comparing the values of with we have obtained upper limits to the distance, , to our objects (Table 5). The upper limits arise because the total luminosity derived from the observed SED is probably underestimated. This is mainly because our SEDs are not corrected by interstellar extinction, which can be quite large given the proximity of our targets to the galactic plane (see below). Correcting for interstellar reddening, however, is not straightforward since the total amount of extinction along the line of sight towards our sources depends on their unknown distances. Moreover, in some objects there is a clear excess of emission in the 2-10µm range, that is, between the star and cool dust blackbody curves, denoting the presence of warm dust (see e.g., IRAS 174412411, IRAS 193061407, and IRAS 22574+6609; Fig. 9). Since this component is not included in our simplified two-blackbody model, the value of derived from the model SED is a lower limit to the total luminosity.
We show now that the interstellar extinction correction factor can be significant in some cases, even if the total extinction is not extremely high (typical values of the interstellar extinction range between =1 and 4 mag). The reddening correction is particularly important for objects with the stellar component of the SED peaking shortwards of 1µm. To illustrate this, we have corrected the SED of IRAS 20462+3416 for a value of 1 mag and adopting a power law for the extinction curve. The extinction-corrected value of is almost a factor 3 larger than that in Table 5, which translates into a non-negligible factor of 1/1.7 for the distance. The effect of interstellar reddening is also exemplified in Fig. 9, were SEDs corrected by an average value of =2.5 mag are shown.
Finally, there are additional sources of errors that may be affecting our values of in Table 5 such as the typical uncertainties in the spectral classification of the central star (of a few sub-types), which affects B.C. and , and the fact that the reliability of the -(O I) relationship is not well tested for highly evolved objects, specially C-rich stars, in which the Oxygen abundance may differ significantly from solar. Also, for objects with an equatorially-enhanced density distribution, very common among pPNs, the luminosity computed from the integrated SED depends on the viewing angle, especially when a significant fraction of the light is scattered by the nebular dust (see e.g. Su et al., 2001, for a quatitative estimate of viewing angle effects on the SEDs of non-spherically symmetric nebulae.). High polarization values, implying mostly scattered light, are indeed observed for some objects in our sample (e.g. Trammell et al., 1994; Gledhill, 2005; Oppenheimer et al., 2005; Bieging et al., 2006, and references therein).
4.4 Correlations
Correlations between the type of H profile and other stellar and envelope parameters have been investigated.
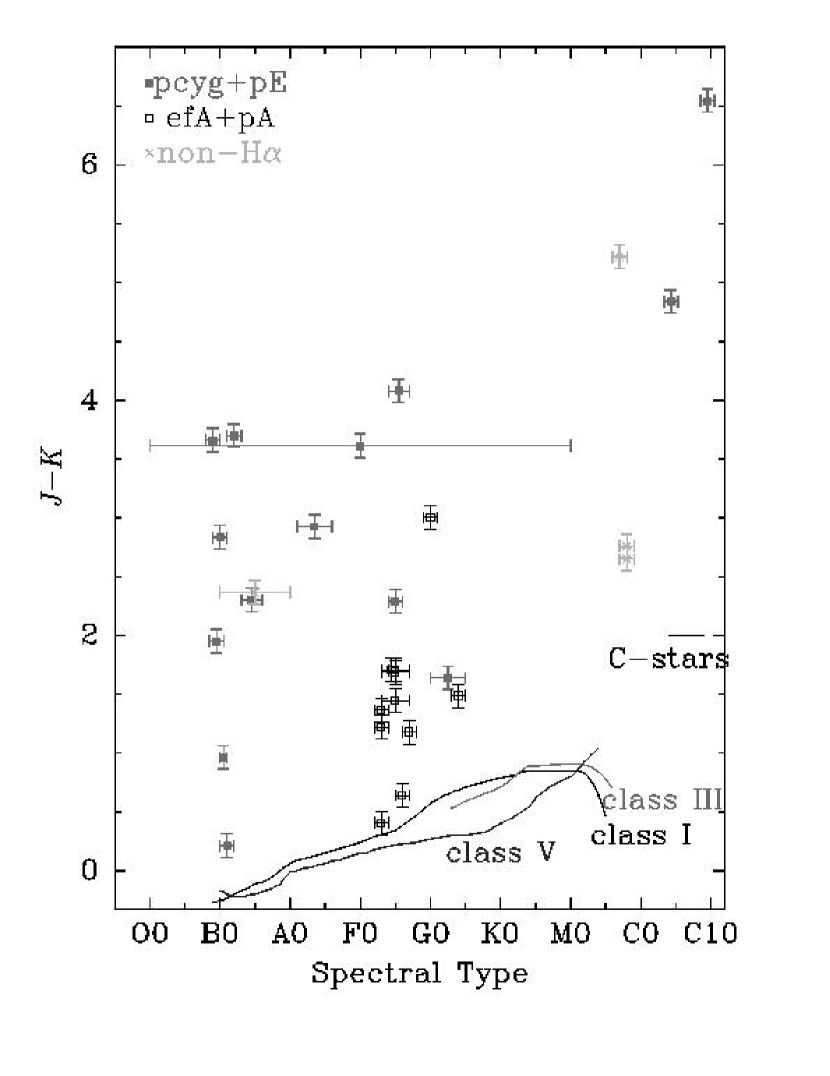
Spectral type of the central star. We have found a noticeable, and somewhat expected, correlation between the H profile and the stellar spectral type. First, there is a deficiency of H emitters among AGB stars. 3 out of 4 of the H non-detections are AGB stars with M or C spectral types. There are only two late-type stars in our sample showing H emission, namely, IRC+10216 and CIT 6. In these cases, the H emission is quite weak (4Å) compared with that observed in the majority of the H emitters (Table 3). This weak H emission is most likely temporary, since it was absent in the spectrum of these cool objects in earlier observations (§ 3.1.1). Second, as shown in Table 2 and Fig. 10, all objects in which H is seen in absorption, i.e. efA+pA sources, have late-type (F-G) central stars. In constrast, the distribution of spectral types for H emitters, i.e. pcyg+pE sources, is much broader, including objects with spectral types ranging from O to G, with a relative maximum around B, and also very late types such as C. H emission is indeed expected in objects with [O,B]-type central stars, whose UV radiation field ionizes the circumstellar material, producing an H II region observable through Balmer line emission (§ 4.1.2). For objects with mid or late spectral types, lacking in photoinizing photons, a likely mechanism for producing H emission are shocks. For non-pulsating stars, such shocks probably result from the interaction between the inner layers of the AGB envelope, i.e. the slow AGB wind, and the fast pAGB winds, more recently ejected. In the two long-period variable stars with H emission in our sample, shocks could either arise in the pulsating stellar atmosphere, which is the normal interpretation for transient line emission in this type of objects (e.g. Castelaz et al., 2000, and references therein), or result from the AGB-to-pAGB wind interaction. We note that, in fact, such interaction must have started in these objects given the non-spherical morphology of their inner CSEs.
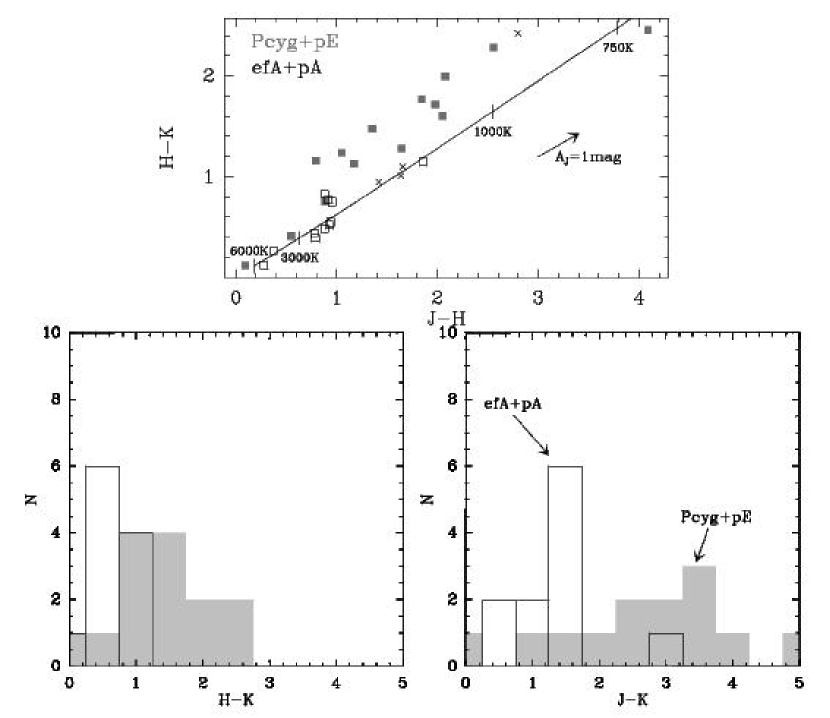
NIR and IRAS colors. NIR colors are sensitive to the presence of warm (500-1000 K) dust. The ()-() color-color diagram shows that pcyg+pE objects are redder than efA+pA sources (Fig. 11). This is also apparent in the histograms of any of the three NIR colors, especially and also shown in the figure. We have compared the observed values of with the intrinsic color ()0 for the spectral types assigned to our targets and found that the larger values of in H emitters do not result from their different distribution over spectral type with respect to efA+pA sources (Fig. 12). The larger color excess in pcyg+pE sources may be partially explained by a larger value of the total (interstellar+circumstellar) extinction. However, reddening cannot explain the loci of most of these objects above the black-body line in the ()-() color-color diagram given the direction of the reddening vector (from Schlegel et al., 1998, equivalent to a extinction power law). Scattering by nebular dust could also affect the observed colors. However, since the scattering efficiency is larger at shorter wavelengths, the scattering net effect is blueing of the incident light, and that will not explain the observed colors of pcyg+pE sources, which are redder than for a black body. While the NIR colors of efA+pA sources are consistent with the major contribution to the emission in the NIR bands being the reddened stellar photosphere, the position of pcyg+pE sources in the ()-() color-color diagram highlights the presence of warm dust. This warm dust component is in fact confirmed in some cases by a clear emission excess between 2 and 10µm, whenever such data exists (see SEDs of, e.g. IRAS 193061407 and IRAS 225746609 in Fig. 9). The warm dust component must be near the star and, therefore, has probably been formed recently. Then, the presence of warm dust could be an independent confirmation of substantial present-day mass-loss in pcyg+pE targets, which is evidenced in the first place by their intense, circumnuclear H emission. Alternatively, the warm dust component in pcyg+pE sources could be located in a long-lived disk around the central source rather than in the pAGB wind itself. Finally, we note that the NIR colors of the efA objects IRAS 171503224, IRAS 174412411, and IRAS 201361309 also suggests dust grains with higher temperatures than those in their detached, much cooler, AGB CSEs (see also full SEDs for the two later in Fig. 9).
We have compared the location of our objects with the larger, un-biased sample used by García-Lario et al. (1997). Our pcyg sources fall in regions III and IV defined by these authors, which suggest that the NIR colors of objects in such regions may result from recent mass loss leading to a hot dust component around the star. For a few of their objects for which optical spectroscopy was available, P-cygni H profiles were found. Our work has demonstrated that pcyg sources systematically lie above the black-body line in the NIR two-color diagram, displaying colors that are consistent with the presence of hot dust in the stellar vicinity most likely resulted from pAGB mass-loss. There are two pcyg objects, IRAS 204623416 and IRAS 193061407, with black body-like NIR colors (Fig. 11) that can be explained just by reddening of the stellar atmosphere. For these two pcyg objects, therefore, there are no indications of the presence of hot dust in the stellar vicinity although their P-cygni H profile indicates current mass-loss. In IRAS 204623416, significant spectral variations with time in the H line have been reported, pointing to episodic mass-loss events (§ 3.1.1). As suggested by García-Lario et al. (1997) the absence of significant NIR excess in this case could indicate that the duration and intensity of such mass-loss episodes are not enough to efficiently form and maintain hot dust grains in the circumstellar envelope.
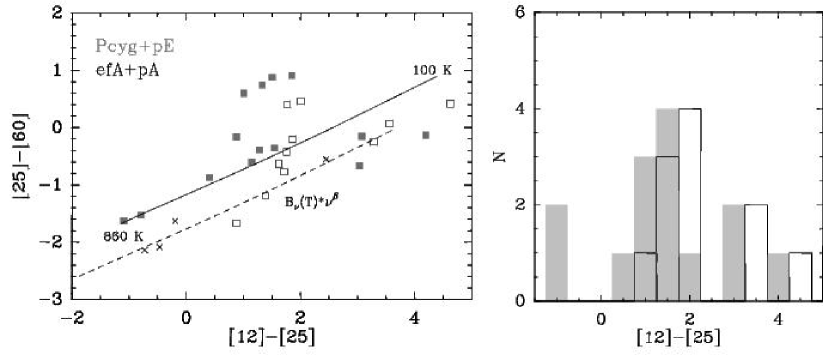
We have also found a correlation between the type of H profile and the IRAS colors, which are most sensitive to the cool (100-200 K) dust component that is remnant of the mass loss on the AGB (Fig. 13). The IRAS colors represented in this figure are defined as [12][25]=2.5(F25/F12) and [25][60]=2.5(F60/F25) with F flux density in Jy at the 12, 25, and 60µm IRAS filters. As can be seen, efA+pA sources display slightly larger values of [12][25], i.e. the slope of the SED between 12 and 25µm is steeper, than for pcyg+pE. This is consistent with a well detached envelope lacking significant amounts of warm dust in most efA+pA sources, which is indicated as well by their NIR colors (see above). The two groups of H profile sources clearly segregate in the two-color IRAS diagram: the majority of the pcyg+pE sources (64%) lie above the black-body line, whereas most efA+pA targets (73%) are below. This separation suggests different properties of the circumstellar dust in the AGB CSE among the two groups. The distribution of the sources below the black body line, which means that the emission at the longer wavelengths is smaller than expected for a black-body, can be explained by the dependence on wavelength of the dust optical depth, (normally 1-2) and the fact that the dust emission is proportional to ()(), with () being the Plank function for a given dust temperature . For optically thin dust emission the flux is, therefore, proportional to () (this is the so called “modified” black-body function), which explains the smaller emission at the longer wavelengths (Fig. 13). The location of the targets above the black body line in the IRAS color-color diagram means, as for the NIR, that their colors cannot be well represented by a black body or modified black body with a temperature. Such location must result from a larger temperature distribution of the dust over the envelope in pcyg+pE than in efA+pA sources. In particular, the observed effect suggests a significant contribution to the total emission by cold dust, especially at longer wavelengths (60µm), whereas most of the emission at shorter wavelengths (12µm) would be produced by a different component of warmer dust grains.
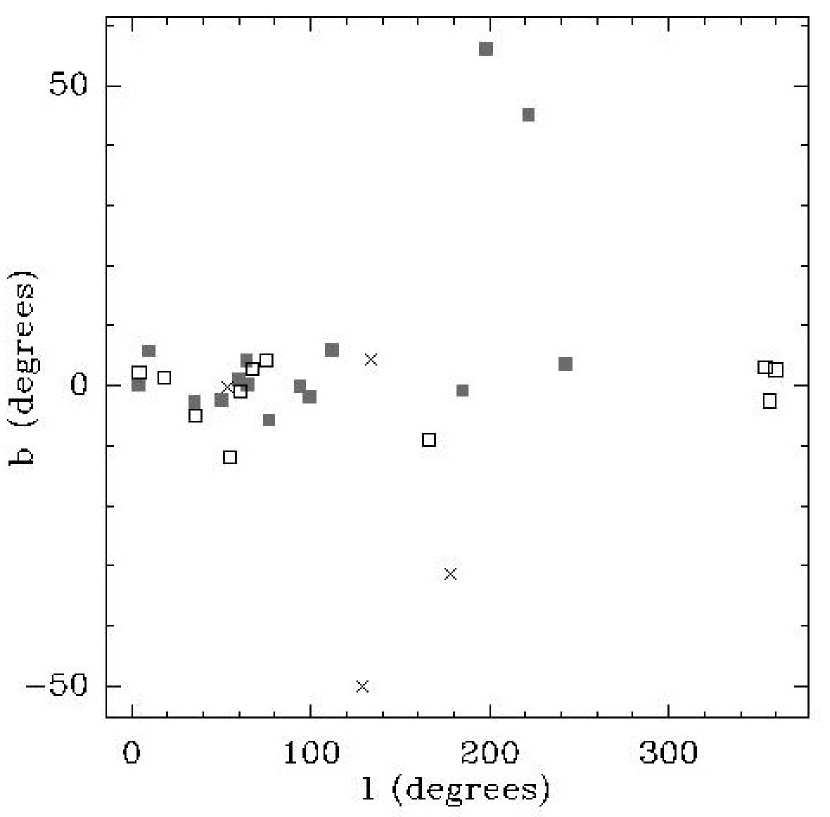
Galactic coordinates. We have not found any obvious correlation between the H profile and the galactic coordinates of our targets (Fig. 14). A correlation with the galactic latitude, , would have been proof of differences in the masses of the progenitor of both types of objects. We note, however, that most of our targets happen to be concentrated in a relatively small range of latitudes around =0°, so the dependence of H with cannot be properly studied. (The narrow range in in our sample results from the fact that OH/IR surveys, from which most our targets were selected, normally concentrate around the galactic plane.)
Nebular morphology. We find a variety of nebular morphologies in our sample but no obvious segregation with respect to the H profile has been found. There is nearly the same fraction of E, M, B, I, and stellar sources as well as w- and objects among H emitters and efA+pA targets (see Table 2 and references therein).
Chemistry. It seems that there is little connection, if any, between the chemistry and the characteristic of the H profile. There are more or less the same fraction of O- and C-rich objects among the H emitters and efA+pA sources. Among AGB stars, we find that the only objects with H emission are C-rich. Because of the small number of AGB stars in our sample and the expected variability of the H emission with the light curve, this trend cannot be regarded as a robust result.
5 Discussion
5.1 Fast pAGB winds probed by P Cygni like profiles
P Cygni profiles are known to be indicative of on-going mass-loss in the form of a stellar wind. The formation of typical P Cygni profiles can be understood qualitatively by a simple model of a spherically symmetric wind in which the velocity increases outwards up to a terminal velocity of the outflow . The wind material in front of the star is moving towards the observer and, therefore, absorbs the stellar continuum producing a blue-shifted absorption feature with a Doppler shift between and 0, relative to the source systemic velocity (). Except for the part that is occulted by the star, the rest of the wind, which forms a halo around the star, will produce broad line emission centered around with wings extending up to . The sum of the emission and the absorption at each Doppler velocity range leads to a so called P Cygni profile. These P Cygni profiles are often seen in UV resonance lines of the central stars of PNs (e.g. Perinotto, 1993; Kudritzki et al., 1997).
The H profiles observed in the majority of our targets differ from the typical P Cygni profiles described above. The emission component is not centered at but, rather is red-shifted in all cases, except for IRAS 212825050 (Table 3). Moreover, the terminal velocity of the outflow, as measured from the blue-shifted edge of the absorption feature, is smaller than that obtained from the edge of the red emission wing, and in some cases, e.g. the yPN M 1-92 (see below), the blue absorption is well detached from the line emission core. These peculiar H line-shapes can be explained if the emission and absorption form in two distinct nebular components, with different velocity fields and, more generally, affected by different broadening mechanism. In particular, we propose the following model: the broad line emission, characterized by a given (not necessarily P Cygni) profile, arises from a compact central source; the line emission (and stellar continuum) is scattered by dust in the walls of the nebular lobes, which should produce an overall red-shift of the line profile as a whole relative to as observed. The blue-shifted absorption is due to neutral or partially ionized outflowing gas inside the lobes absorbing the scattered photons along the line of sight. This results in a P Cygni like profile where the blue-shifted absorption is produced against the intrinsic emission profile. Such a model has been successful in producing a detailed fit to the spatio-kinematic distribution of the blue-shifted absorption and the red-shifted scattered line core in the H line profiles observed with STIS/ in the yPN Hen 3-1475 (Sánchez Contreras & Sahai 2001; see their Figure 1d for a sketch of our geometrical model). A similar scenario is proposed by Arrieta et al. (2005) to explain the P Cygni like profile of H and other recombination lines in the yPN M 1-92, which shows a very broad, blue absorption feature well detached from the emission component that cannot result from the single stellar wind scenario used to explain typical P Cygni profiles. Our interpretation is also consistent with the fact that most pPNs exhibit intrinsic polarization of the continuum as well as some emission lines, which are most likely due to scattering off dust grains (Trammell et al., 1994). In particular, Balmer lines seem to come from an H II region close to the star, which is blocked from direct view by, e.g., the thick equatorial dust waists commonly present in these objects, and are seen in reflection off the nebular dust (see also, e.g., Sánchez Contreras et al., 2002).
The nature of the outflow producing the absorption in pcyg sources is unknown, however, as in the case of Hen 3-1475, we argue that it is most likely a “pristine” pAGB wind from (or near) the central star that has not been strongly altered by its interaction with the progenitor AGB wind. The projected speed of the bulk of the material in the pAGB outflow, derived from the centroid of the blue-shifted absorption feature relative to the systemic velocity in our sample, is approximately 100km s-1 (Table 3); however the absorption features are quite wide and reach larger velocities at the edge indicating the presence of smaller amounts of material expanding as fast as, e.g., 800km s-1 in the case of IRAS 195202759. As for Hen 3-1475, it is plausible that a radial and or latitudinal velocity gradient exists in the outflows and/or that distinct wind components are present; the latter is suggested by the two different absorption features observed in the H profiles of a few objects (§ 3.1). Unfortunately, ground-based observations do not allow us to conclude on the isotropic or collimated nature of the pAGB winds probed by the observed P Cygni profiles, however, it is plausible that these are bipolar/multipolar ejections, as in Hen 3-1475 and, probably, M 1-92.
5.2 Broad H emission wings
The emission component observed in the H profile in our pcyg sources consists of an intense core plus weaker broad wings that reach widths (measured as the line FWZI) of up to 4000km s-1. The yet unclear origin of the very extended H wings, which are also observed in a number of PNs, has been discussed by Arrieta & Torres-Peimbert (2003). These authors consider several possible mechanisms for line broadening and conclude that Raman scattering of photons with wavelength close to Ly by neutral hydrogen is the most probable one in 12 of the 13 objects in their sample. In this scenario, Ly photons with a given velocity width are converted to optical photons that fill the H wing region. The conclusion of Arrieta & Torres-Peimbert (2003) is mainly supported by a) the fit of the H-wing profile to a law; b) the presence of other Raman features produced in emission; and c) the presence of a significant neutral hydrogen component. Criteria a) to c) are to be satisfied for the line wings to be attributable to Raman scattering.
We have checked whether or not the same conclusion can be drawn from our sample. As we have shown in Section 4.1, the H wings observed follow a law in all cases, except for IRAS 204623416 and IRAS 193061407. In these two objects, which happen to display H wings with similar widths and shapes, Raman scattering can be ruled out as the main line broadening mechanism. Arrieta & Torres-Peimbert (2003) found the same disagreement between the observed and predicted Raman profile for IRAS 204623416, which was also in their sample, concluding that a strong stellar wind is the most probable mechanism for line broadening in this case. We have searched for other emission features produced by Raman scattering in our spectra. In particular, we looked at the 6830 and 7088Å bands that correspond to the Raman-scattered O VI 1032,1038 doublet. Only four objects, IRAS 080052356, M 1-92, Hen 1475, and IRAS 220365306, show emission around 6830Å with FWZI150km s-1, and only in two of them, Hen 1475 and IRAS 220365306, a weak emission feature is tentatively detected around 7088Å with FWZI100km s-1 (Fig. 1). In contrast, Arrieta & Torres-Peimbert (2003) find these and other Raman features with large FWZIs of a few102-103 km s-1, i.e. comparable to the width of the H line wings, in most of their objects.
Since both the profile of the wings and the presence of a large column density of neutral hydrogen are necessary but not sufficient conditions for attributing the observed H-wings to Raman scattering, we cannot conclude that in our sample this is the main mechanism for line broadening except maybe for the four objects listed above showing other Raman-scattered emission features. Note, however, that the FWZIs of such features are significantly smaller than those measured in Arrieta’s sample and smaller than the H wings themselves.
As suggested by Arrieta & Torres-Peimbert (2003), further investigation of the effect of Raman scattering producing the line wings could be obtained by measuring the widths of UV lines produced in the same region as the Ly photons. This is because the width of the scattered H is proportional to the initial width of the Ly line, the Raman-scattering broadening factor being of /=6.4. We searched the IUE archive for UV spectra of our targets around the line Si III]1892Å, which presumably arises in the same region as Ly. Unfortunately, such data only exist for four objects and only in one case, Hen 3-1475, the Si III] line is clearly detected. The line, which was observed with the low spectral resolution (6Å) SWP, is found to be spectrally unresolved. Nevertheless, for Raman scattering being able to produce the observed 4000km s-1-wide H wings in Hen 3-1475, the Ly-emitting region must be characterized by a typical velocity of 600km s-1, i.e. the Si III] line should be spectrally resolved with a FWHM of 7Å as observed with SWP, in constrast to what is found. Therefore it seems that Raman scattering is not the main mechanism affecting the profile of the H wings in this case.
One additional requirement for Raman scattering to be efficient is that a relatively strong incident Ly flux has to be produced by the central source. This may be satisfied by Arrieta’s sample, formed by objects with central stars with 20,000 K, except maybe for the hypergiant IRC10420 with a stellar spectral type of A5 (8500 K) at the time Arrieta’s data were obtained.444The spectral type of the central star of IRC10420 changed from F8 to A5 in 4 years, from 1992 to 1996 (Klochkova et al., 1997). An estimate of the Ly luminosity expected around the central star of the PN IC 4997 using the photoinization code CLOUDY has been done by Lee & Hyung (2000). In this case, for a very hot (=60,000 K) and quite small (=) central star, a compact H II region of high density (109-1010 cm-3) together with a column density of neutral hydrogen of =few1020 cm-2 in the scattering region are needed in order to have a sufficient number of Ly photons and efficient Raman scattering. In our sample, a significant number of objects showing broad H wings have relatively cool central stars, with spectral types F-G (5000-7000 K) and, therefore, are unlikely to produce enough UV photons around Ly. This is in fact supported by their featureless nebular spectra, which are remarkably different from those observed in more evolved PNs (§ 3.2). For the objects in our sample with the hottest central stars (with late-O and early-B spectral types, 20,000-30,000 K) estimates of the Ly flux will be presented in future individual papers. We will also investigate whether or not shocks resulting from the wind interaction process are able to provide a strong Ly flux.
The presence of fast stellar winds is another plausible mechanism to explain the broad H wings observed. As already pointed out by Arrieta & Torres-Peimbert (2003), this is indeed the most likely mechanism for IRAS 204623416, for which the H wing profile was found not to follow a law. For similar reasons, a fast (1400km s-1) stellar wind is also very likely being expelled by the central star of IRAS 193061407 leading to its H wings. In more than one third of the objects in our sample, the presence of stellar winds is, in fact, confirmed by P Cygni profiles in H and other lines. The question is whether or not these winds reach much higher velocities (of 1000-2000km s-1) in certain regions that can explain the broad wings observed. In the case of M 1-92 and Hen 3-1475 there is direct evidence for fast winds with expansion velocities of up to 800 and 2300km s-1, respectively (Arrieta et al., 2005; Sánchez Contreras & Sahai, 2001), so it is plausible that these winds are also responsible (at least partially) for their H wings. In the rest of the objects in our sample, the terminal speed of the fast wind measured from the blue-shifted absorption feature of the H P Cygni profile (102 km s-1, Table 3) is never as large as that implied by the broad wings if these were to be attributed to fast outflows. However, we find that is normally larger than the FWHM of the H core indicating that indeed there are winds moving faster than the region emitting the bulk of the H line (with an average velocity of 120 km s-1; Table 3). This clearly suggests the presence of velocity gradients in the stellar winds of these objects. Moreover, we have found a weak correlation between and the FWZI of the broad H wings: the sources with the largest values of , namely, IRAS 195202759, IRAS 204623416, M 1-92, and Hen 3-1475, exhibit the broadest wings, reaching widths of 2600, 2800, 3000, and 4000km s-1, respectively. (For IRAS 204623416 and Hen3-1475, the H absorption feature is partially masked out by emission, therefore, values of =300km s-1 are measured from their H P Cygni profiles; Fig. 4.) This could be an indication that broad H wings are partially due to fast stellar winds.
5.3 Incipient mass-loss probed by efA profiles
Structured H absorption profiles partially filled in with emission are common in F- and G-type supergiants and are considered as a possible evidence for mass-loss (e.g. Tamura & Takeuti, 1993; Arellano-Ferro, 1985; Sowell, 1990). Although most efA sources in our sample are surrounded by extended nebulosities (see Table 2 and references therein), the observed structured H profile, in particular, the weak emission that fills in the stellar absorption, arises in the bright nebular nucleus, i.e. in a compact region very close to the central star, and not in the extended nebulae. This compact nuclear region is directly seen but is spatially unresolved in our ESI spectra for IRAS 042963424, IRAS 174403310, IRAS 181671209, IRAS 191140002, IRAS 194753119, and IRAS 201361309. Among these, IRAS 174403310 is the only efA source for which our ESI spectrum also shows weak H emission arising in the extended lobes (we note, however, that the spectrum of this object is yet dominated by the bright nucleus). In this case, therefore, part of the emission filling in the absorption profile in Fig. 6 may be locally produced in the lobes. Some contribution by nebular H emission to the efA profile cannot be ruled out either for IRAS 042963429, which is known to have a 15 extended nebula (Ueta et al., 2000) that is unresolved in our long-slit spectrum. For objects with optically thick equatorial regions, the nuclear region is blocked from direct view. This is the case of IRAS 173172743, IRAS 174412411 and IRAS 200283910. Our 2D spectra of IRAS 174412411 and IRAS 173172743 show, in fact, continuum emission from two extended lobes separated by a dark equatorial region but there is no H emission locally produced in the lobes. The similar spatial distribution along the lobes of the stellar continuum and the structured efA H profile indicate that both the continuum and the H line originate at the nebular core and are scattered by dust in the lobes. This is most likely the case of IRAS 200283910, for which our ESI spectrum shows unresolved continuum emission arising in the brightest of its two reflection lobes.
As shown in Section 4.1, the emission filling in the absorption in efA sources is well reproduced by a Gaussian function with an average width of FWHM65km s-1 (in deriving this value we have ignored objects for which the width of the emission component is uncertain; see Table 4). After deconvolution with the spectral resolution in our data (37km s-1, § 2) and thermal line broadening (15km s-1 for a kinetic temperature of 104 K), this value implies moderate speed (50km s-1) motions in the H-emitting region. This value is larger than the typical expansion velocity of the slow (5-15km s-1) AGB wind but smaller than the velocity of the fast pAGB outflows observed in pcyg sources (typically 100km s-1; see § 5.1). For the majority of the objects with a reliable estimate of the Doppler shift () for the emission feature (§ 4.1), the emission is displaced bluewards from the narrow absorption core: the blue-shift found ranges from 10 to 43km s-1 (Table 4). Only in one case, IRAS 201361309, the emission and the narrow absorption components are centered around the same wavelength within the expected errors in our measurements. Among the three objects with the weakest H emission features and, therefore, most uncertain emission line parameters, two show blue-shifted emission and one, IRAS 042963429, red-shifted (by 7km s-1) emission. We note, however, that for the latter, the parameters derived from the Gaussian analysis of the H line are somewhat uncertain due to the weakness of the emission component and the fact that some contamination of the efA profile by nebular H emission cannot be ruled out.
We interpret the weak emission partially filling the efA H profile, which arises in the stellar vicinity, as an indication of present-day (i.e. pAGB) mass-loss. (The material in the extended nebulosities around most objects resulted predominantly from the large-scale mass-loss process during the AGB – § 1.) For some of our efA sources, the presence of nebular material near the star is confirmed by detection of a small number of weak non-Hydrogen emission features, e.g. IRAS 042963429, IRAS 191140002, and IRAS 201361309 (and, tentatively, IRAS 194753119; § 3.2). Since the stellar spectral types of the objects with efA H-profiles are F and G (i.e. their central stars are relatively cool, with temperatures ranging between 5000-7000 K), the emission component is likely to be formed in the de-excitation region behind a shock wave, presumably produced by wind interaction, rather than in a photoionized H II region. The fact that the emission is systematically doppler shifted bluewards with respect to the narrow absorption core can be explained if there is significant occultation of the receding part of the outflowing stellar wind. Note that for stellar occultation effects to be significant the size of the H-emitting region has to be comparable to the radius of the star.
Alternatively, the weak H emission observed in efA sources could arise, in principle, in a long-lived reservoir of gas near the star, such as a rotating disk, rather than in a stellar wind. We believe, however, that the systematic blue-shift of the emission would be more difficult to explain under this scenario since a long-lived circumstellar structure would necessarily have to be rotating (to persist throughout a substantial amount of time) and, in this case, there is no obvious reason why the emission from the receding edge of such structure would be preferentially depressed/reduced.
Finally, although, both the narrow and broad absorption components of the efA and pA H profiles have most likely a photospheric origin, they are expected to arise in different layers of the stellar atmosphere, the broad feature probably arising in deeper, denser regions. The observed Doppler shifts between both absorption components, therefore, could result from the complex kinematics across the stellar photosphere. Complex, large amplitude atmospheric motions, involving e.g. the presence of shock waves propagating across the atmosphere, are derived from asymmetrical absorption lines and radial velocity measurements in supergiants, including those that are pPN candidates (e.g. Lebre & Gillet, 1991, 1992). Such complex motions are also evidenced by variable Doppler shifts of the Stark photospheric absorption relative to (see references above).
6 Differences between pcyg and efA sources
Both pcyg and efA H profiles are interpreted in terms of on-going pAGB mass loss. This stresses the fact that mass-loss does not stop after the AGB and that theoretical evolutionary models need to include pAGB mass loss in their models. The main difference between the H emission in pcyg and efA sources is that the strength of the line is much larger in the former (Table 3 & 4). Interpreting the strength of H in terms of mass-loss rate is extremely difficult because the former depends critically on several parameters that are unknown, such as the relative contribution by UV photons and shocks to the ionization of the H-emitting region, whether such a region is radiation or matter bounded, and the density distribution, geometry, and velocity field of the gas in the stellar vicinity. Also, accurate modeling of the stellar atmosphere would be needed to characterize and substract the contribution by the underlying absorption profile to the observed H line shape – this is particularly significant for objects with A- and B-type central stars. A simple, perhaps naive, interpretation is that the more intense H emission in pcyg sources implies larger pAGB mass-loss rates. A larger amount of circumstellar material resulting from larger pAGB mass-loss rates in pcyg sources would naturally explain their NIR colors, which independently point to the presence of warm dust in the vicinity of the star most likely produced by substantial present-day mass loss.
In principle, one could think that larger pAGB mass-loss rates would imply larger progenitor masses and, therefore, larger luminosities in pcyg sources. The location of our targets in the HR diagram (Fig. 8) does not show particularly high values of the luminosity for pcyg objects. The similar distribution of pcyg and efA targets in the Galaxy does not reveal either a significant difference in the mass of their progenitor, although a larger sample covering a broader range in galactic latitude would be needed to attain definitive conclusions. If confirmed, a lack of mass/luminosity segregation between the two types of sources would indicate that the unknown mechanism that governs mass-loss during the pAGB phase is not strongly dependent on intrinsic stellar characteristics but rather it may depend on extrinsic properties like, for example, the presence of a binary companion.
Another difference between pcyg and efA sources concerns to the velocity of their current stellar winds (§ 5.3 and 5.1). For efA, the weak H emission profile indicates moderate speed motions in the nuclear H-emitting region, with 50km s-1. For pcyg sources, the values of the FWHM of the H emission core implies larger expansion velocities in the stellar vicinity, typically 120km s-1. Most importantly, the Doppler shift of the absorption in the P Cygni profile suggests very fast ejections reaching velocities of up to few102-103km s-1. This is consistent with the earlier spectral types of pcyg sources since the escape velocity (and, hence, the stellar wind velocity) is expected to increase as the star evolves from the AGB to the PN phase due to the shrinking stellar radius. The faster winds and earlier spectral types of pcyg sources could either represent a difference in age or in the speed traversing the pAGB path with respect to efA objects: pcyg sources seem to be older or to have evolved faster than efA. A more rapid evolution could again suggest more massive progenitor for pcyg objects, but, as mentioned above, no signs of mass variance are found in our sample. A faster evolution could also result from larger pAGB mass loss rates in pcyg sources, which would be consistent their strong H emission.
With regard to the extended optical nebulosities, which are detected for most sources in our sample (Table 2), both classes of objects show many signs that the jet-sculpting process responsible for the shaping of the AGB envelope to its current aspherical morphology is active or has been active in the past. However, we have not found any indications of pcyg sources being older (nebula-wise) than efA targets since there are no obvious differences in their nebular morphologies (e.g., in the diversity of shapes and/or large- and small-scale structural components, direct visibility of the central star, or angular size). Nevertheless, for a proper evaluation of nebular aging, reliable estimates of the distance as well as accurate characterization of the nebular velocity field are needed. Finally, we would like to note that the on-going pAGB ejections probed by the nuclear H emission in pcyg and efA sources are probably not the same that shaped and accelerated the much more extended nebular lobes. We don’t know whether pAGB winds (similar or not to the current ones) have been ejected in a continuous or episodic manner since the shaping of the AGB envelope began. The fact that pcyg and efA objects with central stars of similar late types (F and G) exhibit H emission profiles that differ both in intensity and shape may suggest episodic pAGB ejections: pcyg would represent targets that are caught at times of intensive jet activity leading to energetic shocks and intense H emission, whereas efA could be currently in a status of “mild” wind interaction (resulted from smaller velocities and/or densities in the pAGB wind?). Variable pAGB stellar winds are indeed evidenced by temporal changes in the intensity and profile of some nuclear emission lines, including H, in certain objects in our sample, namely, IRAS 194753119, IRAS 191140002, and IRAS 204623416 (see § 3.1.1 and references therein). In pA targets, the pAGB winds that presumably shaped their aspherical AGB envelopes may have temporarily or permanently ended.
Apart from differences in the on-going pAGB ejections, the divergence of pcyg+pE and efA+pA sources in the IRAS color-color diagram suggests dissimilarities in the properties of the detached dust envelope produced by the large-scale mass-loss process during the AGB. The separation of both types of H profile sources in the IRAS color-color diagram seems to indicate a larger range of dust temperatures for pcyg objects. The different range in dust temperatures may result from: 1) a different distribution of the grain density in the AGB CSE; 2) a different spatial distribution of grain sizes; 3) a different grain composition, which will result in a different power-law dependence of the absorption/emissivity efficiency with wavelength; or any combination of these situations. For example, large temperature gradients are expected for optically thick envelopes since the outside grains will remain cooler than for optically thin CSEs due to the fact that optical-UV radiation is heavily attenuated and therefore unable to heat up the outside grains. Envelopes with an asymmetric dust distribution with much larger optical depth along one preferred direction (e.g. along the equatorial plane) could also result in a broader distribution of dust temperatures since grains in regions strongly shielded from the star radiation will remain cooler than those that are more exposed. Detailed modeling of the SED, including mm- and submm-wavelength data as well as IR spectroscopy, would definitively help in improving the characterization of the dust envelope (including its chemistry) and mass-loss history of these objects throughout the AGB and pAGB phases.
7 Summary
We present echelle long-slit optical spectra of a sample of evolved intermediate-mass stars in different evolutionary stages: 5 AGB stars, 17 pPNs, and 6 yPNs. Our sample also includes the object IRAS 191140002, which has a controversial classification as a pPN or a yellow hypergiant, and one YSO, IRAS 055062414, which was serendipitously discovered in our multi-wavelength survey of pPNs. (The spectrum of the latter is presented here for completeness but it is not discussed except for spectral typing of its central star.) We have analyzed extracted 1D spectra of our targets with special focus on the characteristics of the H line profile arising in the vicinity of the central source, i.e. the nebular nucleus. In this section, we summarize the main results obtained from this work:
-
-
Fifteen objects in our sample show relatively intense H emission, whereas eleven targets show H mainly in absorption. We have also found three sources (the AGB stars IRC10011, V656 Cas, and IK Tau) with neither H emission or absorption, and one object (the pPN IRAS 192921806) in which the low S/N of the spectrum prevents us from determining whether H emission or absorption is present.
-
-
Based on the shape of the H line, we have defined four main types of sources. Among the H emitters, those with a symmetric H profile are referred to as pure emission sources (pE), whereas objects with asymmetric P Cygni like profiles are denoted as pcyg. Objects with a pure absorption H profile are named pure absorption targets (pA). Objects with an absorption profile partially filled with weak emission are referred to as emission filled absorption sources (efA).
-
-
The presence of H emission from the compact nebular core displaying either a pE, pcyg, or an efA profile is interpreted as an indication of on-going (i.e. pAGB) mass-loss most likely in the form of a stellar wind. The observed H profiles have been parameterized and analyzed to derive information on the current stellar wind and other processes that may be affecting the observed line shape. Among the objects that have already left the AGB (i.e. pPNs and yPNs) there are only two pA sources. Except for these two objects, the rest show evidence of current stellar winds, which supports the idea that pAGB winds are generally present in pPNs and yPNs and are most likely responsible for the nebular shaping.
-
-
We interpret the peculiar P Cygni like profiles observed in some of our objects in a similar manner as we did for He3-1475 (Sánchez Contreras & Sahai, 2001). In this scenario the emission and absorption form in two distinct nebular components. The broad line emission, characterized by a given profile, arises from a compact central source. This line emission (and stellar continuum) is scattered by dust in the walls of the nebular lobes. The blue-shifted absorption is due to neutral or partially ionized outflowing gas inside the lobes absorbing the scattered photons along the line of sight. This results in a P Cygni like profile where the blue-shifted absorption is produced against the intrinsic emission profile.
-
-
For pE and pcyg sources the FWHM of the intense H core emission indicates gas motions with velocities in the range [50:200]km s-1. The mean velocity of the bulk of the material producing the blue-shifted absorption in pcyg targets varies between 50 and 500km s-1, however, larger outflow terminal velocities of up to 1000km s-1 are observed. It is possible that a radial and or latitudinal velocity gradient exists in the pAGB outflows and/or that distinct wind components are present.
-
-
Broad H emission wings, with widths of up to 2000km s-1, are observed in most pE and pcyg sources. The yet unclear origin of the very extended wings is investigated following a similar analysis to that performed by Arrieta & Torres-Peimbert (2003). Unlike these authors, we cannot conclude that in our sample Raman scattering is the main mechanism for line broadening. The presence of fast stellar winds, which is confirmed by P Cygni profiles in more than one third of our targets, is another plausible mechanism that could contribute to the broad H wings observed. These winds, however, would have to reach velocities larger than those derived from the P Cygni absorption features () to explain the broad H wings.
-
-
The H emission filling in the absorption profile of efA indicates moderate speed (50km s-1) motions in the nuclear H-emitting region. For most efA sources, the emission “hump” is displaced bluewards from the narrow stellar absorption feature which can be explained by occultation of the receding part of an outflowing stellar wind by the central star.
-
-
We have found differences in the H profiles of some of our targets with respect to earlier observations, namely, IRAS 191140002, IRAS 194753119, IRAS 204623416, and the AGB stars IRC+10216, CIT 6, and IK Tau. These variations most likely represent real changes on the physical properties of the nuclear H-emitting region (e.g. density, excitation, ionization fraction, geometry and size) presumably induced by the evolution of the central star and/or its current stellar wind.
-
-
We briefly discuss other Hydrogen and non-Hydrogen lines observed towards our targets. We note several prominent C2 Swan bands in the AGB stars IRC10216 and CIT 6 and the pPN IRAS 042963429. Some of these bands have been reported for the first time in this work. It is also worth mentioning the detection of emission by the [Ca II] 7291,7324Å doublet in the absorption-line dominated spectrum of the YHG IRAS 191140002. Observation of these lines, also present in the spectra of IRAS 175162525, M 1-92, Hen 3-1475, IRAS 220365306, IRAS 080052356, and (tentatively) IRAS 195202759, is consistent with dust grain destruction by moderate-velocity shocks in the stellar wind.
-
-
We have estimated the spectral type of the central stars of the objects in our sample by comparing their normalized spectra with those of template stars from published stellar libraries to investigate the correlation of this fundamental stellar parameter with the type of H profile. In a number of objects with F- and G-type central stars, we found discrepancies (typically of one type) with respect to previous spectral type assignations obtained from low spectral resolution studies. Such differences may reflect the limitations of low resolution spectroscopy for accurate spectral typing, although a real time evolution of the stellar effective temperature cannot be ruled out.
-
-
The stellar luminosity has been estimated from the luminosity-denpendent O I 7773Å infrared triplet, which is observed in absorption in the spectrum of some of our targets (13 out of 29). The obtained values, 5103-105, are consistent with pAGB stars with initial masses in the range 1-8, with a significant fraction (10 out of 13) of objects with masses 3 . Such massive pAGB objects represent 30% of our whole sample. The rest of the sources, which is also the majority (70%), may well have low-mass (3) progenitors – this may be part of the reason why the O I triplet is not observed in absorption. For the highest masses/luminosities derived in our sample, the theory of pAGB stellar evolution predicts rapid changes of the effective stellar temperature that should be observable in a time-scale of 10-100 years.
-
-
We investigated correlations between the type of H profile and some stellar and envelope parameters. The shape of the H line emission is correlated with the stellar spectral type as well as the the NIR and IRAS colors. No correlation has been found with the chemistry, galactic latitude, or nebular morphology.
-
-
All sources in which H is seen mainly in absorption (i.e., pA and efA) have F-G type central stars, whereas sources with intense H emission (i.e., pE and pcyg) span a larger range of spectral types from O to G, with a relative maximum around B, and also including very late C types. The measured equivalent widths of the H emission in objects with O- and B-type stars are consistent with UV stellar radiation being the main ionizing agent. H emitters with cooler central stars lack enough ionizing radiation, therefore, the emission component in these cases is likely to be formed in the de-excitation region behind a shock wave, presumably produced by wind interaction.
-
-
Pcyg and pE sources are found to exhibit a larger color excess than pA and efA objects. Moreover, while the NIR colors of efA+pA sources are consistent with the major contribution to the emission in the NIR bands being the reddened stellar photosphere, the position of pcyg+pE sources in the ()-() color-color diagram highlights the presence of warm dust. This component of warm dust probably results from substantial present-day mass-loss evidenced by the strong H emission of pE and pcyg targets.
-
-
Intense H emitters (i.e. pcyg+pE) and objects with H mainly in absorption (i.e. pA+efA) also segregate in the IRAS color-color diagram in a way that the former have dust grains with a larger range of temperatures. Such a different temperature range may result from: 1) a different distribution of the grain density in the AGB envelope; 2) a different spatial distribution of grain sizes; 3) a different grain composition; or any combination of these situations.
-
-
The differences found between pE+pcyg and pA+efA sources described above indicate dissimilarities in their pAGB and AGB mass-loss histories. The intense H emission and NIR color excess of pE and pcyg sources may indicate larger pAGB mass-loss rates compared with those in efA and pA targets. The lack of a mass/luminosity segregation of the two profile sources suggests that pAGB mass-loss is not very dependent on intrinsic stellar properties but may be dictated by extrinsic factors like, for example, the presence of a binary companion. The faster winds and earlier spectral types of the central stars of pcyg and pE sources suggest that these are older and/or have a larger speed traversing the pAGB evolutionary path than pA and efA.
-
-
We have not found any indications of the extended optical nebulosities (observed in most objects) being older for pcyg+pE sources than for efA+pA targets. Such nebulosities show many signs that the jet-sculpting process of the AGB CSE is currently active or has been active in the past in all cases. For the only two pA targets in our sample, IRAS 194772401 and IRAS 171503224, the winds that shaped their AGB CSEs to its current aspherical morphology are not seen at present. The on-going pAGB winds probed by the nuclear H emission in pE+pcyg and efA objects, which represent the vast majority of our sample, may not be the same that carved and accelerated the much more extended (probably older) optical lobes, however, shaping of the innermost layers of the AGB envelope (by interaction with the present-day pAGB winds) is probably still at work.
-
-
In principle, pAGB winds may have been ejected in a continuous or episodic manner since the shaping of the AGB envelope began. The fact that pcyg and efA objects with central stars of similar late types (F and G) exhibit quite different H emission profiles may suggest episodic pAGB ejections: pcyg would represent targets that are caught at times of intensive jet activity leading to energetic shocks and intense H emission, whereas efA could be currently in a status of “mild” wind interaction (resulted from smaller velocities and/or densities in the pAGB wind?). In pA targets, the pAGB winds that presumably shape their aspherical AGB envelopes may have temporarily or permanently ended.
Appendix A Discrepant stellar spectral type classification
The stellar spectral type estimated from our ESI data is different from previous assignations for several objects (§ 4.2). In the majority of the cases, we find earlier spectral types (i.e. larger ) than those reported in the past. The most extreme case is IRAS 193061407, which has been classified as G5, but displays clear signatures of a B-type star in our ESI data (see below). There is also a total of four pPNs with central stars formerly classified as G but with ESI spectra most consistent with F types. In two cases the spectral class derived from this work is later than in previous measurements, namely, IRAS 173172743 and IRAS 194772410, which have gone from a past mid-F to a current G4 and G0 classification, respectively. Incidentally, we note that these two objects are efA+pA, whereas sources for which our spectral type is earlier than in former works are all pcyg+pE.
Discrepancies between spectral types obtained from low- and high-resolution studies has been noticed for other pAGB objects and is discussed by, e.g., Decin et al. (1998) and Reddy & Hrivnak (1999). Among the objects with discrepant past and our current spectral type classifications, IRAS 042963429 is the only one with additional high-resolution spectroscopic line studies in the literature. The fact that the spectral type and for IRAS 042963429 determined by such studies (including this work) are all in very good agreement but systematically differ from the spectral classification from the low resolution spectrum indicates that the changes observed do not correspond to a real time evolution of the stellar , but rather reflect the inadequacy/limitations of low-resolution spectra for accurate spectral-type determinations. (Note that the previous high-resolution data of this object were taken at different epochs, from 1988 to 2003, and the low-resolution spectrum was obtained in 1991.) This could also well be the case for objects with low and high-resolution spectral types in disagreement by one type, e.g. objects previously classified as F (G) versus our current classification as G (F). In other words, we assume that the typical error of the spectral type derived from low-resolution spectra can be of one type but unlikely larger than that. (Note, however, that a real time variation in cannot be completely ruled out.)
According to this, the spectral type change observed in IRAS 193061407 can hardly be accounted for by the different spectral resolution. Although it is not impossible, we believe that the different spectral type does not result from the rapid evolution of the central star towards higher temperatures. There are remarkable differences between our spectrum and that observed by Suárez et al. (2006) that suggest that the spectrum reported by these authors probably did not correspond to IRAS 193061407. This is mainly supported by the absence of the deep Na I D doublet lines at 5900Å in the spectrum by Suárez et al. (2006). The radial velocity derived from the sodium lines in our data, 30km s-1, is very different from that measured in stellar absorption lines, such as C II 6578,6583Å and He I 6678Å, which yield 90-100km s-1, in agreement with the systemic velocity of the source derived from CO measurements (Table 3). The velocity of the sodium lines indicates that their origin is most likely interstellar and, therefore, their absence in Suarez et al.’s spectrum, which is not explained by their lower S/N, suggests that the object observed by these authors is not IRAS 193061407. (We note that if the Na I D lines in our spectrum were stellar then they should have been even deeper in a G5 star.) Another indication of the possible object misidentification is the absence in Suarez et al.’s data of the broad diffuse bands at 4430, 5780, 5797, 6284, 6614, 6993 and 7224Å observed by us, which may also be interstellar.
In spite of the above reasoning, we would like to note that it is not totally unrealistic to expect spectral changes due to rapid pAGB evolution of the central star of IRAS 193061407 in a time scale of 10 yr. In fact, the high luminosity derived from the deep O I infrared triplet indicates a final mass of the central star in the range [0.84-0.94], which for the standard/empirical initial-final mass relationship, implies an initial mass of 5-8. According to the theoretical evolutionary models for massive pAGB stars by Bloecker (1995), a 5-8 star reaches 20,000 K in only 80-10 years, respectively. (For comparison, traversing the same spectral interval would take 103 yr for a =2 .)
To the best of our knowledge, evolution towards higher temperatures has been previously reported for two pAGB stars: SAO 85766 (IRAS 180622410) and SAO 244567 (Hen 3-1357) (Parthasarathy et al., 2000, and references therein). For SAO 85766, an increase of the temperature from 8500 K to 22000 K in less than 25 yr is found, and SAO 244567 has turned into a young PN within the last 20-30 years and its central star appears to be evolving rapidly into a white dwarf. A very fast evolution of the temperature of the central star of the YHG IRC10420 has been also reported by Klochkova et al. (1997) who measured an increase of from 5700 to 8600 K in only 4 years during 1992 to 1996.
References
- Arellano-Ferro (1985) Arellano-Ferro, A. 1985, Revista Mexicana de Astronomia y Astrofisica, 11, 113
- Arellano Ferro et al. (2003) Arellano Ferro, A., Giridhar, S., & Rojo Arellano, E. 2003, Revista Mexicana de Astronomia y Astrofisica, 39, 3
- Arkhipova et al. (2001) Arkhipova, V. P., Ikonnikova, N. P., Noskova, R. I., Komissarova, G. V., Klochkova, V. G., & Esipov, V. F. 2001a, Astronomy Letters, 27, 719
- Arkhipova et al. (2001) Arkhipova, V. P., Ikonnikova, N. P., Noskova, R. I., Sokol, G. V., & Shugarov, S. Y. 2001b, Astronomy Letters, 27, 156
- Arrieta & Torres-Peimbert (2003) Arrieta, A., & Torres-Peimbert, S. 2003, ApJS, 147, 97
- Arrieta et al. (2005) Arrieta, A., Torres-Peimbert, S., & Georgiev, L. 2005, ApJ, 623, 252
- Bagnulo et al. (2003) Bagnulo, S., Jehin, E., Ledoux, C., Cabanac, R., Melo, C., Gilmozzi, R., & The ESO Paranal Science Operations Team 2003, The Messenger, 114, 10
- Balick & Frank (2002) Balick, B., & Frank, A. 2002, ARA&A, 40, 439
- Bernstein et al. (2003) Bernstein, R., Shectman, S. A., Gunnels, S. M., Mochnacki, S., & Athey, A. E. 2003, Proc. SPIE, 4841, 1694
- Bieging et al. (2006) Bieging, J. H., Schmidt, G. D., Smith, P. S., & Oppenheimer, B. D. 2006, ApJ, 639, 1053
- Bloecker (1995) Bloecker, T. 1995, A&A, 299, 755
- Brocklehurst (1971) Brocklehurst, M. 1971, MNRAS, 153, 471
- Bujarrabal et al. (1998) Bujarrabal, V., Alcolea, J., Sahai, R., Zamorano, J., & Zijlstra, A. A. 1998, A&A, 331, 361
- Bujarrabal et al. (2001) Bujarrabal, V., Castro-Carrizo, A., Alcolea, J., & Sánchez Contreras, C. 2001, A&A, 377, 868
- Castelaz et al. (2000) Castelaz, M. W., Luttermoser, D. G., Caton, D. B., & Piontek, R. A. 2000, AJ, 120, 2627
- Castro-Carrizo et al. (2007) Castro-Carrizo, A., Quintana-Lacaci, G., Bujarrabal, V., Neri, R., & Alcolea, J. 2007, A&A, 465, 457
- Cohen (1980) Cohen, M. 1980, ApJ, 238, L81
- Cohen & Jones (1987) Cohen, M., & Jones, B. F. 1987, ApJ, 321, L151
- Cohen & Schmidt (1982) Cohen, M., & Schmidt, G. D. 1982, ApJ, 259, 693
- Corradi & Schwarz (1995) Corradi, R. L. M., & Schwarz, H. E. 1995, A&A, 293, 871
- Cox (2000) Cox, A. N. 2000, Allen’s astrophysical quantities, 4th ed. Publisher: New York: AIP Press; Springer, 2000. Editedy by Arthur N. Cox. ISBN: 0387987460,
- Crowther et al. (1998) Crowther, P. A., De Marco, O., & Barlow, M. J. 1998, MNRAS, 296, 367
- Davis et al. (2005) Davis, C. J., Smith, M. D., Gledhill, T. M., & Varricatt, W. P. 2005, MNRAS, 360, 104
- Decin et al. (1998) Decin, L., Van Winckel, H., Waelkens, C., & Bakker, E. J. 1998, A&A, 332, 928
- Donahue & Voit (1993) Donahue, M., & Voit, G. M. 1993, ApJ, 414, L17
- Ducati et al. (2001) Ducati, J. R., Bevilacqua, C. M., Rembold, S. B., & Ribeiro, D. 2001, ApJ, 558, 309
- Faraggiana et al. (1988) Faraggiana, R., Gerbaldi, M., van’t Veer, C., & Floquet, M. 1988, A&A, 201, 259
- Fukugita et al. (1995) Fukugita, M., Shimasaku, K., & Ichikawa, T. 1995, PASP, 107, 945
- García-Lario et al. (1997) García-Lario, P., Parthasarathy, M., de Martino, D., Sanz Fernández de Córdoba, L., Monier, R., Manchado, A., & Pottasch, S. R. 1997a, A&A, 326, 1103
- García-Lario et al. (1997) García-Lario, P., Manchado, A., Pych, W., & Pottasch, S. R. 1997b, A&AS, 126, 479
- Gledhill (2005) Gledhill, T. M. 2005, MNRAS, 356, 883
- Hartigan et al. (1987) Hartigan, P., Raymond, J., & Hartmann, L. 1987, ApJ, 316, 323
- Hrivnak (1995) Hrivnak, B. J. 1995, ApJ, 438, 341
- Hrivnak et al. (2006) Hrivnak, B. J., Kelly, D. M., Su, K. Y. L., Kwok, S., & Sahai, R. 2006, ApJ, 650, 237
- Hu et al. (1993) Hu, J. Y., Slijkhuis, S., Nguyen-Q-Rieu, & de Jong, T. 1993, A&A, 273, 185
- Jura & Werner (1999) Jura, M., & Werner, M. W. 1999, ApJ, 525, L113
- Kelly & Hrivnak (2005) Kelly, D. M., & Hrivnak, B. J. 2005, ApJ, 629, 1040
- Klochkova et al. (1997) Klochkova, V. G., Chentsov, E. L., & Panchuk, V. E. 1997, MNRAS, 292, 19
- Klochkova et al. (1999) Klochkova, V. G., Szczerba, R., Panchuk, V. E., & Volk, K. 1999, A&A, 345, 905
- Klochkova et al. (2002) Klochkova, V. G., Panchuk, V. E., & Tavolzhanskaya, N. S. 2002, Astronomy Letters, 28, 49
- Kudritzki et al. (1997) Kudritzki, R. P., Mendez, R. H., Puls, J., & McCarthy, J. K. 1997, Planetary Nebulae, 180, 64
- Lebre & Gillet (1991) Lebre, A., & Gillet, D. 1991, A&A, 246, 490
- Lebre & Gillet (1992) Lebre, A., & Gillet, D. 1992, A&A, 255, 221
- Loup et al. (1993) Loup, C., Forveille, T., Omont, A., & Paul, J. F. 1993, A&AS, 99, 291
- Lowe & Gledhill (2007) Lowe, K. T. E., & Gledhill, T. M. 2007, MNRAS, 374, 176
- Luna et al. (2008) Luna, R., Cox, N. L. J., Satorre, M. A., García Hernández, D. A., Suárez, O., & García Lario, P. 2008, A&A, 480, 133
- Maíz-Apellániz et al. (2004) Maíz-Apellániz, J., Walborn, N. R., Galué, H. Á., & Wei, L. H. 2004, ApJS, 151, 103
- Mauron & Huggins (2006) Mauron, N., & Huggins, P. J. 2006, A&A, 452, 257
- Nyman et al. (1998) Nyman, L.-A., Hall, P. J., & Olofsson, H. 1998, A&AS, 127, 185
- Oppenheimer et al. (2005) Oppenheimer, B. D., Bieging, J. H., Schmidt, G. D., Gordon, K. D., Misselt, K. A., & Smith, P. S. 2005, ApJ, 624, 957
- Oppenheimer & Davé (2006) Oppenheimer, B. D., & Davé, R. 2006, MNRAS, 373, 1265
- Parthasarathy et al. (2000) Parthasarathy, M., García-Lario, P., Sivarani, T., Manchado, A., & Sanz Fernández de Córdoba, L. 2000, A&A, 357, 241
- Pereira & Miranda (2007) Pereira, C. B., & Miranda, L. F. 2007, A&A, 462, 231
- Perinotto (1993) Perinotto, M. 1993, Planetary Nebulae, 155, 57
- Reddy & Hrivnak (1999) Reddy, B. E., & Hrivnak, B. J. 1999, AJ, 117, 1834
- Riera et al. (2006) Riera, A., Binette, L., & Raga, A. C. 2006, A&A, 455, 203
- Sahai & Trauger (1998) Sahai, R., & Trauger, J. T. 1998, AJ, 116, 1357
- Sahai et al. (2003) Sahai, R., Zijlstra, A., Sánchez Contreras, C., & Morris, M. 2003, ApJ, 586, L81
- Sahai et al. (2005b) Sahai, R., Sánchez Contreras, C., & Morris, M. 2005, ApJ, 620, 948
- Sahai et al. (2006) Sahai, R., Young, K., Patel, N. A., Sánchez Contreras, C., & Morris, M. 2006, ApJ, 653, 1241
- Sahai et al. (2007a) Sahai, R., Sánchez Contreras, C., Morris, M., & Claussen, M. 2007a, ApJ, 658, 410
- Sahai et al. (2007b) Sahai, R., Morris, M., Sánchez Contreras, C., & Claussen, M. 2007b, AJ, 134, 2200
- Sahai et al. (2008) Sahai, R., Claussen, M., Sánchez Contreras, C., Morris, M., & Sarkar, G. 2008, ApJ in press.
- Sánchez Contreras et al. (2000) Sánchez Contreras, C., Bujarrabal, V., Miranda, L. F., & Fernández-Figueroa, M. J. 2000, A&A, 355, 1103
- Sánchez Contreras & Sahai (2001) Sánchez Contreras, C., & Sahai, R. 2001, ApJ, 553, L173
- Sánchez Contreras et al. (2002) Sánchez Contreras, C., Sahai, R., & Gil de Paz, A. 2002, ApJ, 578, 269
- Sánchez Contreras & Sahai (2004) Sánchez Contreras, C., & Sahai, R. 2004, ASP Conf. Ser. 313: Asymmetrical Planetary Nebulae III: Winds, Structure and the Thunderbird, 313, 377
- Sánchez Contreras et al. (2006) Sánchez Contreras, C., Bujarrabal, V., Castro-Carrizo, A., Alcolea, J., & Sargent, A. 2006, ApJ, 643, 945
- Sánchez Contreras et al. (2006) Sánchez Contreras, C., Le Mignant, D., Sahai, R., Chaffee, F. H., & Morris, M. 2006, Planetary Nebulae in our Galaxy and Beyond, 234, 71
- Sevenster (2002) Sevenster, M. N. 2002, AJ, 123, 2788
- Schlegel et al. (1998) Schlegel, D. J., Finkbeiner, D. P., & Davis, M. 1998, ApJ, 500, 525
- Schmidt et al. (2002) Schmidt, G. D., Hines, D. C., & Swift, S. 2002, ApJ, 576, 429
- Schoenberner (1987) Schoenberner, D. 1987, IAU Colloq. 95: Second Conference on Faint Blue Stars, 201
- Slijkhuis et al. (1991) Slijkhuis, S., de Jong, T., & Hu, J. Y. 1991, A&A, 248, 547
- Slowik & Peterson (1995) Slowik, D. J., & Peterson, D. M. 1995, AJ, 109, 2193
- Smith & Lambert (1994) Smith, V. V., & Lambert, D. L. 1994, ApJ, 424, L123
- Smith et al. (2002) Smith, L. J., Norris, R. P. F., & Crowther, P. A. 2002, MNRAS, 337, 1309
- Solf (1994) Solf, J. 1994, A&A, 282, 567
- Sowell (1990) Sowell, J. R. 1990, AJ, 100, 834
- Stasińska et al. (2006) Stasińska, G., Szczerba, R., Schmidt, M., & Siódmiak, N. 2006, A&A, 450, 701
- Su et al. (2001) Su, K. Y. L., Hrivnak, B. J., & Kwok, S. 2001, AJ, 122, 1525
- Su et al. (2003) Su, K. Y. L., Hrivnak, B. J., Kwok, S., & Sahai, R. 2003, AJ, 126, 848
- Suárez et al. (2006) Suárez, O., García-Lario, P., Manchado, A., Manteiga, M., Ulla, A., & Pottasch, S. R. 2006, A&A, 458, 173
- Szczerba et al. (2007) Szczerba, R., Siódmiak, N., Stasińska, G., & Borkowski, J. 2007, A&A, 469, 799
- Tamura & Takeuti (1993) Tamura, S., & Takeuti, M. 1993, ASP Conf. Ser. 45: Luminous High-Latitude Stars, 45, 309
- Teyssier et al. (2006) Teyssier, D., Hernandez, R., Bujarrabal, V., Yoshida, H., & Phillips, T. G. 2006, A&A, 450, 167
- Thomas et al. (1979) Thomas, R. M., Morton, D. C., & Murdin, P. G. 1979, MNRAS, 188, 19
- Trammell et al. (1994) Trammell, S. R., Dinerstein, H. L., & Goodrich, R. W. 1994, AJ, 108, 984
- Turner & Drilling (1984) Turner, D. G., & Drilling, J. S. 1984, PASP, 96, 292
- Ueta et al. (2007) Ueta, T., Murakawa, K., & Meixner, M. 2007, AJ, 133, 1345
- Ueta et al. (2000) Ueta, T., Meixner, M., & Bobrowsky, M. 2000, ApJ, 528, 861
- Vacca et al. (1996) Vacca, W. D., Garmany, C. D., & Shull, J. M. 1996, ApJ, 460, 914
- van de Steene et al. (1996a) van de Steene, G. C., Sahu, K. C., & Pottasch, S. R. 1996a, A&AS, 120, 111
- van de Steene et al. (1996b) van de Steene, G. C., Jacoby, G. H., & Pottasch, S. R. 1996b, A&AS, 118, 243
- van der Veen et al. (1989) van der Veen, W. E. C. J., Habing, H. J., van Langevelde, H. J., & Geballe, T. R. 1989, A&A, 216, L1
- Van Winckel & Reyniers (2000) Van Winckel, H., & Reyniers, M. 2000, A&A, 354, 135
- Vázquez et al. (2000) Vázquez, R., López-Martín, L., Miranda, L. F., Esteban, C., Torrelles, J. M., Arias, L., & Raga, A. C. 2000, A&A, 357, 1031
- Začs et al. (1996) Začs, L., Klochkova, V. G., Panchuk, V. E., & Spelmanis, R. 1996, MNRAS, 282, 1171
| IRAS | Other | R.A. (2000) | Dec. (2000) | Date observed | Exposure | P.A. |
|---|---|---|---|---|---|---|
| name | name | (h m s) | (o ’ ”) | (--) | time (s) | (°) |
| 010371219 | IRC10011 | 01:06:25.98 | 12:35:53.1 | 20041108 | 1800 | 135 |
| 023166455 | V656 Cas | 02:35:44.67 | 65:08:58.7 | 20041108 | 700 | 166 |
| 035071115 | IK Tau | 03:53:28.87 | 11:24:21.7 | 20041108 | 1250 | 120 |
| 042963429 | 04:32:56.97 | 34:36:12.4 | 20041108 | 1500 | 95 | |
| 055062414- | 05:53:43.56 | 24:14:44.7 | 20041108 | 1800 | 136 | |
| 055062414- | 05:53:43.18 | 24:14:44.1 | 20041108 | 1200 | 45 | |
| 080052356 | 08:02:40.71 | 24:04:42.7 | 20041108 | 1320 | 132 | |
| 094521330 | IRC10216, CW Leo | 09:47:57.41 | 13:16:43.6 | 20041108 | 3600 | 22 |
| 101313049 | CIT6, RW LMi | 10:16:02.29 | 30:34:19.1 | 20041108 | 1470 | 20 |
| 171503224 | AFGL 6815 | 17:18:19.86 | 32:27:21.6 | 20030427 | 1200 | 94††PA changed from 85.9 to 102.1° |
| 173172743 | 17:34:53.29 | 27:45:11.5 | 20030603 | 900 | 7 | |
| 174231755 | Hen 31475 | 17:45:14.19 | 17:56:46.9 | 20030604 | 600 | 135 |
| 174403310 | 17:47:22.72 | 33:11:09.3 | 20030428 | 3600 | 115††††PA changed from 110.3 to 121.5° | |
| 174412411 | Silkworm nebula | 17:47:13.49 | 24:12:51.4 | 20030603 | 2700 | 15 |
| 175162525 | 17:54:43.35 | 25:26:28.0 | 20030602 | 1920 | 164 | |
| 181671209 | 18:19:35.50 | 12:08:08.2 | 20030604 | 800 | 3 | |
| 190240044 | 19:05:02.06 | 00:48:50.9 | 20030602 | 2400 | 138 | |
| 191140002 | AFGL 2343 | 19:13:58.61 | 00:07:31.9 | 20030602 | 26 | 55 |
| 192921806 | 19:31:25.37 | 18:13:10.3 | 20041108 | 600 | 137.4 | |
| 193061407 | 19:32:55.09 | 14:13:36.9 | 20030604 | 1800 | 11 | |
| 193432926 | M192 | 19:36:18.91 | 29:32:50.0 | 20030602 | 1800 | 131 |
| 193742359 | 19:39:35.55 | 24:06:27.1 | 20030604 | 1800 | 15 | |
| 194753119 | 19:49:29.56 | 31:27:16.3 | 20030602 | 40 | 112 | |
| 194772401 | Cloverleaf nebula | 19:49:54.91 | 24:08:53.3 | 20030603 | 1800 | 91 |
| 195202759 | 19:54:05.87 | 28:07:40.6 | 20030604 | 1500 | 139 | |
| 200283910 | 20:04:35.98 | 39:18:44.5 | 20041108 | 600 | 165 | |
| 201361309 | 20:16:00.51 | 13:18:56.3 | 20030602 | 1500 | 20 | |
| 204623416 | LS II +34 26 | 20:48:16.64 | 34:27:24.3 | 20030602 | 1660 | 63 |
| 212825050 | 21:29:58.48 | 51:04:00.3 | 20030604 | 600 | 165 | |
| 220365306 | 22:05:30.28 | 53:21:32.8 | 20030604 | 2100 | 66 | |
| 225746609 | 22:59:18.36 | 66:25:48.3 | 20041108 | 3900 | 130 |
| IRAS | Object | Spectral | f12/f25 | f60 | Morphology11Main morphology descriptors defined by Sahai et al. (2007b). B = bipolar, M = multipolar, E = elongated, I = irregular, S = stellar (i.e. unresolved in images), w = central obscuring waist, = central star evident. | C/O22O = Oxygen rich; C = Carbon rich; C/O = mixed chemistry. | References |
|---|---|---|---|---|---|---|---|
| name | Class | Type | (Jy) | (optical/NIR) | |||
| Pure emission profiles (pE) | |||||||
| 094521330 | AGB | C9.5 | 2.06 | 5652.0 | Bw | C | 24 |
| 101313049**Uncertain profile due to weak H emission blended with other lines. | AGB | C4,3e | 2.72 | 273.6 | B | C | 7, 25 |
| 193742359 | yPN | B3-6 I | 0.24 | 70.9 | B | O | 15, 24, 23 |
| P Cygni profiles (pcyg) | |||||||
| 055062414- | YSO††YSO serendipitously discovered in our survey of pPNs – see § 1. | G9-K2 | 0.23 | 103.4 | I | O | 15, 16 |
| 080052356 | pPN | F5Ie | 0.35 | 29.8 | B | C/O | 23, 24 |
| 174231755 | yPN | Be | 0.25 | 63.7 | Bw | O | 15, 23 |
| 175162525 | pPN | O-B? | 0.45 | 100.1 | S | O | 17, 26 |
| 190240044 | pPN | G0-5 | 0.06 | 42.5 | Mw | O | 14, 15 |
| 193061407 | yPN | B0-1 I | 0.06 | 31.8 | B | C/O | 8, 15 |
| 193432926 | pPN | B2 (+F5) | 0.29 | 118.0 | Bw | O | 1, 15 |
| 195202759 | yPN | O9 I? | 0.39 | 207.0 | S | O | 4, 17 |
| 204623416 | yPN | B1Iae | 0.02 | 12.1 | E | O | 4, 22, 24 |
| 212825050 | yPN | O9.5,WC11 | 0.68 | 33.4 | M | C | 2, 15 |
| 220365306 | pPN | F4-7 | 0.18 | 107.2 | Bw | O | 13, 15 |
| 225746609 | pPN | A1-6 I | 0.31 | 20.6 | I/Bw | C | 18, 21 |
| Emission filled absorption profiles (efA) | |||||||
| 042963429****Uncertain profile: could also be pA. | pPN | F3 I | 0.28 | 15.4 | Bw(?) | C | 5, 11, 15, 23, 24 |
| 173172743 | pPN | G4 I | 0.04 | 29.5 | Bw††††No optical image available; our long-slit spectrum shows two nebulosities separated by a dark lane, i.e., most likely a bipolar nebula. | O | 10, 20, 22 |
| 174403310 | pPN | F3 I | 0.20 | 30.1 | B(w?) | O | 15, 20 |
| 174412411****Uncertain profile: could also be pA. | pPN | F4-5I | 0.22 | 106.0 | Bw | C? | 11, 15, 22, 23, 24 |
| 181671209****Uncertain profile: could also be pA. | pPN | F7 I | 0.16 | 21.3 | S | O | 10, 17 |
| 191140002 | pPN/YHG? | F5-7Ia | 0.05 | 516.0 | E | O | 12, 22, 24, 27 |
| 194753119 | pPN | F3Ib | 0.01 | 55.8 | M | O | 15, 23 |
| 200283910 | pPN | F3-7 I | 0.20 | 143.0 | Bw | C | 15, 23, 24 |
| 201361309 | pPN | F3-7 I | 0.44 | 2.1 | S | O? | 21, 23, 24 |
| Pure absorption profiles (pA) | |||||||
| 171503224 | pPN | F3-7 I | 0.18 | 268.3 | Bw | O | 3, 15, 24 |
| 194772401 | pPN | G0 I | 0.20 | 27.1 | M | C | 15, 21, 22 |
| H non-detections | |||||||
| 010371219 | AGB | M7 | 1.19 | 215.2 | E | O | 7, 9, 15 |
| 023166455 | AGB | M8 | 1.53 | 45.8 | S | O | 7, 17 |
| 035071115 | AGB | M6e-M10e | 1.95 | 332.1 | I | O | 7, 9 |
| 192921806 | pPN | B? | 0.10 | 28.8: | Bw | O | 15, 18 |
| Emission | Absorption | |||||||
|---|---|---|---|---|---|---|---|---|
| IRAS | (LSR) | (LSR) | FWHM | FWZI | FWHM | |||
| name | (km s-1) | (km s-1) | (km s-1) | (km s-1) | (Å) | (km s-1) | (km s-1) | (km s-1) |
| pcyg srcs | ||||||||
| 080052356 | 47(4) | 101 | 190 | 2400 | 14 | 85 | 170 | 80 |
| 174231755 | 48(1) | 89 | 170 | 4000 | 110 | ††Absorption partially masked by emission within the PSF in our ESI spectra (see § 3.1) | ††Absorption partially masked by emission within the PSF in our ESI spectra (see § 3.1) | ††Absorption partially masked by emission within the PSF in our ESI spectra (see § 3.1) |
| 175162525 | 15(6) | 35 | 100 | 1400 | 105 | 40 | 110 | 70 |
| 190240044 | 50(2) | 101 | 90 | 2400 | 40 | 100 | 170 | 80 |
| 193061407 | 90(5) | 116 | 60 | 2600 | 15 | 115 | 170 | 50 |
| 193432926 | 1(1) | 19 | 170 | 3000 | 180 | 530 | 750 | 220 |
| 195202759 | 15(5) | 5 | 170 | 2600 | 130 | 260 | 420 | 120 |
| ” | ” | ” | ” | ” | ” | 530 | 800 | 250 |
| 204623416 | 75(8) | 43 | 80 | 2800 | 15 | ††Absorption partially masked by emission within the PSF in our ESI spectra (see § 3.1) | ††Absorption partially masked by emission within the PSF in our ESI spectra (see § 3.1) | ††Absorption partially masked by emission within the PSF in our ESI spectra (see § 3.1) |
| 212825050 | 18(1) | 17 | 50 | 500 | 23 | ††Absorption partially masked by emission within the PSF in our ESI spectra (see § 3.1) | ††Absorption partially masked by emission within the PSF in our ESI spectra (see § 3.1) | ††Absorption partially masked by emission within the PSF in our ESI spectra (see § 3.1) |
| 220365306 | 43(3) | 0 | 220 | 2500 | 30 | 150 | 250 | 110 |
| 225746609 | 64(1) | 41 | 70 | 400 | 3 | 50 | 110 | 50 |
| pE srcs | ||||||||
| 193742359 | 35(5) | 7 | 90 | [600:2000] | 4 | … | … | … |
| 094521330 | 25(7) | 32 | 65 | 150 | 4 | … | … | … |
| Narrow absorption | Broad absorption | Emission | ||||||
|---|---|---|---|---|---|---|---|---|
| IRAS | FWHM | FWHM | FWHM | |||||
| name | (Å) | (km s-1) | (Å) | (km s-1) | (km s-1) | (Å) | (km s-1) | (km s-1) |
| 173172743 | 2.22 | 140 | 2.25 | 1(21) | 880 | 0.73 | 28(6) | 60 |
| 174403310* | 3.94 | 70 | 0.98 | 10(3) | 200 | 4.89 | 4(1) | 100 |
| 191140002* | 1.96 | 80 | … | … | … | 1.56 | 8(3) | 110 |
| 194753119 | 0.77 | 60 | 2.22 | 1(3) | 720 | 0.60 | 20(2) | 50 |
| 200283910 | 0.67 | 50 | 1.27 | 50(17) | 490 | 0.32 | 40(10) | 70 |
| 201361309 | 1.09 | 60 | 1.10 | 32(3) | 580 | 0.79 | 1(2) | 80 |
| 042963429 | 0.65 | 60 | 2.04 | 10(3) | 640 | 0.21 | 7(5) | 125 |
| ” | 0.54 | 50 | 1.97 | 1(3) | 710 | … | … | … |
| 174412411 | 0.61 | 50 | 1.86 | 13(3) | 730 | 0.09 | 34(8) | 60 |
| ” | 0.54 | 50 | 1.88 | 18(3) | 750 | … | … | … |
| 181671209 | 0.69 | 55 | 1.94 | 21(2) | 530 | 0.16 | 10(3) | 80 |
| ” | 0.56 | 50 | 1.89 | 27(2) | 520 | … | … | … |
| 171503224 | 0.50 | 50 | 1.36 | 30(13) | 530 | … | … | … |
| 194772401 | 1.09 | 110 | … | … | … | … | … | … |
| IRAS | (O I) | B.C. | ||||
|---|---|---|---|---|---|---|
| name | (Å) | (mag) | (mag) | () | ( kpc-2) | (kpc) |
| 042963429 | 1.62 | 5.83 | 0.00 | 1.7E+04 | 280 | 8 |
| 174412411 | 1.81 | 6.42 | 0.03 | 3.0E+04 | 810 | 6 |
| 181671209 | 1.93 | 6.81 | 0.09 | 4.5E+04 | 100 | 21 |
| 190240044 | 1.69 | 6.04 | 0.21 | 2.5E+04 | 250 | 10 |
| 191140002 | 3.00 | 10.2 | 0.03 | 9.5E+05††Uncertain, outside of the applicability domain (see § 4.3). | 4950 | 14††Uncertain, outside of the applicability domain (see § 4.3). |
| 193061407 | 0.99 | 3.81 | 2.14 | 1.9E+04††††Uncertain, outside of the spectral type applicability domain (see § 4.3). | 320 | 8††††Uncertain, outside of the spectral type applicability domain (see § 4.3). |
| 193742359 | 1.98 | 6.95 | 0.95 | 1.1E+05††††Uncertain, outside of the spectral type applicability domain (see § 4.3). | 450 | 13††††Uncertain, outside of the spectral type applicability domain (see § 4.3).,∗∗Interstellar expected to be very high. |
| 194753119 | 2.10 | 7.35 | 0.03 | 6.9E+04 | 380 | 13 |
| 194772401 | 1.20 | 4.47 | 0.15 | 5.5E+03 | 240 | 5∗∗Interstellar expected to be very high. |
| 200283910 | 2.04 | 7.15 | 0.03 | 5.8E+04 | 950 | 8 |
| 201361309 | 1.26 | 4.67 | 0.03 | 5.9E+03 | 75 | 9 |
| 204623416 | 0.67 | 2.81 | 2.14 | 7.4E+03 | 130 | 8 |
| 225746609 | 2.10 | 7.34 | 0.13 | 7.6E+04††††Uncertain, outside of the spectral type applicability domain (see § 4.3). | 170 | 21††††Uncertain, outside of the spectral type applicability domain (see § 4.3). |
Fig. Set1. Observed spectra