Formation of X-Ray Cavities by the Magnetically Dominated Jet-Lobe System in a Galaxy Cluster
Abstract
We present cosmological magnetohydrodynamic simulations of the formation of a galaxy cluster with magnetic energy feedback from an active galactic nuclei (AGN). We demonstrate that X-ray cavities can be produced by the magnetically dominated jet-lobe system that is supported by a central axial current. The cavities are magnetically dominated and their morphology is determined jointedly by the magnetic fields and the background cluster pressure profile. The expansion and motion of the cavities are driven initially by the Lorentz force of the magnetic fields, and the cavities only become buoyant at late stages ( Myr). We find that up to of the injected magnetic energy goes into doing work against the hot cluster medium, heating it, and lifting it in the cluster potential.
1 Introduction
The absence of spectral signatures of cooling plasmas at the galaxy cluster centers (Tamura et al. 2001; Peterson et al. 2003) has led to the suggestion that the intra-cluster medium (ICM) in cluster centers must be heated. Powerful radio jet-lobes emanating from supermassive black holes (SMBHs) in AGNs of clusters are considered to be the promising heating sources (Binney & Tabor 1995; Tucker & David 1997; see also McNamara & Nulsen 2007 for a recent review). High resolution X-ray images of galaxy clusters by Chandra have revealed giant cavities and weak shock fronts in the hot gas (Fabian et al. 2000; McNamara et al. 2000, 2005), which are commonly associated with energetic radio lobes (Blanton et al. 2005; Nulsen et al. 2002) and suggest that magnetic fields play an important role.
Large uncertainties concerning the nature of these cavities, their formation, evolution, and survivability in the ICM still remain. Numerical simulations of hot, underdense bubbles in galaxy clusters have been performed by a number of authors (e.g., Churazov et al. 2001; Reynolds, Heinz, & Begelman 2001; Brüggen & Kaiser 2002; Omma et al. 2004). It is generally possible to inject a large amount of energy into the ICM via AGNs but it is not exactly clear how the AGN energy can be efficiently utilized (Vernaleo & Reynolds 2006; though see Heinz et al. 2006). One of the most interesting characteristics of the radio bubbles is that they are intact, whereas most hydrodynamic simulations (Quilis, Bower & Balogh 2001; Brüggen & Kaiser 2002; Dalla Vecchia et al. 2004) have shown that purely hydrodynamic bubbles will disintegrate in timescales much less than yrs, markedly different from observations. (we will use X-ray cavities, bubbles, and radio bubbles interchangeably in this Letter). The stabilizing role of magnetic fields has been suggested and studied by a few authors (e.g., Jones & De Young 2005).
A rather different class of models has been proposed and studied, in which the AGN energy output is modeled in the magnetically dominated limit (Li et al. 2006; Nakamura, Li, & Li 2006; see also the previous work of Blandford 1976, Lovelace 1976, Lynden-Bell 1996, Li et al. 2001). The key feature of this model is to inject simultaneously both the poloidal and the (more dominant) toroidal magnetic fields in a small volume. This is to mimic the possible outcome of an accretion disk dynamo around an SMBH that shears and twists up the poloidal magnetic fields and generates large amounts of toroidal fields with an axial current (as high as amperes) flowing along the central axis of this magnetic structure. The injection of magnetic fields and their associated currents lasts a finite time (mimicking the lifetime of an AGN), after which the magnetic fields and their currents will no longer be injected but will continue to evolve and gradually dissipate away. This global current is essential to maintaining the magnetic structure throughout the lifetime of a magnetic field and its associated current. The system is not force-free initially, and so the fields will self-collimate and expand predominately axially, producing a collimated structure reminiscent of a “magnetic tower”. Extensive 3-D magnetohydrodynamic (MHD) simulations based on this model in a static cluster-like background, have demonstrated that such magnetically dominated structures can reproduce some of the global features of the jet-lobe systems, especially in maintaining the integrity of the bubbles.
In this Letter, we present cosmological MHD simulations of a cluster formation with the feedback of an AGN, with the aim of understanding the X-ray cavity formation using the magnetically dominated models proposed by Li et al. (2006). This differs from all previous studies (Brüggen & Kaiser 2002; Heinz et al. 2006) in that the formation of the X-ray cavity is studied in a realistic and self-consistent cosmological setting where the dark matter, baryon dynamics and magnetic fields are all evolved self-consistently. In §2, we describe our approach and the parameters of the simulations. In §3, we present the key results. Conclusions and discussions are given in §4.
2 Simulations
We use the newly developed ENZO+MHD code to simulate the galaxy cluster formation with the magnetic feedback of SMBHs. This code is an Eulerian cosmological MHD code with adaptive mesh refinement (Xu et al. 2008). The galaxy cluster presented here is taken from the Simulated Cluster Archive of Laboratory of Computational Astrophysics at University of California, San Diego (http://lca.ucsd.edu/data/sca/). It uses a CDM model with parameters , , , , and . While these are not precisely the values determined by the latest observations (Spergel et al. 2007), the differences are unimportant for the conclusions of this study. For simplicity, the simulation is adiabatic without the additional physics such as radiative cooling and star formation feedback. (These effects are not essential for the purpose of this study.) The survey volume is 256 Mpc on a side. (For simplicity, all spatial scales in the rest of the Letter are normalized by the factor and are in comoving unit.) The simulations were computed from cosmological initial conditions sampled onto a root grid and 2 level nested static grids in the Lagrangian region where the cluster forms which gives an effective root grid resolution of cells (0.5 Mpc) and dark matter particles of mass . Adaptive mesh refinement (AMR) is used only in the region where the galaxy cluster forms, with a total of 8 levels of refinement beyond the root grid, for a maximum spatial resolution of kpc. At the center of the cluster when the AGN is “turned on” (see below), we further increased the resolution at the injection region to be kpc. While the baryons are resolved at higher and higher spatial and mass resolution at higher levels, the dark matter particles maintain constant in mass so as not to add any additional noise. The simulations were evolved from redshift to .
The energy output from an SMBH is simulated by injecting magnetic energy in a small volume centered on a chosen massive galaxy that is at or near the center of the cluster. It is currently not possible to resolve both the galaxy cluster and the black hole environment simultaneously, so we have adopted an approach that mimics the possible magnetic energy injection by an SMBH (Li et al. 2006). We start the magnetic energy injection at redshift , at which the cluster has a virial radius Mpc, a virial mass , baryon to dark matter ratio . In the cluster center where the chosen AGN is located, the gas density is g cm-3, pressure dyn cm-2, and temperature . The density profile of the ICM can be fitted as: with kpc and . Magnetic fields are injected for 36 Myr in a region of kpc with a peak strength of . There are about mass enclosed in the injection region. The evolution from to lasts about Myrs. So the cluster is still evolving while the magnetic fields from an AGN are injected and are piercing through the ICM. Many different simulations were performed with a range of injection parameters, but we present the results mostly using one simulation, while the conclusions drawn are general.
Note that after the first 36 Myr, magnetic fields and their associated currents are no longer injected. This, however, does not mean that the magnetic fields (and their currents) will disappear immediately. Instead, they will continue to evolve, gradually losing energy (especially in the early stages) by, say, doing work against the background ICM. Since the typical dynamic time is yrs and our simulation lasts yrs, we do not expect the numerical dissipation of magnetic energy to play a major role. We have used high resolution on all the regions with magnetic fields (via AMR), so the numerical dissipation timescale should be much longer than the dynamic timescale.
3 Results
3.1 Stages of X-ray Cavity Formation
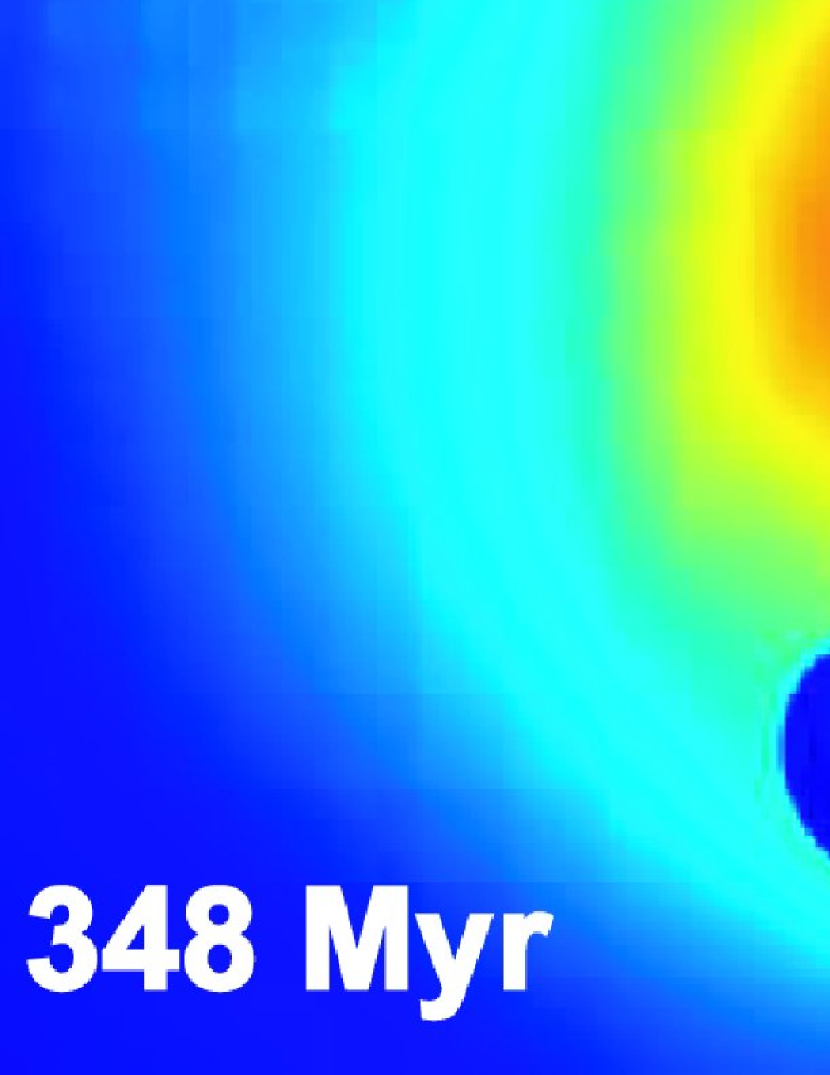
Images of the cluster at different epochs are given in Fig. 1. The ranges of density are, from top to bottom, , , and g cm-3, respectively. A cutoff of K is used in all temperature images. The minimum temperatures are , and K from top to bottom. The maximum magnetic energy density of each image is , , and erg cm-3. The ranges of path-integrated X-ray emission are , and erg cm-2 s-1, from top to bottom, respectively. The integrated X-ray intensity is taken from the keV band with solar metal abundance assumed. These projected results are obtained by integrating kpc along the line of sight.
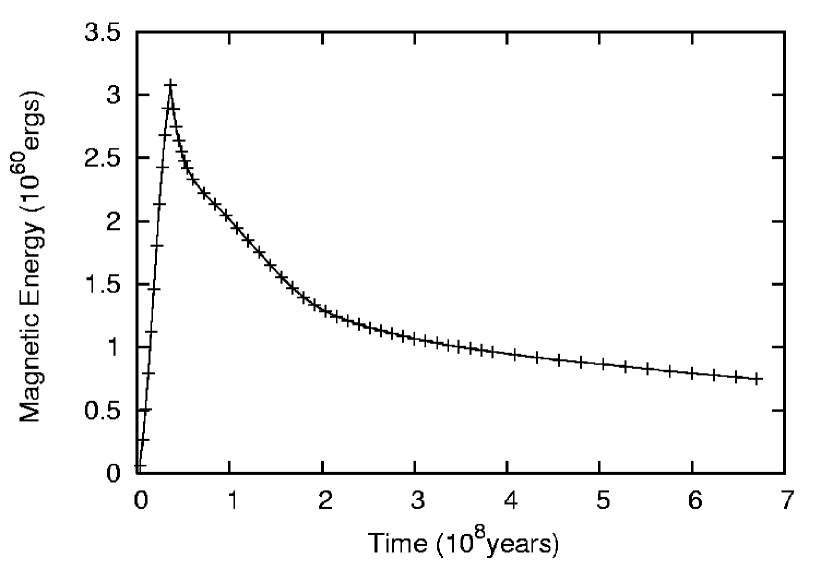
A pair of cavities can be seen in the images at late times, which are created by the expansion of magnetic fields as they move out of the cluster core region. Note the relative motion between the cluster core and the injection location. The evolution of the total magnetic energy (integrated over the whole cluster) is given in Figure 2. We can see that the system first goes through an injection phase from Myr, during which ergs of magnetic energy is injected. This gives an average input power of ergs s-1, which is comparable to the typical luminosity of a powerful AGN. At the end of the injection, only about ergs still remain in the magnetic form while the rest of the injected magnetic energy has all been transferred to the surrounding ICM. At Myr, the poloidal current is amperes along the central axis, whose corresponding toroidal magnetic fields self-collimate the outflow, which undergoes a supersonic expansion in the cluster core region (Li et al. 2006; Nakamura, Li, & Li 2006) and forms a “tower-like” structure.
Once the injection ceases, the magnetic energy in the cluster starts to decrease, first at a fast rate ( ergs yr-1) from Myr, followed by a much slower rate ( ergs yr-1) from Myr. This transition coincides with the time when the magnetic lobes leave the cluster core region ( kpc, the middle row of Fig. 1). The plasma density and pressure of the ICM drop rapidly beyond the core, hence the slower rate of magnetic energy dissipation. The poloidal current is ampere at Myr. Once the magnetic lobes leave the cluster core, they experience additional expansion, forming the round or flattened shapes, depending on the surrounding cluster pressure environment (the bottom row of Fig. 1). The final total magnetic energy in the cluster is about ergs, roughly of the total injected magnetic energy. This implies that of the injected magnetic energy has been transferred to the ICM: their thermal energy (heating via compression and shocks), their kinetic energy (driving the bulk flows), and their potential energy (being lifted in the cluster potential well).
3.2 Shock Fronts and Cavity Properties
Chandra observations have revealed that shocks around the radio lobes are weak (Fabian et al. 2003; Nulsen et al. 2005; McNamara et al. 2005). In our simulations, a global shock front enclosing the whole magnetic structure is generated early by the injection of magnetic fields. At Myr, the shock’s Mach number is about at a distance roughly kpc away from the central galaxy. This shock, which is hydrodynamic in nature, gradually weakens as it moves ahead of and away from the magnetic structure. By Myr, the shock is about kpc away and barely visible (the middle row of Fig. 1), with a Mach number just above . After this time, the shock is dissipated into the background ICM.
The Lorentz forces from the magnetic fields expand the magnetic structure and push the ICM away. In the nearly ideal MHD limit, the plasma is “frozen in” with the magnetic fields, and the mixing between the magnetized jet-lobe system and the background ICM is inhibited. So the plasma density associated with the magnetic structure decreases as the jet expands, creating the density cavities. The magnetic fields undergo significant lateral expansion as they leave the central core region (the middle and bottom rows of Fig. 1). The formation of such large, relatively “round” lobes is jointly determined by the ambient ICM pressure and an axial electric current which flows along the “spine” of the magnetic structure and returns around the outer boundary of the lobes and jets. The central poloidal current generates toroidal magnetic fields whose strength behaves as where is the cylindrical distance from the jet axis. Such a decreasing magnetic pressure () is eventually balanced by the background ICM pressure, thus determining the size of the X-ray cavity. More detailed comparisons with a large set of bubble observations show that such a magnetically dominated model agrees quite well with bubbles’ size and distance distributions (Diehl et al. 2008).
To illustrate the internal property of the lobes, we take a horizontal “cut” through the southern lobe at and Myr (Fig. 1) and plot its properties along the line in Fig. 3. At Myr, the cavity is clearly dominated by magnetic energy. The peak magnetic field strength is probably higher than the inferred typical field value from observations. At Myr, it has a comparable amount of total magnetic energy ( ergs) and thermal energy ( ergs). The total kinetic energy is much smaller, ergs. The implied enthalpy upper limit of this lobe is ergs. Assuming that the northern lobe has a similar energetics as the southern lobe, the total enthalpy in the lobes is ergs, which is much smaller than the amount of magnetic energy that has been transferred, ergs. So the enthalpy could be a serious under-estimate of the injected magnetic energy.
It has often been suggested that the evolution of the X-ray bubbles is driven by buoyancy. Using lobe’s size, distance from the galaxy and cluster gravity, we have computed the implied buoyancy time by pretending they were buoyant. We found that the calculated buoyancy times are and Myr, whereas the actual evolution times are and Myr, respectively. The difference does get smaller at late times ( Myr).
4 Conclusions and Discussions
With our cosmological MHD simulations, we find that, in the realistic cluster environment where the ICM plasma interacts dynamically with the magnetic jet-lobe, X-ray cavities can naturally form using the magnetically dominated models proposed by Li et al. (2006). The magnetic fields inside the bubbles stabilize the interface instabilities so that bubbles can remain intact. The lifetime of these bubbles can be quite long and only become truly buoyant probably after Myr.
We have performed additional cosmological MHD simulations with radiative cooling and star formation feedback and found that our conclusions for the X-ray cavity formation mechanism do not change. While we have demonstrated the formation of X-ray cavities, much more studies are needed in order to address comprehensively the cooling flow problem at the cluster cores. The present simulation, with just one AGN, already has important implications for understanding the ICM heating problem. Up to of the injected energy has been dissipated in the surrounding ICM. Further studies are underway with AGNs at different redshifts that have different cluster environments so that we can gain a comprehensive understanding of the overall heating of the ICM by AGNs. These simulations will be presented in future publications. The morphology of the jet-lobe is dependent on the background density radial profile, which is different for massive clusters (such as the one presented here) and groups or poor clusters. Future work will address this issue.
References
- Binney & Tabor (1995) Binney, J. & Tabor, G. 1995, MNRAS, 276, 663
- Blandford (1976) Blandford, R. D. 1976, MNRAS, 176, 465
- Blanton et al. (2005) Blanton, E. L., Sarazin, C. L., McNamara, B. R., & Wise, M. W. 2001, ApJ, 558, L15
- Brüggen & Kaiser (2002) Brüggen, M. & Kaiser, C. R. 2002, Nature, 418, 301
- Churazov et al. (2001) Churazov, E. et al. 2001, ApJ, 554, 261
- Dalla Vecchia et al. (2004) Dalla Vecchia, C. et al., 2004, MNRAS, 355, 995
- Diehl et al. (2008) Diehl, S., Li, H., Fryer, C. & Rafferty, D. 2008, ApJ, submitted (astro-ph/0801.1825)
- Fabian et al. (2000) Fabian, A. C. et al. 2000, MNRAS, 318, L65
- Fabian et al. (2003) Fabian, A.C. et al. 2003, MNRAS, 344, L43
- Heinz et al. (2006) Heinz, S.,Brüggen M., Young, A., & Levesque, E. 2006,MNRAS, 373, L65
- Jones & De Young (2005) Jones, T. W. & De Young, D. S. 2005, ApJ, 624,, 586
- Li et al. (2001) Li, H., Lovelace, R. V. E., Finn, J. M., & Colgate, S. A. 2001, ApJ, 561, 915
- Li et al. (2006) Li, H., Lapenta, G, Finn, J.M., Li, S. & Colgate, S. A. 2006, ApJ, 643, 92
- Lovelace (1976) Lovelace, R. V. E. 1976, Nature, 262, 649
- Lynden-Bell (1996) Lynden-Bell, D. 1996, MNRAS, 279, 389
- McNamara et al. (2000) McNamara, B.R. et al. 2000, ApJ, 534, L135
- McNamara et al. (2005) McNamara, B.R. et al. 2005, Nature, 433, 45
- McNamara & Nulsen (2007) McNamara, B.R. & Nulsen, P.E. 2007, ARA&A, 45, 117
- Nakamura, Li, & Li (2006) Nakamura, M., Li, H. & Li, S. 2006, ApJ, 652, 1059
- Nulsen et al. (2002) Nulsen, P. E. J. et al. 2002, ApJ, 568, 163
- Nulsen et al. (2005) Nulsen, P.E., McNamara, B.R., Wise M.W. & David, L.P. 2005, ApJ, 628, 629
- Omma et al. (2004) Omma, H. et al. 2004, MNRAS, 348, 1105
- Peterson et al. (2003) Peterson, J. R. et al. 2003, ApJ, 590, 207
- Quilis, Bower & Balogh (2001) Quilis, V., Bower, R. G. & Balogh, M.L. 2001, MNRAS, 328, 1091
- Reynolds, Heinz, & Begelman (2001) Reynolds, C. S., Heinz, S, & Begelman, M. C. 2001, ApJ, 549, L179
- Spergel et al. (2007) Spergel, D. N. et al. 2007, ApJS, 170, 377
- Tamura et al. (2001) Tamura, T. et al. 2001, A&A, 365, L87
- Tucker & David (1997) Tucker, W. & David, L. P. 1997, ApJ, 484, 602
- Vernaleo & Reynolds (2006) Vernaleo, J. C. & Reynolds, C. S. 2006, ApJ, 645, 83
- Xu et al. (2008) Xu, H. et al. 2008, in AIP Conf. Proc. 990, First Stars III, eds B.W. O’Shea, A. Heger & T. Abel (Melville: AIP), 36