Ice Lines, Planetesimal Composition and Solid Surface Density in the Solar Nebula
Abstract
To date, there is no core accretion simulation that can successfully account for the formation of Uranus or Neptune within the observed 2-3 Myr lifetimes of protoplanetary disks. Since solid accretion rate is directly proportional to the available planetesimal surface density, one way to speed up planet formation is to take a full accounting of all the planetesimal-forming solids present in the solar nebula. By combining a viscously evolving protostellar disk with a kinetic model of ice formation, which includes not just water but methane, ammonia, CO and 54 minor ices, we calculate the solid surface density of a possible giant planet-forming solar nebula as a function of heliocentric distance and time. Our results can be used to provide the starting planetesimal surface density and evolving solar nebula conditions for core accretion simulations, or to predict the composition of planetesimals as a function of radius.
We find three effects that favor giant planet formation by the core accretion mechanism: (1) a decretion flow that brings mass from the inner solar nebula to the giant planet-forming region, (2) the fact that the ammonia and water ice lines should coincide, according to recent lab results from Collings et al. (2004), and (3) the presence of a substantial amount of methane ice in the trans-Saturnian region. Our results show higher solid surface densities than assumed in the core accretion models of Pollack et al. (1996) by a factor of 3–4 throughout the trans-Saturnian region. We also discuss the location of ice lines and their movement through the solar nebula, and provide new constraints on the possible initial disk configurations from gravitational stability arguments.
Keywords: solar nebula; planetary formation; ices
1 Introduction
Previous core accretion simulations of the formation of Uranus and Neptune require the solar nebula lifetime to be at least 10 Myr longer than the observed median protostellar disk lifetime (2–3 Myr; Haisch et al. 2001). Similarly, the simulation of Saturn’s formation by Alibert et al. (2001) allows the planet to form in 2.5 Myr, but only if it migrates from 11.9 AU to 9.5 AU during formation. This scenario is incompatible with the outward migration of Saturn predicted by the Nice model of planetary dynamics (Tsiganis et al. 2005) This research was motivated by the need to create a model of the solar nebula with enough solid mass to form Jupiter, Saturn, Uranus and Neptune via core accretion at heliocentric distances of AU.
For core accretion simulations, planetesimal mass available for building giant planet cores is usually calculated by invoking the scaled minimum-mass solar nebula with surface density , obtained from spreading out the current mass of the planets (Weidenschilling 1977), and assuming a gas/solid ratio of . However, a single planet core embedded in a disk of planetesimals grows at the rate of
| (1) |
where is a factor taking into account gravitational focusing by the core (Safronov 1969), is the solid surface density of planetesimals, is the orbital angular frequency of the core, and is the core’s effective capture radius. For Keplerian orbits, we have
| (2) |
The dependence of means that even planets forming in a disk with uniform surface density should, in the end, reach masses that suggest if growth rate is not taken into account. A near-uniform surface density distribution, in which mass is not concentrated in the inner disk, gives higher surface densities in the outer disk and may speed up the formation of Uranus and Neptune.
Furthermore, the canonical gas/solid ratio of 70, which is based on the composition of Comet Halley (Jessberger et al. 1989), includes only one ice in the solid inventory—H2O. However, there were certainly other ices present in the solar nebula: the Deep Impact ejecta from Tempel 1 contained tons of excavated CO, CO2 and CH3OH (A’Hearn 2008). Taking a full accounting of the solids in the solar nebula may reveal other volatile mass sources besides H2O that condense in the outer solar nebula and improve the formation prospects of Uranus and Neptune.
In this work, we calculate the time-evolving solid surface density available for giant planet formation. We make two updates to previous solar nebula simulations: (1) we relax the assumption of a steady-state disk and allow for viscous redistribution of mass, which tends to drive the surface density profile toward uniformity, and (2) we add a chemical reaction network to trace the formation and freezeout of volatiles.
This paper is organized as follows. In §2, we outline our method for calculating solid surface density in the solar nebula: which codes we use, how they are linked, and how they differ from previous solar nebula models. In §3, we describe our protostellar disk model and use it to calculate the total surface density (gas+solid) and temperature evolution of the disk. §4 details the physics behind our chemical reaction network, the abundances of the major ice species, and the location of the ice lines. We calculate the solid surface density available for planet formation in §5 and present our conclusions in §6.
2 Simulation Overview
This simulation consists of two independent, non-interacting codes used in sequence. The first code is a non-steady-state, 1+1-dimensional -disk model that simulates the dynamical evolution of the solar nebula. Code 1 gives the surface density distribution , along with the vertical and radial temperature and volume density distributions and .
The results from Code 1 fill an important niche in the body of work on protostellar disk evolution. Currently available are 2-d, static disk models that include stellar insolation and radiogenic heating (e.g. D’Alessio et al. 2006); quasi-steady-state 1+1-d models where follows an imposed prescription (e.g. Hersant et al. 2001); and non-steady-state models with only one zone in the vertical direction (Ruden and Pollack 1991). The evolving protostellar disks of Boss (2007) include 3-d hydrodynamics and radiative diffusion, but cover a timespan of years.
In this work, we couple full vertical structure models with the time-dependent, non-steady-state surface density evolution of the disk and present the first long-term solar nebula simulation with viscous angular momentum transport determined self-consistently with vertical structure. For a description of how the resulting dynamical evolution of our disk differs from previous simulations, see §3.7.2.
Code 2 is a non-equilibrium chemical model, including gas reactions, grain-surface reactions, freezeout and desorption. This code traces the abundance of 211 species, including 58 ices, as the disk cools and the ice lines move inward. Chemical reaction, freezeout and desorption rates are governed by the temperature and density of the solar nebula gas and grains. We use the midplane temperatures and densities calculated by Code 1 to generate reaction rate coefficients for Code 2.
Previous chemical models of the solar nebula include those of Aikawa et al. (1996), Willacy and Langer (2000), and Ilgner and Nelson (2006). Aikawa et al. (1996) extended the minimum-mass solar nebula (MMSN; Hayashi 1981) to 800 AU to predict the observed depletion of gaseous CO in the outer regions of T-Tauri disks. Their calculation included gas-phase reactions of CO and other C, H, O, N and S-based molecules, freezeout of CO and its reaction products, formation of H2, and electron-ion recombination on grain surfaces. The density and temperature of the underlying disk were assumed to stay constant with time, while the time-evolving midplane CO abundance was calculated with an independent sequence of radial one-zone models.
Willacy and Langer (2000) calculated the vertical distribution and column density of common interstellar molecules as a function of time in the flared protoplanetary disk of Chiang and Goldreich (1997). They used a similar species set to Aikawa et al. (1996) but added grain-surface reactions and photodesorption to the chemistry. The simulation consisted of a 2-d grid of noninteracting one-zone models in the plane. The underlying temperature and density distribution of the protostellar disk remained constant with time.
Finally, Ilgner and Nelson (2006) embedded a five-species chemical reaction network in an evolving -disk model, fully coupling the chemical and dynamical evolution of the disk. They used the chemical reaction network to trace the ionization fraction, which is affected by charge-transfer reactions, electron-ion recombination, and viscous diffusion. The simulation was computationally tractable due to the small reaction network (5 species, 4 reactions), and the limited extent of the protostellar disk (0.1–10 AU).
Code 2 of this work is the first to combine an extensive chemical reaction network, including ice formation and grain-surface reactions, with a time-evolving protostellar disk model (as used by Ilgner and Nelson 2006). Our chemical model consists of a radial sequence of noninteracting one-zone models, as in Aikawa et al. (1996). The disk model in Code 1 therefore functions as a stand-alone input to the chemical model of Code 2. Our models differ from those of Aikawa et al. (1996) and Willacy and Langer (2000) in that we allow the disk temperature and density to change with time, as prescribed by the results of Code 1. Although Code 1 simulates the full vertical structure of the protostellar disk, we apply Code 2 only to the midplane, which is where solids settle and build planetesimals.
Code 2 calculates the abundance of each ice and gas species as a function of heliocentric radius and time. Combining these results with information from the literature about the composition of refractory grains, we calculate the gas/solid mass ratio in the solar nebula. This ratio tells us what fraction of the total surface density calculated by Code 1 is solid and can build giant planet cores. The end result of both codes is the solid surface density distribution .
Since most molecules in the solar nebula formed in a molecular cloud, we first run Code 2 for molecular cloud conditions ( K, hydrogen number density , grain radius ). The molecular cloud model begins with atomic gas of solar composition (except for hydrogen, 99% of which is in H2) and bare refractory grains at the standard interstellar abundance , where is the grain abundance and and are the abundances of H and H2, respectively. We run the molecular cloud model for yr and use the resulting ice-gas mixture as the starting composition of the solar nebula.
3 Disk Model
3.1 Overall Model Formulation
The goals of this simulation are to calculate the time-evolving temperature and density in the solar nebula, which determine the reaction rates for our kinetic model of ice formation, and to follow the viscous evolution of the surface density profile. Although from a planet formation perspective we are primarily concerned with the ice inventory at the solar nebula midplane, an accurate dynamical description of the midplane requires understanding the vertical energy balance in the disk. To simplify the problem of long-term protostellar disk evolution, we use the following assumptions:
-
1.
The disk is axisymmetric and symmetric about the midplane.
-
2.
The disk is geometrically thin: .
The disk is represented in cylindrical polar coordinates (heliocentric distance) and (height above midplane), where the -axis is the rotation axis of the nebula. Assumption 1 reduces the physical 3-dimensional disk to a 2-dimensional quadrant with zero flux at the midplane, allowing us to suppress the azimuthal coordinate . Assumption 2 allows the vertical and radial dimensions of the disk to be decoupled to form a 1+1-dimensional framework: at each radial gridpoint resides an independent vertical structure model. At each timestep, energy balance between viscous heating and radiative cooling is solved within in a single annulus.
3.2 Radial Diffusion
We calculate the radial motion of mass using the surface density diffusion equation of Lynden-Bell and Pringle (1974):
| (3) |
Eq. 3 is valid when the protostar’s accretion rate is small, so the sun is almost fully assembled at the beginning of the simulation. This assumption is consistent with the T-Tauri phase of disk evolution. We take the viscosity governing radial diffusion to be the midplane value.
To calculate , we make the following assumptions about angular momentum transport in the disk:
-
1.
Viscous stresses follow the standard -viscosity prescription (Shakura and Syunyaev 1973). We assume the magnetorotational instability (Balbus and Hawley 1991; hereafter MRI) provides the requisite turbulent viscosity.
-
2.
The grains and gas are well mixed. This assumption allows us to track the disk’s solid surface density evolution by modeling only a single fluid.
The turbulent viscosity is
| (4) |
where is the isothermal sound speed and is the modified pressure scale height, softened into a nonsingular form (Milsom et al. 1994):
| (5) |
The angular velocity, neglecting disk self-gravity, is
| (6) |
and the isothermal sound speed is
| (7) |
In parts of the disk where , the disk surface height, we substitute for in Eq. 4. We take a mean molecular weight of g mol-1 (Ruden and Pollack 1991). Based on recent global-disk MHD simulations (Lyra et al. 2008), we choose . We further discuss the interplay between , disk mass and surface density profile, along with our constraints on these parameters, in §3.6. All free parameters in the disk model are listed in Table 1.
Although we assume turbulence is caused by MRI, we do not include the radial variation of the viscosity coefficient caused by the dead zone (e.g. Kretke and Lin 2007, Reyes-Ruiz et al. 2003). However, we do account for the cessation of MRI turbulence in the tenuous outer regions of the disk, where ions and neutrals may be only weakly coupled. Hawley and Stone (1998) find that neutrals participate fully in MRI turbulence only when the ion-neutral collision timescale is much less than the orbital timescale; . Ions and neutrals decouple and MRI turbulence ceases when . In the transition region between coupled and decoupled neutral-ion interaction, where , we decrease linearly from its fiducial value.
To calculate , we find the mean free time of a neutral particle traveling through a gas of moving ions. The neutrals and ions collide at an average angle of and thus a mean impact velocity of
| (8) |
where and are the molecular weights of neutrals and ions, respectively. The mean collision time is then
| (9) |
where and are the radii of neutrals and ions, is the mean velocity of a neutral and is the number density of ions:
| (10) |
We assume an ionization fraction of and an ion mass of AMU. and are listed along with other free parameters in the simulation in Table 1.
3.3 Vertical Structure
Since the disk midplane viscosity is determined by the balance between viscous energy generation and radiative energy losses at the photosphere, we calculate full vertical structure models at each radial grid point. We use the following assumptions about the mass and energy balance in the vertical direction:
-
1.
The disk stays in hydrostatic equilibrium. Even though the mass distribution evolves, the vertical sound crossing timescale is much less than the radial diffusion timescale.
-
2.
We neglect stellar irradiation as an energy source, as it has little effect on the midplane temperature. In section 3.6 we show that the disk is self-shadowed ( decreases with ), making this assumption self-consistent with our simulation results.
A system of three coupled differential equations specifies the vertical structure of the disk. First, the disk is in hydrostatic equilibrium:
| (11) |
Second, the viscous energy generation rate per unit volume (Pringle 1981) is
| (12) |
Third, where vertical energy transport is regulated by radiative diffusion and energy transport in the radial direction is negligible (thin disk assumption), the energy equation is
| (13) |
To calculate the thermodynamic gradient , we use the Schwarzschild criterion for stability against convection (Kippenhahn and Weigert 1994):
| (14) |
In Eq. 14, is the adiabatic gradient, which is for a diatomic gas; is the convective gradient; and is the radiative gradient:
| (15) |
where is the radiation density constant and is the local Rosseland mean opacity (for a description of the opacity tables used in this calculation, see §3.5).
We use mixing-length theory to calculate . We begin the convection treatment by defining two dimensionless quantities:
| (16) |
and
| (17) |
In Equation 17, is the specific heat at constant pressure and is the mixing length. As in Milsom et al. (1994), we define as the minimum of the convection zone top or the pressure scale height (Equation 5). is an analytical softening of the ratio , eliminating the singularity at :
| (18) |
Defining a new variable as
| (19) |
(where is the thermodynamic gradient of an individual convective element), we can then solve the cubic equation
| (20) |
to find . For the derivations of Equations 19 and 20 see Chapter 7 of Kippenhahn and Weigert (1994).
Finally, we close the system of equations with the ideal gas equation of state,
| (21) |
3.4 Computational Methods and Boundary Conditions
We begin the simulation with a specified surface density profile for the disk, (Hayashi 1981). The total disk mass used to normalize and the viscosity coefficient are determined by constraints of gravitational stability and the need for enough mass to form giant planets. For full details of how the disk is constructed, see §3.6. We also assume the disk is embedded in a medium with an ambient temperature (for example, a molecular cloud core). This places a firm lower limit on the nebula temperature and forces inactive regions of the disk to assume an isothermal vertical structure.
As in Bell et al. (1997), we place the disk surface at optical depth . We begin the vertical structure calculation with guesses for the free parameters and , the density and temperature at the surface.
The net flux leaving the disk surface is determined by the accretion temperature , generated solely by viscous stresses:
| (22) |
We require a value of at the disk surface to to start integrating Equations 12 and 13. The free parameter is the flux sum of the accretion temperature and the ambient temperature , invoking the Eddington approximation:
| (23) |
In equation 23, is the Hopf function, with a value of 0.601242 for (Bell et al. 1997; Mihalas 1978).
After calculating from Eq. 21, the variables of integration , and are all specified. We find the height of the surface by solving the following equation for z:
| (24) |
Integration proceeds inward from the disk surface to the midplane using the Runge-Kutta method with adaptive stepsize control (Press et al. 1992). We repeat the integration, adjusting and with the Newton-Raphson algorithm (Press et al. 1992), until a solution is found that satisfies
| (25) |
(following Assumption 1, §3.1) and
| (26) |
After the vertical structure is solved for each radius, we use the resulting to update . We implement implicit finite differencing to solve Eq. 3, adjusting the timestep so that surface density varies by a maximum of 1.5% during a single timestep (e.g. Ruden and Pollack 1991).
The radial grid is equispaced in and contains 600 cells between the inner boundary at AU and the initial outer boundary at AU. We implement a zero viscous-stress inner boundary condition, so matter falls directly onto the star from the innermost gridpoint. Although the actual accretion shock is at a much smaller radius than AU, Ruden and Lin (1986) find that the location of the inner boundary is unimportant as long as . We allow the disk to expand freely from the original outer boundary, so new radial grid cells are added to the disk as the simulation progresses.
3.5 Opacities
Solving Eq. 15 requires knowing local mean opacity. Semenov et al. (2003) calculated Rosseland mean opacities due to icy grains for temperatures down to 5K. The authors modeled several different grain types, including spheres, aggregates, and porous grains. We use the 5-layered sphere topology, where each grain consists of a silicate/iron nucleus covered with successive layers of volatiles as the temperature decreases. Following Semenov et al., we assume the grains condensed from gas of solar composition, with the abundances given by Helling et al. (2000). These abundances are primarily derived from the catalog of Anders and Grevesse (1989). We list the abundances of the most common elements in Table 2, along with the types of solids they can form: rock, metal, ice, or refractory CHON (e.g. graphite or kerogen; see Jessberger et al. 1988).
At temperatures above 1200K, iron and silicates sublimate and the main opacity source switches from dust to molecular gas. Semenov et al. (2003) caution that the gas opacities in their model are only approximate in the temperature range where dust and gas opacity are comparable. For temperatures above 1000K, we use the opacities of Ferguson et al. (2005), updated for our chosen set of solar abundances (J. Ferguson, private communication). It should be noted that the number of atomic and molecular lines included in the calculation of an opacity table has a greater impact on the resulting opacities than minor changes in assumed solar composition.
Regions where opacity is a strong function of temperature can cause convergence problems for the Newton-Raphson algorithm, which will oscillate between two solutions with similar temperatures but quite different opacities. To mitigate this problem, we smoothed the raw opacity tables with an averaging filter. Figure 1 shows opacity as a function of temperature and density in our model.
3.6 Initial Conditions
Constraints on the early stages of the solar nebula come from observations of Class 1 protostars and T-Tauri stars and the presence and orbital configuration of the planets. We require our disk to meet two criteria:
-
1.
The disk is gravitationally stable to axisymmetric perturbations at all radii.
-
2.
The disk is massive enough to produce Jupiter and Saturn by core accretion within the observed mean protostellar disk lifetime of 2–3 Myr (Haisch et al. 2001).
To test whether a particular disk meets Criterion 1, we calculate the Toomre Q parameter at every radial gridpoint. Gravitational stability requires that
| (27) |
Gravitationally unstable disks will fragment and form stellar or substellar clumps on a year timescale. The lack of a binary companion for the sun and the near-circular, non-chaotic orbits displayed by all the planets makes gravitational fragmentation anytime during solar nebula evolution unlikely.
Our criterion determines the combinations of viscosity parameter , mass distribution and total disk mass that create viable accretion disks. High values of act to stabilize the disk by increasing energy generation and therefore sound speed. Large disk masses destabilize the disk by increasing . Surface density profiles that decline steeply with radius damp gravitational instability by loading the mass preferentially toward the inner disk, where dissipative shear stresses are strongest.
Hersant et al. (2001; hereafter HGH) used an evolving -disk model and measured solar-system D/H ratios to constrain the structure of the solar nebula. They chose the surface density profile . Even with an extremely high turbulent energy generation rate, , disks with this surface density distribution are gravitationally stable only if . However, Criterion 3 requires that there be sufficient solid mass to form Jupiter and Saturn within Myr. Assuming a gas/solid mass ratio of 70 (Pollack et al. 1996), a disk with out to 30 AU and has a solid surface density of only 6 g cm-2 in Saturn’s feeding zone at 9.5 AU. Hubickyj et al. (2005) found that a planet forming from 6 g cm-2 of solids at 5 AU takes more than 13 Myr to initiate rapid gas accretion, necessary for forming a massive atmosphere. Since planet formation proceeds more slowly at larger heliocentric distances (Eq. 1), this disk is unlikely to be able to form Saturn. We thus require a more massive disk, with a steeper surface density profile to keep the outer regions gravitationally stable.
We choose a disk mass and a surface density (Hayashi 1981). We take , the approximate azimuthally and vertically averaged value at Jupiter’s heliocentric distance in the global MHD turbulence simulations of Lyra et al. (2008). Our solar nebula has inner and outer radii of AU and AU, covering the range of heliocentric distances where planets exist today. It is worth noting that studies of the relative motions of dust and gas predict a much larger outer radius: the gas drag on cm-sized bodies can cause them to be quickly lost to the Sun unless they have a very large distance to migrate (Stepinski and Valageas [1997]; Ciesla and Cuzzi [2006]). Mitigating the deleterious effect of gas drag on large grains may require that the nebula has an additional low-density component outside AU, which we do not model in this work.
We assume our disk coincides with the beginning of the sun’s T-Tauri phase. Most of the sun’s mass is already in place: at the start of our simulation. We assume an ambient temperature of 20 K, approximating a disk embedded in the remnants of a molecular cloud. All free parameters in the disk model are listed in Table 1.
Although our model neglects solar irradiation, we find that the giant planet-forming region of our t=0 disk is in fact shadowed. The maximum aspect ratio of the photosphere occurs at AU. Beyond this radius, no part of the disk receives direct sunlight. The shadow persists until Myr, when regions with AU attain an aspect ratio greater than the local maximum at 2 AU. In this way, our disk evolution is broadly consistent with model T-Tauri disk SEDs, which require flaring to explain observed spectra (e.g. Chiang et al. 2001), yet the giant planet-forming region (–20 AU) still receives no solar heating during the icy planetesimal formation epoch.
3.7 Disk Model Results
3.7.1 Surface Density
We run the solar nebula model for 2 Myr, about the median age of observed protostellar disks (Haisch et al. 2001). Figure 2 shows the evolution of the disk surface density profile in the giant planet-forming region, 5-20 AU (Tsiganis et al. 2005). The surface density profile at is shown on the upper left. Subsequent panels show snapshots of as the simulation progresses plotted in black. For reference, surface density profiles from preceding plot panels are retained in gray. Figure 3 shows the surface density evolution of the entire disk as it expands from 30 AU at to AU after 2 Myr.
From examining Fig. 2, we can divide the evolution of the solar nebula’s giant planet-forming region into two epochs. In Epoch 1, the surface density profile flattens as mass is redistributed from the inner disk to the outer disk. At , the net mass flow is outward everywhere except at AU, which is accreting inward toward the star. A wave of local surface density enhancement consequently propagates outward, reaching AU at yr and dissipating near AU at yr. At the end of Epoch 1, at yr, the solar nebula has assumed a surface density profile flatter than (equal mass in each annulus) in all but the inner AU of the disk. The effect of this mass redistribution epoch, therefore, is to drive the surface density distribution toward uniformity.
In Epoch 2, yr, surface density decreases with time everywhere in the disk. In Fig. 3, we see the solar nebula grow more tenuous as it expands: after 2 Myr, the total disk mass is 0.067 spread over 80 AU, as opposed to 0.12 within 30 AU at the beginning of the simulation. The protosun reaches a final mass of 1.003 .
Figure 4 shows surface density as a function of time at 5 AU, 10 AU, 15 AU and 20 AU. At each heliocentric distance, we see the temporary mass growth as the density wave passes through. The largest relative surface density increase occurs at 11.5 AU, where the initial surface density of 442 g cm-2 grows by 28% to 558 g cm-2 in 85,000 yr. This surface density enhancement moving outward through the giant planet-forming region strongly favors solid planet-core formation.
At the beginning of the sun’s T-Tauri phase, before substantial grain growth occurs, gas and grains are well mixed: accreting gas drags grains with it. If gas moves inward with a constant mass flux, surface density decreases with time everywhere in the disk and solids are lost into the sun. Our net outward gas flow deposits small grains in the 5–15 AU region within the planetesimal formation timescale of yr (Hubbard and Blackman 2006). These grains provide surface area for ice deposition and add solid mass to the giant planet feeding zones, speeding up solid core formation.
The existence of Epoch 1 and consequent driving of the surface density distribution toward uniformity is a robust result that we see even using surface density profiles with power-law indices of 0.7 and 1. Our chosen fiducial disk remains stable to axisymmetric perturbations (c.f. Eq. 27) throughout its evolution even as mass flows outward.
3.7.2 Mass Flux
In their study of the similarity solutions of viscously evolving disks, Lynden-Bell and Pringle (1974) found that the natural behavior of an accretion disk is to diffuse and spread out, creating a net inward flow in the inner disk, a turnaround radius, and an outward decretion flow in the outer disk. Ruden and Lin (1986) uncovered the same behavior in numerical simulations of the evolution of the minimum-mass solar nebula. Why haven’t many other -disk models predicted the outward mass flow into the trans-Saturnian region that could so improve the prospects for giant planet formation? Most previous evolving disk models such as HGH and the pseudoevolutionary sequence of Bell et al. (1997) have required the disk to be in steady state. In steady-state models, each annulus receives an equal inward-driven mass flux with the sun serving as the sink particle. There is therefore no chance for any part of the disk interior to at to gain mass. Note that the assumption of steady-state, net inward accretion is still consistent with viscous expansion of the disk from its original outer boundary, as occurs in the HGH models and this work.
The non-steady-state evolving disk model of Ruden and Pollack (1991) assumed turbulent stresses were caused solely by convection, and set the viscosity to zero in optically thin regions where radiative transport is efficient. Far from the star, the shallow potential well does not allow the disk to attain high volume densities, so reaching an optical depth of requires more mass than in the inner disk. At AU, the outer radius at the beginning of the Ruden and Pollack calculation, convection ceases almost immediately and the disk becomes quiescent. The inward accretion flow then removes enough mass from progressively interior annuli to make them optically thin, leaving behind a remnant surface density profile where increases with .
In the Ruden and Pollack simulation, mass is not redistributed from the inner disk to the outer disk—the slope of changes from negative to positive because the inner parts of the disk remain optically thick for the longest, participate in convection-driven accretion the longest, and therefore lose the most mass. However, in their analysis of the coupling between the kinetic stress tensor governing hydrodynamic stability, the magnetic stress tensor, and the shear field, Hawley et al. (1999) find that MRI is uniquely capable of providing turbulent angular momentum transport in disks. By relaxing the steady-state condition, but still permitting angular momentum transport by MRI in optically thin regions (though MRI ceases if ions and neutrals decouple; see §3.2), we allow outward flows to develop and viscous stress to redistribute mass from the inner disk to the giant planet-forming region.
Figure 5 shows time snapshots of the mass accretion rate as a function of radius. The location with is the turnaround between inward accretion and outward “decretion.” This turnaround radius moves outward over time, so that more and more of the disk is accreting toward the star. This behavior is required to open a hole in the inner disk and make the transition from classical T-Tauri to non-accreting, weak-lined T-Tauri star. Instead of accreting onto the star, the outwardly decreting material ( AU) will eventually be lost to photoevaporation (Alexander et al. 2006).
3.7.3 Midplane Temperature
Figure 6 shows shapshots of the temperature of the protostellar disk midplane at AU as the disk evolves. Outside of 30 AU, the entire disk (midplane and above) is isothermal at the ambient temperature throughout the simulation (20 K, plotted with a dash-dotted line). The first three panels of Fig. 6 show that during Epoch 1, areas of the disk that increase in mass are correspondingly heated: the temperature at 10 AU increases from 40 K at to 49 K at yr.
We first evaluate the suitability of our model disk for delivering crystalline silicates to comets, as detected by Keller et al. (2006) in comet 81P/Wild 2 dust captured by the Stardust spacecraft. The dashed line in Fig. 6 shows the minimum temperature for silicate crystallization of 800 K (Gail 1998). (Note that forsterite formation requires K; Hallenbeck et al. [2000].) The inner nebula retains temperatures above 800 K for yr. Dullemond et al. (2006) calculated the formation and transport rates of crystalline silicates in a 1-d evolving -disk model with infall from a collapsing cloud. Relaxing the steady-state assumption, they found that viscous spreading of the disk, rather than turbulent radial mixing, could relocate crystalline silicates produced early on in the inner, hot ( K) parts of the disk to distances of AU, where comets formed. A gradual outward push of crystalline silicates is consistent with the nebula flow pattern observed in this work, and may explain the anticorrelation between disk age and crystallinity in the inner disk ( AU) discussed by van Boekel et al. (2004). However, the danger that crystalline silicates transported outward through the midplane would be swept up by protoplanets before ever reaching the comet-forming region led Ciesla (2007) to favor more rapid transport than the decretion flow in this model.
The dotted line on Fig. 6 shows the H2O ice line at 160 K (Collings et al. 2004). Although we require a chemical kinetic model to determine the exact position and width of the ice line (since ice deposition is not instantaneous but proceeds at a finite rate limited by the gas velocity of H2O and the available grain surface area), we can nevertheless estimate its location and compare with previous disk models. In our simulation, the H2O ice line is always inside the formation zones of Saturn, Uranus and Neptune, and crosses Jupiter’s feeding zone (5.2 AU) at yr. All giant planet cores, therefore, should have formed from icy grains.
After 2 Myr, the midplane outside 15 AU has become isothermal at the ambient temperature. This temperature, therefore, has a profound effect on the ice inventory of the solar nebula. The most volatile ices (CO, CH4 and N2) have sublimation temperatures below 45 K. Simply raising the ambient temperature above this value would ensure that none of these ices could freeze on grains. However, C/H enrichments of 20–40 over the solar value measured in Uranus and Neptune’s atmospheres indicate that direct gas accretion from the nebula cannot explain these planets’ composition (Baines et al. 1995). We therefore postulate that the outer solar nebula midplane contained CO and CH4 ice, making our choice of ambient temperature appropriate. Further evidence for a cold solar nebula comes from the observed noble gas enrichment in Jupiter’s atmosphere—trapping argon in icy planetesimals requires temperatures of 30 K (Owen et al. 1999).
4 Chemical Model
4.1 Reaction Set
The foundation of our chemical model is the UMIST database RATE95 (Millar et al. 1997). We follow the chemistry of 211 species, 153 gas-phase and 58 ices. Our reaction network contains 2479 reactions, including thermal desorption, gas-grain reactions and grain surface reactions. No non-thermal desorption processes (e.g. cosmic ray heating) are included.
We make the simplifying assumption that radial and vertical motions of gas and dust are slow compared to chemical reaction timescales, and do not track the motion of gas and dust through the nebula. This assumption is true for grain surface reactions and freezeout/desorption, which have short timescales, but gas-phase chemistry proceeds more slowly. Furthermore, inward migration of cm-size particles can deplete the outer solar nebula of ice and concentrate each species at its condensation front (e.g. Ciesla and Cuzzi 2006). In this paper, we ignore relative motions of solid and gas.
Since protostellar disks have a high optical depth to UV radiation, we neglect photoionization in the disk midplane model. However, we include cosmic rays at the standard interstellar flux in parts of the disk with a half-plane surface density lower than the penetration depth of 150 g cm-2 (Umebayashi and Nakano 1981). The cosmic-ray penetration depth is listed in Table 3 with the other free parameters in the chemical model.
The following sections describe our treatment of gas-grain and grain surface reactions and the binding energies we use to calculate those reaction rates.
4.1.1 Grain Surface Reactions
Following Willacy et al. (2006) and Garrod and Herbst (2006), we use rate equations to calculate grain surface reaction rates. Rate equations work in the mean-field approximation, neglecting the stochastic variation of abundances on different grains. The accuracy of rate equations is compromised when a species reacts on the grain surface faster than it can adsorb or desorb: this drives the reactant abundance per grain to less than unity and the mean-field approximation is no longer valid (Caselli et al. 1998). However, unlike stochastic methods that account for the discrete nature of the grains, solving rate equations is computationally tractable even for large-scale simulations. For example, a model that uses direct integration of the master equation (the probability distribution governing reaction rates) has the number of equations in the simulation increasing exponentially with the number of species (Barzel and Biham 2007).
The species most likely to violate the mean-field approximation is atomic hydrogen, which can scan grain surfaces and find reaction partners quickly due to its low atomic weight. While heavier atoms move across grain surfaces by thermal hopping, Hornekaer et al. (2003) find that H atoms often tunnel between adjacent vacancies in the grain surface lattice. This result conflicts with previous work by Katz et al. (1999), who found that the quantum tunneling mechanism is improbable. Although the question of whether quantum tunneling or thermal hopping is primarily responsible for hydrogen mobility on grain surfaces is not resolved, Ruffle and Herbst (2000) show that rate equation simulations limiting H motion to thermal hopping only—and thus slowing down reactions involving atomic H—show good agreement with stochastic methods. We therefore assume thermal hopping regulates all grain surface reaction rates.
The thermal hopping rate to an adjacent vacancy on the grain surface lattice is
| (28) |
where is the binding energy, is the oscillation frequency between the ice and the grain surface, and is the grain surface temperature (assumed to be in equilibrium with the gas). The oscillation frequency is
| (29) |
where is the surface density of lattice vacancies (Hasegawa et al. 1992; Table 3) and is the reactant mass. Typical oscillation frequencies are 1–3 s-1 (Herbst et al. 2005). Following Willacy et al. (2006), we assume that only atoms can move across grain surfaces: molecules, which have higher binding energies, are stationary. All grain surface reactions thus involve at least one atom.
The grain-surface reaction rate () is given by
| (30) |
where and are the thermal hopping rates of reactants 1 and 2, is the grain radius and is the number density of grains. As in the molecular cloud model, we assume a mean grain radius of (Table 3). We take a grain number density of (Table 3), consistent with our assumption of well-mixed grains and gas.
4.1.2 Gas-Grain Reactions
We assume that all species can freeze out on grains except He, which has a very low binding energy, K (Tielens and Hagen 1982). The freeze-out rate is
| (31) |
where is the sticking coefficient (assumed to be 0.3 for H atoms and 1 for all other species; Table 3), is the gas-phase velocity of species , and is the gas-phase number density of . The factor takes into account the attraction of positively charged ions to grains which, on average, are negatively charged (Umebayashi and Nakano 1980):
| (32) |
In Eq. 32, is the Boltzmann constant and is the electron charge. Once an ion hits a grain, we assume it is neutralized by an adsorbed free electron. The thermal desorption rate () at which ice mantle species are returned to the gas is
| (33) |
4.1.3 Binding Energies
The binding energies for each species depend on the surface onto which the molecules adsorb and the mixture of ices on that surface. If each ice were a pure solid, would simply be the sublimation energy and desorption physics could be calculated nonkinetically using vapor pressure. However, molecules in mixed ices may have substantially different binding energies than those in pure ices, so the sublimation energy approximation is inadequate.
The most abundant astrophysical ice is H2O, so the binding energy of each species under protostellar disk conditions is primarily determined by how it behaves on/in an amorphous water-ice matrix. Collings et al. (2004) group binding energies into three categories based on their behavior when co-deposited with H2O: CO-like, water-like, and intermediate. The extremely volatile CO-like species include CO, N2, O2, and CH4. Molecules of these species do not bond efficiently either with themselves or with water: they quickly diffuse through an amorphous H2O matrix and desorb mainly at their sublimation temperatures, which are quite low ( K), with minor amounts remaining trapped in the H2O ice.
Molecules of water-like species, including NH3 and CH3OH, bind more strongly to water than to each other or to a metal substrate. These polar molecules form hydrogen bonds with water that keep them in the solid phase at higher temperatures than possible in their pure form. The data of Collings et al. (2004) show that ammonia-water mixtures are substantially less volatile than pure ammonia, which has a binding energy of only 1110 K (Hasegawa and Herbst 1993). NH3 therefore takes on the binding energy of H2O, 5700 K.
Finally, intermediate species are trapped by H2O to some extent, but do not have the same mobility as CO inside a water-ice matrix. Some co-desorption with H2O occurs, but most desorption takes place at the sublimation energy. These species include H2S, OCS and CH3CN. We have not included the partial co-desorption with water and treat each molecule as having only one specific desorption tmeperature. Table 4 gives the binding energy data used in our model.
4.2 Preprocessing in Molecular Cloud
The ices in protostellar disks have undergone significant chemical processing before giant planet formation begins. To simulate this preprocessing, we model years of molecular cloud evolution to derive input abundances for the protostellar disk. The molecular cloud model uses the same species set and reactions as our disk model, with the addition of photoionization due to the interstellar UV field.
The atoms that form the species in our simulation are H, He, C, N, O, and S. We also include Si adsorption, desorption and ionization as a tracer of the metal population. Except for hydrogen, we assume all material enters the molecular cloud in atomic form, as if coming from a recent supernova. We take (Table 3), so that 99% of hydrogen atoms are in H2. We assume a density of cm-3, a temperature of 10 K and an extinction mag.
Not all of the atomic CHONS material is available to form ices: some will help form the solid grains where ice mantles deposit. To figure out the fraction of C, N, O, and S locked away in grains, we use the atomic abundance ratios in Halley’s comet dust grains reported by Jessberger et al. (1988): C:N:O:Si:S = 814:42:890:185:72. Assuming only trace amounts of silicon remain in the gas phase (gas/grain ), we calculate grain fractions for C, N, O and S as
| (34) |
Using the solar composition of Helling et al. (2000), as in the dynamical disk model, we find = 0.4, 0.1, 0.2 and 0.85 for C, N, O and S respectively (Table 3). This portion of each atom’s inventory does not participate in chemistry and is excluded from the simulation. The gas and ice abundances of major species after 1 Myr of molecular cloud evolution are listed in Table 5. These abundances form the chemical initial conditions for our protostellar disk model.
The major ice species formed in the molecular cloud are H2O, NH3, CO, and CH4. More than 90% of the C, N and O atoms that aren’t part of refractory grains are in these compounds. Sulfur is sequestered in solid H2S after the molecular cloud phase, but this composition is subsequently modified during disk evolution. Minor CNO carriers are HCN, N2 and NO. Figure 7 shows the division of solid C, N and O atoms among the species in our model.
Our molecular cloud model predicts total . Both of these species reside in ice mantles. Abundances of major ices relative to H2O are listed in Table 6. Our CO/CH4 ice ratio is consistent with the Aikawa et al. (2008) models of prestellar cores, which give in an embedded core and in an isolated core. Likewise, Lodders (2003) concluded that the reactions
| (35) |
would deplete CO from presolar gas (note, however, that in our model CH4 forms on grains and not in the gas). Lodders predicts , whereas we find a methane-to-water ratio of 0.38 (Table 6). This discrepancy reflects the fact that we have a higher input oxygen abundance (to match the opacity tables calculated by Semenov [2003]).
We note that the dominant components of interstellar ice mantles are typically H2O, NH3, CO, CO2, and CH3OH (Charnley and Rodgers 2008), which suggests carbon oxide formation in the ISM should be favored and hydrocarbon formation kinetically inhibited. One possible way to reduce the ratio is to lower the assumed atomic hydrogen abundance, which would reduce the efficiency of hydrogenated molecule formation on the grains at early times when atomic carbon is abundant. However, the purpose of this work is to determine the ice mass available for giant planet formation. Since CH4 and CO have such similar condensation temperatures (41 and 35 K, respectively) and we assume , so CO cannot incorporate all available oxygen, is not critical to our final result.
We find that the most abundant nitrogen-carrying molecule is ammonia, with (both species reside in ice mantles). We calculate , which matches the input N/O ratio. Lodders (2003) also predicted that hydrated ammonia was the major nitrogen reservoir in the solar nebula (see §4.3.3 for a discussion of hydrated ammonia in Jupiter and Saturn’s feeding zones). However, Womack et al. (1992) infer in the comet-forming region of the solar nebula from models of elemental nitrogen depletion in Comet Halley.
Overall, our model molecular cloud favors the formation of hydrogenated C, N, and O compounds over oxides or diatomic molecules (except for H2). We next discuss the subsequent chemical evolution of the solar nebula.
4.3 Chemical Model Results: Ice Lines
In this section, we report the locations of important condensation fronts and the relative abundances of the most common ices. We use the gas and ice mixture resulting from the molecular cloud model as the starting point for a radial series of midplane chemical models that span 2 Myr of disk evolution. These models track the ice inventory of the disk midplane as a function of heliocentric distance and time.
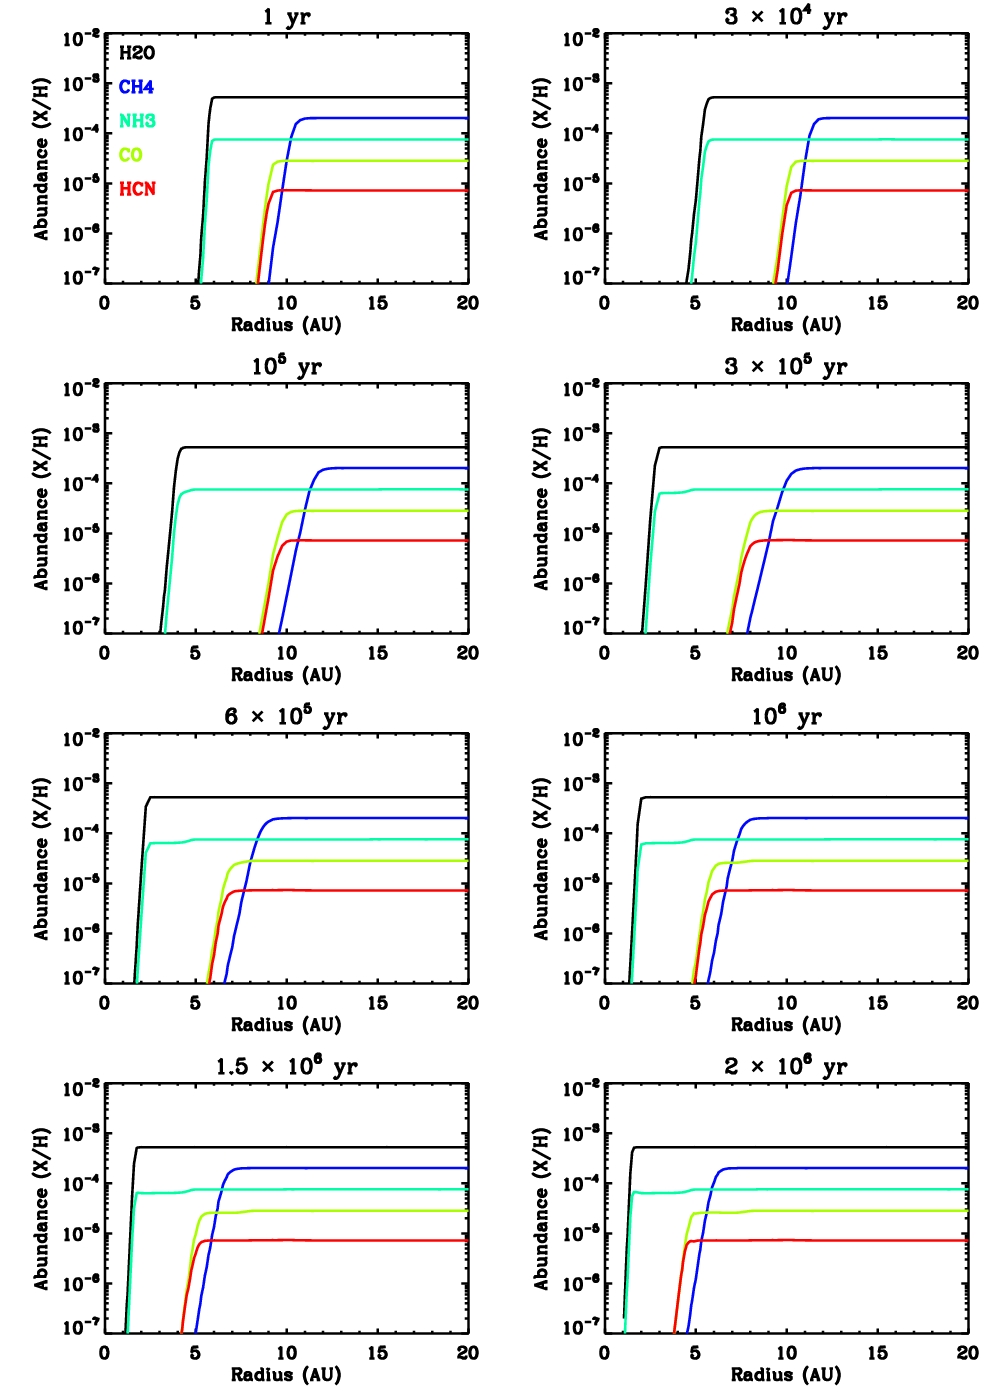
The ices in the disk can be subdivided into two categories: (1) those that form in the molecular cloud and freeze out from the disk gas, and (2) those that form or are destroyed in the warm disk midplane. All Category 1 molecules are highly stable both as gases and solids: in the radiation-shielded disk midplane, their reaction probabilities are very low. The stability and ease of formation of these molecules makes them highly abundant, % of the solar nebula ice mass. In Category 1 are water, methane, CO, ammonia, and HCN. In Category 2 are all sulfur-carrying molecules, simple hydrocarbons, N2, and NO.
4.3.1 Category 1: Stable and Abundant
Figure 8 shows time snapshots of the abundance of Category 1 ice abundances (solid phase only) as a function of radius. Note that the ammonia and water condensation fronts coincide; we will discuss the implications of this further in §4.3.3. The most abundant ice is H2O, followed by methane, ammonia, CO and HCN. These five ices account for 98% of the ice mass in regions where K, the sublimation temperature of CO.
In Fig. 8, we see the H2O condensation front sweeping from 6 AU at to 1.5 AU after 2 Myr. Observations of the asteroid belt place the H2O ice line at 2.7 AU (Abe et al. 2000; Rivkin et al. 2002), a position it reaches at yr in our model. The slow motion of the snow line through the inner solar system could perhaps account for the H2O abundance gradient observed in the asteroid belt (Barucci et al. 1996): we find that icy grains are present for years longer at 3 AU than at 2 AU. The snow line crosses Jupiter’s heliocentric distance, 5.2 AU, after only yr, leaving ample time for the formation of Jupiter’s core from icy planetesimals.
If we assume Saturn formed in situ at 9.5 AU, primordial methane accretion onto both the giant planet and its satellites is possible. We find that grain mantles in Saturn’s feeding zone should have after yr. CH4 is 90% solid at 9.5 AU after yr. We note that the C/H ratio in Saturn’s atmosphere has recently been revised upward by a factor of 2 (Flasar et al. 2005).
We find that if Uranus and Neptune formed outside 12 AU, their core-forming planetesimals contained both CH4 and CO. The composition of both planets strongly suggests that they accreted carbonaceous ices: is 41 for Neptune and for Uranus (Lodders and Fegley 1994). Furthermore, Grundy et al. (2002) find that methane ice is widely distributed across the surface of Triton.
4.3.2 Category 2: Chemically Active
In Fig. 8 we see that the typical behavior of an ice line is to move inward as the nebula cools. This can happen only if the molecule is relatively inert. Sulfur species are missing from Fig. 8 because H2S, the dominant sulfuric ice at with 99.6% of the sulfur atoms, does not survive in the gas phase. Likewise, while C3Hn chains are stable and freezeout-dominated in our model, acetylene ice partially hydrogenates to form ethylene and ethane. Gaseous NO and N2 participate in ion exchange reactions in the gas, reducing the abundance available for ice formation. In this section, we consider the sulfuric, nitric and hydrocarbon ice systems.
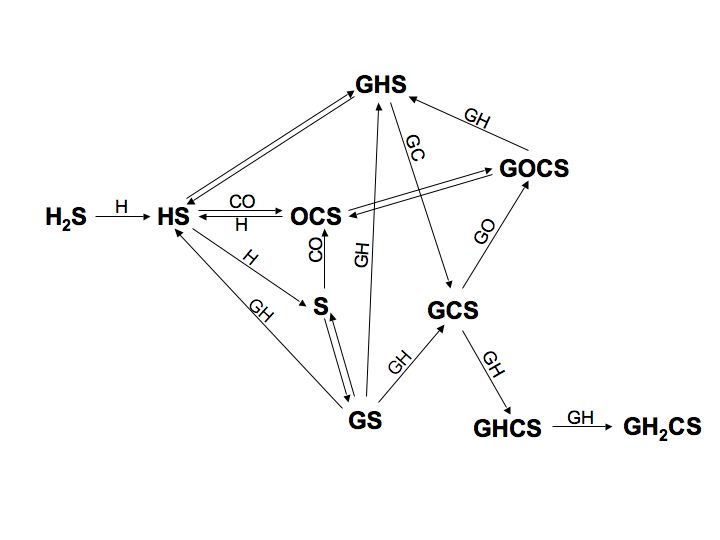
As soon as our midplane chemical model begins, the reaction
| (36) |
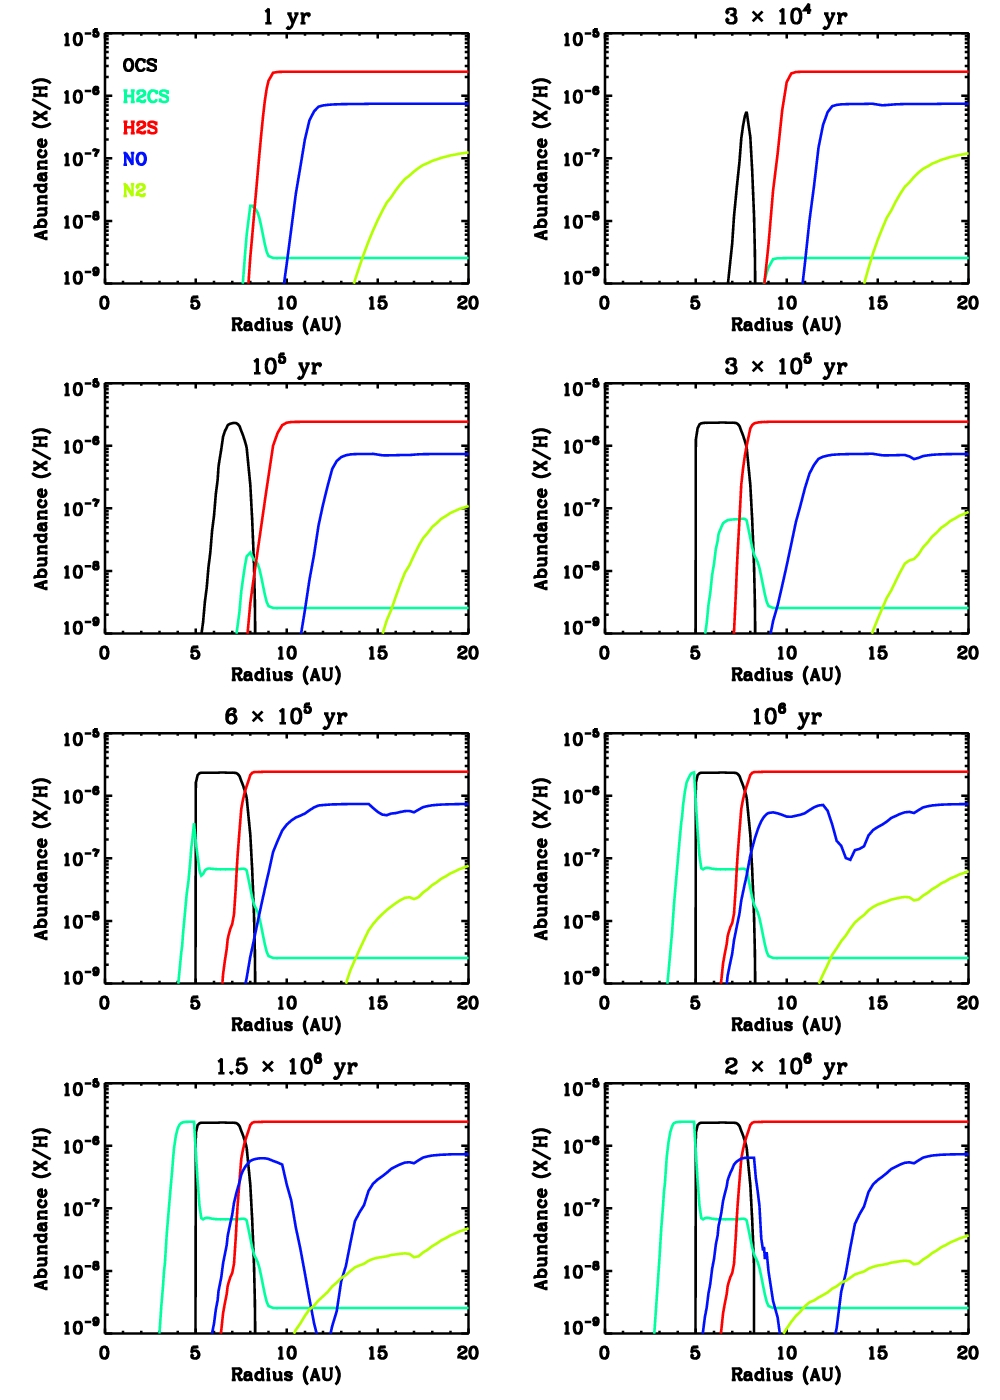
starts destroying gaseous H2S where temperature is above K. The product HS then initiates a network of reactions that form OCS and H2CS. The reactions linking the main sulfur-carrying molecules are shown in Fig. 9. We do not find any depletion of H2CS once formed on grains. Figure 10 shows time snapshots of the abundances (solid phase only) of the main sulfur-carrying molecules H2S, OCS and H2CS. After 2 Myr, we see a banded structure where H2S dominates at AU, OCS is most abundant between 5 and 8 AU and H2CS dominates at AU.
H2S remains in the outer solar nebula because the gas at AU never gets hotter than the H2S sublimation temperature in our model. This scenario may be physically unrealistic: infalling molecular cloud material is likely heated in an accretion shock during disk formation. However, if we examine the total abundance of icy sulfur atoms, , we see that it is conserved after OCS formation finishes at yr. From Fig. 10, we can imagine a sulfurous ice line sweeping through the solar nebula, moving from 8.5 AU at to 2.5 AU after 2 Myr.
Figure 10 also shows the abundances of solid NO and N2. NO is chemically active during the late stages of the solar nebula, yr. Even when the solar nebula temperature drops below the nominal sublimation temperature of NO, some thermal desorption still takes place, albeit at a much-reduced rate (see Eq. 33). For most species, re-freezing after desorption occurs faster than reactions in the gas and no ice molecules are lost. However, NO can be destroyed in the gas by reactions with . Once the half-plane surface density drops below the cosmic ray penetration depth at late times, the production rate of increases by 33% due to the reaction of with cosmic ray-produced photons:
| (37) |
Thermally desorbed NO atoms are then efficiently removed from the gas before refreezing by the reaction sequence
| (38) |
Laboratory work by Öberg et al. (2005) indicates that N2 is extremely volatile, with K. This puts its sublimation temperature near the assumed ambient temperature of our protostellar disk simulation, 20 K. The smooth shape of the N2 abundance curve at yr reflects the midplane temperature’s asymptotic approach to isothermality at 20 K. As the disk evolves, the N2 ice line moves inward, but the overall N2 abundance declines due to the gas-phase reaction
| (39) |
The ion then begins a sequence of reactions with H2 that produce , , and finally the ammonium ion . Ammonium recombines with an electron to form NH3 + H, so the net effect is to convert gaseous N2 into NH3.
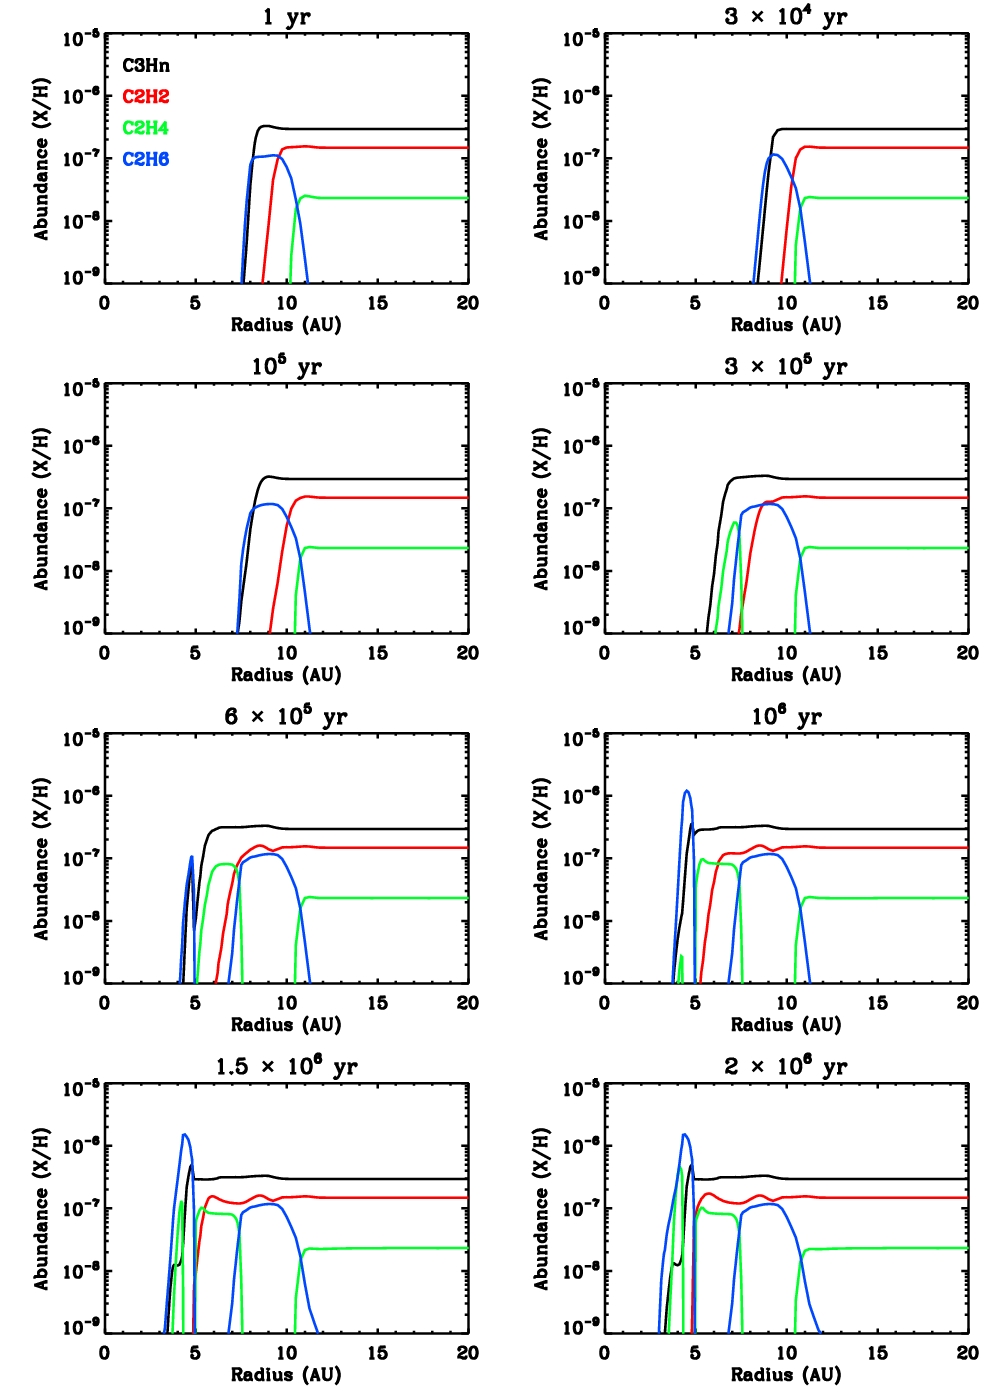
Our model includes the small aliphatic hydrocarbons C2H2, C2H4, C2H6, C3H2 and C3H4. We do not include longer chains in our model—we merely use these five species to find the location of the “oil line” of icy hydrocarbons. Lodders (2004) suggested that tarry compounds, rather than water, provided the bulk of the solid mass for Jupiter’s core. This work does not truly test that hypothesis, since Lodders’ scenario requires a substantial amount of hydrocarbons that are more refractory than water (our light oils have sublimation temperatures of 55-70 K). PAHs would be suitable tar candidates, but we do not include them in our model for lack of accurate binding energy measurements. We plan on incorporating PAH freezeout into future work, but we note that Jupiter falls inside the water-ice line for all but the first 50,000 yr of disk evolution.
Figure 11 shows the evolution of the hydrocarbon ice lines. The most abundant hydrocarbons in our simulation are C3Hn chains, which are at the end of our reaction sequence. This suggests that concatenation of small carbon chains is efficient. The small hydrocarbons in our model have similar sublimation temperatures, creating an “oil line” that moves from 8 AU at to 3 AU after 2 Myr.
For the C2Hn hydrocarbons, acetylene dominates over ethylene and ethane in the trans-Saturnian region, AU. The activation barrier K for the reaction (Hasegawa et al. 1992), which has to break the strong C-C triple bond, means that at the cold temperatures required for acetylene to deposit on grain surfaces, hydrogenation proceeds slowly. Only when the disk is near the acetylene sublimation temperature ( K) does a significant amount of ethane form. Throughout most of the disk, ethylene is more abundant than ethane. However, an “ethylene gap” forms between 7 and 10 AU after yr. We explain the ethylene gap as follows: between and yr, 7–10 AU region takes on mass due to an outward-moving density wave (recall the discussion in §3.7.1). This surface density increase causes a temperature increase of K, increasing the rate of ethylene hydrogenation.
4.3.3 The Snow-Ammonia Line
Since we have adapted lab results showing co-desorption of water and ammonia (Collings et al. 2004) for our model, we find that the ammonia and water condensation fronts coincide. This statement may seem controversial, and indeed, further lab experiments are needed to verify that hydrogen bonding between the species is strong enough to govern ammonia desorption. However, the composition of Jupiter, Saturn and their satellites provides strong evidence for primordial ammonia-rich planetesimals between 5 and 10 AU.
Lopes et al. (2007) examined the rheological properties of a cryovolcanic flow on Titan with Synthetic Aperture Radar imaging and found a slurry composition most consistent with an ammonia-water-methanol mixture (recall that methanol is another ice found to co-desorb with water in lab experiments). The presence of ammonia in cryovolcanic outflows strongly suggests primordial ammonia accretion: late-stage volatile delivery by comets would provide a small surface reservoir of ammonia but not embed it in the geologically active subsurface. Based on the low temperatures ( K) necessary for trapping N2 in water ice, Owen (2000) argued that Titan’s massive nitrogen atmosphere originally supplied as NH3, unmodified from its relative abundance in the outer solar nebula.
Other Saturnian moons also show evidence of primordial ammonia accretion: Prentice (2007) calculates that Iapetus is 27% ammonia by mass, assuming homologous contraction of the Saturnian subnebula and placing Enceladus just at the stability point of liquid water. The source material for the rock/ice Iapetus cannot be solar nebula gas, nor could N2 have provided the initial nitrogen budget: with 34% rock and 34% H2O, there would have been no free hydrogen reservoir for ammonia formation. Freeman et al. (2007) suggest that an ammonia-water ice mantle is necessary to explain the subsurface ocean driving Enceladus’ south pole geyser. Finally, Prentice (2006) finds that the lack of compressional features on the surface of Rhea, which are expected to result from phase II of H2O crystalline ice, favors an ammonia-rich satellite composition (25% NH3 by mass), since ammonia inhibits phase II H2O ice formation.
In the Jovian system, conducting subsurface oceans are required to explain the magnetic fields of Europa, Ganymede, and Callisto. One way to lower water’s melting point and maintain liquid oceans is to mix in ammonia (Hussmann et al. 2006). Spohn and Schubert (2003) use equilibrium heat transfer models to confirm the likelihood of subsurface ammonia-water oceans on all Galilean satellites except Io.
Perhaps the best piece of evidence for ammonia-containing planetesimals between 5 and 10 AU is the nitrogen enrichment in Jupiter and Saturn’s atmospheres. for Jupiter and 2–4 for Saturn (Owen and Encrenaz 2003). Such a large enrichment suggests a non-gaseous origin for nitrogen in both planets. Trapping N2 or NH3 in clathrate hydrates is possible, but Hersant et al. (2004) find that the ammonia clathrate cannot form until 0.9 Myr after solar nebula formation: the ammonia clathrate is more volatile than a co-deposited ammonia-water ice mixture. Based on the upward revision of Saturn’s C/H ratio, Hersant et al. (2008) suggest that ammonia was present as a hydrate, rather than a clathrate, in Saturn’s feeding zone. We recommend that the canonical “snow line” be reconceived as a water ice-ammonia line, and that NH3 be added to the volatile inventory of Jupiter- and Saturn-forming planetesimals.
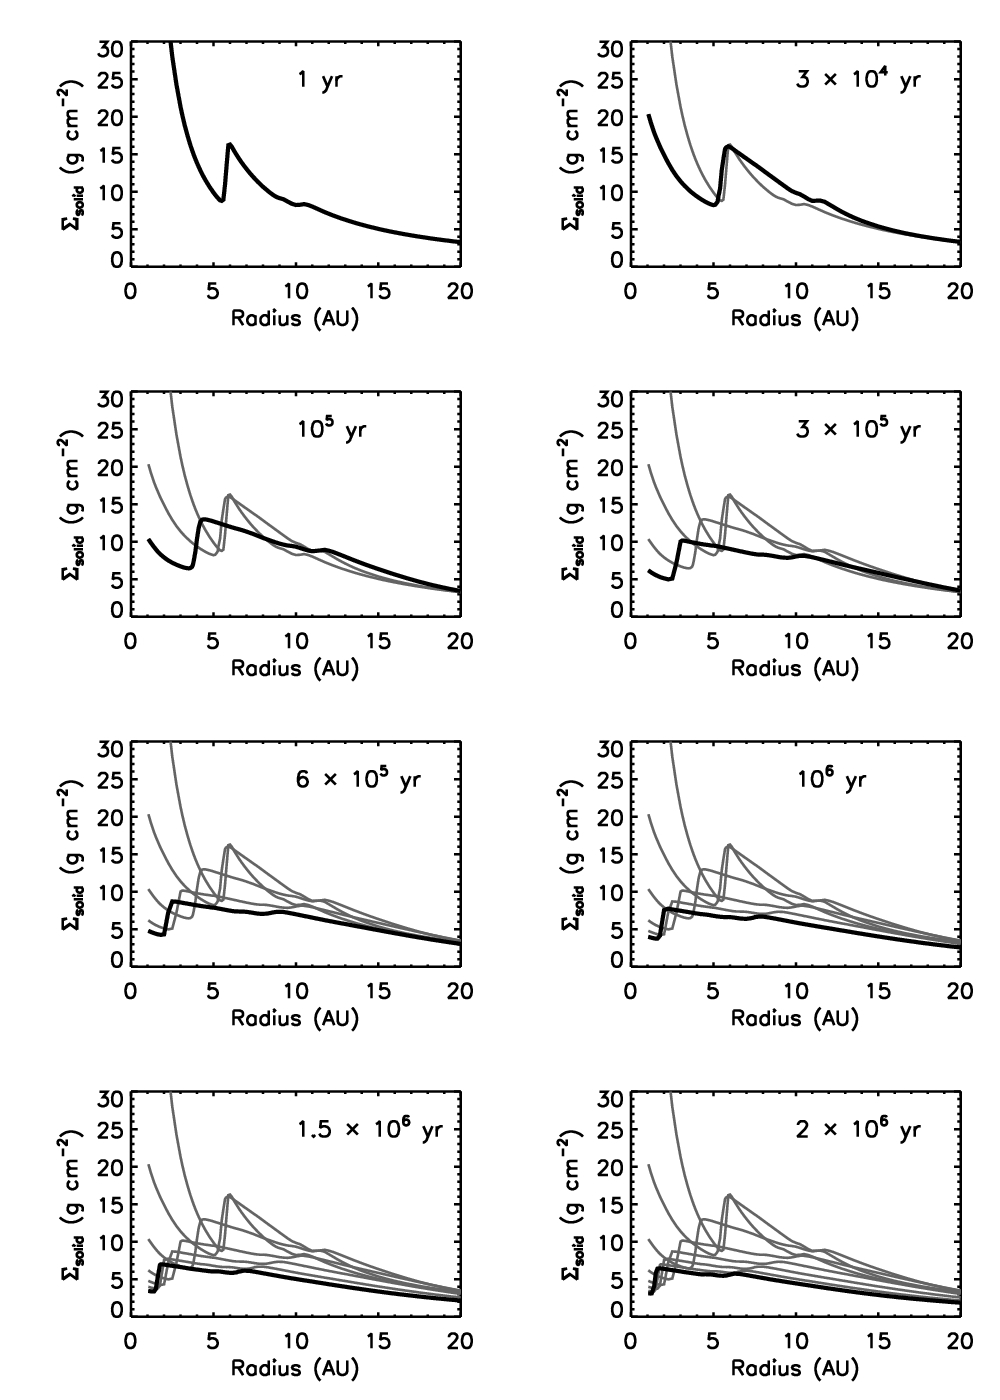
5 Solid Surface Density
Knowing the solid-phase abundance of each ice species and the location of its condensation front, we can now calculate the solid surface density available for planet formation everywhere in the disk. We first calculate the gas/solid mass ratio
| (40) |
where is the mean molecular weight of a species, is its abundance, and the subscripts and denote gas and solid species, respectively. We include Na, Mg, Si, Fe, Ni, Al and Ca in the solid inventory in solar proportions and assume these atoms form refractory compounds. Finally, we calculate the solid surface density as
| (41) |
Figure 12 shows the evolution of the solid surface density distribution in the solar nebula. Note that as the disk evolves, the solids should grow and decouple from the gas, whereas these solid surface density calculations assume grains and gas are well mixed. We see the large bump caused by the snow-ammonia line beginning at 6 AU and moving inward to 1.5 AU after 2 Myr. In addition, methane adsorption creates a second local maximum in the solid surface density profile at 11 AU, which moves inward to 6.5 AU by the end of the simulation.
Panels 1 and 2 in Fig. 12, and yr, show the effect of the decretion flow on the solid surface density profile. The solid mass between 6 and 14 AU actually increases during the early stages of disk evolution, at the expense of the inner 4 AU. The next panel, yr, shows the further solid surface density increase between 12 and 18 AU. Disk annuli that increase in surface density also heat up, and the methane bump consequently moves outward for the first yr.
Pollack et al. (1996) presented core accretion models of Jupiter, Saturn, and Uranus, beginning with solid surface densities of 10, 3, and 0.75 g cm-2. While these simulations showed the plausibility of giant planet formation by core accretion, the planet formation timescales calculated were too long: Jupiter, Saturn and Uranus took 8, 9.6, and 16 Myr to form, respectively. Since runaway solid core growth rate is directly proportional to surface density (Eq. 1), we see that having a high surface density speeds up giant planet formation.
If one assumes that nearly 100% of the available solids were incorporated into planetesimals, our results give starting solid surface densities that are far more conducive to giant planet formation than those from Pollack et al. (1996). (The of Pollack et al. (1996) refers specifically to 100-km planetesimals, not smaller bodies or grains.) Table 7 lists solid surface density as a function of radius and time in the solar nebula. Note that these results assume a substantial population of small grains is always available for ice deposition.
We consider yr the extreme upper limit of the planetesimal formation timescale, which Hubbard and Blackman [2006] predict to be yr. However, we continue the disk simulation out to 2 Myr in order to calculate nebular gas temperature, density and composition, which are necessary for models of giant planet formation that build on this work (see, for example, the new Saturn formation simulation by Dodson-Robinson et al. [2008]). At Saturn’s heliocentric distance, 9.5 AU, the solid surface density never drops below 8.7 g cm-2 during the first yr of disk evolution. This large solid surface density should provide more than a factor of 3 speedup in Saturn’s solid growth phase over the Pollack et al. results.
For Uranus, the relative increase in solids is even more pronounced: at 20 AU, the minimum solid surface density during the first yr is 3.3 g cm-2, for a factor of 4 speedup in runaway core growth. Moving Uranus’ starting position inward to 16 AU, in accordance with the Nice model of planet migration (Tsiganis et al. 2005), provides a starting of not less than 4.9 g cm-2, in addition to the speedup given by a higher angular-frequency orbit. The prospects for Neptune to form rapidly at AU, as predicted by the Nice model, are quite good: g cm-2.
Hubickyj et al. (2005) provided an update to the Pollack et al. simulations of Jupiter’s growth, this time assuming rapid grain settling and sublimation would lower opacities of the gaseous protoplanetary envelope and speed up its contraction. (Even if we assume low-opacity envelopes for Saturn and Uranus, they still require high solid surface densities to form quickly, as their solid growth stages both take Myr in the Pollack et al. models.) Hubickyj et al. found that, given a planetesimal surface density of 10 g cm-2, Jupiter could reach its present mass in 2.3 Myr. Our work shows that this starting condition for Jupiter is not only viable but likely: we predict solid surface densities not less than 8.2 g cm-2 with refractory material only and as high as 14.5 g cm-2 after the ice line moves through at yr.
6 Conclusions
By combining a viscously evolving protostellar disk model with a kinetic model of ice formation, we have calculated the time-evolving solid surface density available for giant planet formation. We find three results that are highly favorable for gas- and ice-giant formation:
-
1.
The total (gas+solid) surface density distribution evolves toward uniformity, with an outward-moving wave depositing mass in the giant planet-forming region between 5 and 20 AU,
-
2.
The ammonia and water ice lines coincide, providing a mass enhancement of 7% at the snow line over pure water condensation, and
-
3.
Methane and CO condensation beyond 12 AU add mass to Uranus and potentially Neptune’s feeding zones.
The next step is to use a core-accretion model to calculate how fast Saturn, Uranus and Neptune can form with our enhanced surface densities. The same methods used by Hubickyj et al. (2005) should work for Saturn. However, an updated method of tracking planetesimal scattering may be required for feeding zones with AU, where orbital velocities of planetesimals decrease to –50 times their escape velocities and self-stirring begins to affect the dynamics of the planetesimal disk. By calculating solid surface density as a function of radius and time self-consistently with viscous evolution of the protostellar disk, instead of assuming a single gas/solid ratio covers the entire giant planet-forming region of the solar nebula, the research presented here allows core accretion simulations to be fully deterministic.
One area that requires more work is the viscous evolution of an MRI-turbulent disk with a dead zone, where varies with radius. Annuli with an inactive midplane would have a lower column-averaged value of , which could slow or stop the movement of mass from the inner solar nebula to the giant planet-forming region. However, Turner and Sano (2008) find that a toroidal magnetic field component produced in the midplane by shear drives a laminar accretion flow even through the nonturbulent dead zone.
Since our focus is on increasing the solid mass available for giant planet cores, we have neglected clathrate hydrates in our chemical model, preferring to tap into the large mass reservoir provided by ices. However, noble gas enrichment in the giant planet atmospheres suggests that clathration is very important, if not for building planet cores, then at least for determining atmospheric composition during the late stages of accretion (Hersant et al. 2004). The presence of PAHs in carbonaceous meteorites, cometary dust and Iapetus implies that these, too, might be an important solid mass reservoir. It is not yet known whether PAHs survive in the ISM or form primarily in the warm disk. Woods and Willacy (2007) present a mechanism for benzene formation in the inner 3 AU of the solar nebula. We are investigating the possibility of including PAH chemistry in future work.
Finally, we note that the ALMA Design Reference Science Plan contains a proposal for detecting the snow line in nearby protoplanetary disks. We submit that the CO ice line would be an equally valuable detection, since this work strongly suggests that CO ice should be part of the solid inventory of the Uranus- and Neptune-building planetesimals. In a 1 Myr-old solar nebula analog in Taurus (140 pc), the CO ice line would lie 6 resolution units from the star when observing the CO () transition.
We thank Julie Moses, Mark Marley and Doug Lin for helpful discussions about the project design. S.D.R. was supported by grants from the NSF Graduate Research Fellowship program and the Achievement Rewards for College Scientists Foundation. K.W. and N.T. were supported by the JPL Research and Technology Development Program. P.B. received funding from NSF Grant AST-0507424 and NASA Origins Grant NNX08AH82G.
References
- Abe et al. (2000) Abe, Y., Ohtani, E., Okuchi, T., Righter, K., Draker, M. 2000. Water in the Early Earth. Origin of the earth and moon, edited by R.M. Canup and K. Righter and 69 collaborating authors. Tucson: University of Arizona Press, p. 413-433
- A’Hearn (2008) A’Hearn, M. F. 2008. Deep Impact and the Origin and Evolution of Cometary Nuclei. Space Science Reviews 56.
- Aikawa et al. (1996) Aikawa, Y., Miyama, S. M., Nakano, T., Umebayashi, T. 1996. Evolution of Molecular Abundance in Gaseous Disks around Young Stars: Depletion of CO Molecules. Astrophysical Journal 467, 684.
- Aikawa et al. (2008) Aikawa, Y., Wakelam, V., Garrod, R. T., Herbst, E. 2008. Molecular Evolution and Star Formation: From Prestellar Cores to Protostellar Cores. Astrophysical Journal 674, 984.
- Alexander et al. (2006) Alexander, R. D., Clarke, C. J., Pringle, J. E. 2006. Photoevaporation of protoplanetary discs - II. Evolutionary models and observable properties. Monthly Notices of the Royal Astronomical Society 369, 229-239.
- Allamandola and Sandford (1994) Allamandola, L. J., Sandford, S. A. 1994. The First Symposium on the Infrared Cirrus and Diffuse Interstellar Clouds, 58, 302
- Allen and Robinson (1997) Allen, M., Robinson, G. W. 1977. The molecular composition of dense interstellar clouds. Astrophysical Journal 212, 396-415.
- Anders and Grevesse (1989) Anders, E., Grevesse, N. 1989. Abundances of the elements - Meteoritic and solar. Geochimica et Cosmochimica Acta 53, 197-214
- Balbus and Hawley (1991) Balbus, S. A., Hawley, J. F. 1991. A powerful local shear instability in weakly magnetized disks. I - Linear analysis. II - Nonlinear evolution. Astrophysical Journal 376, 214-233.
- Barucci et al. (1996) Barucci, M. A., Fulchignoni, M., Lazzarin, M. 1996. Water ice in primitive asteroids? Planetary and Space Science 44, 1047-1049.
- Barzel and Biham (2007) Barzel, B., Biham, O. 2007. Efficient stochastic simulations of complex reaction networks on surfaces. Journal of Chemical Physics 127, 4703.
- Bell et al. (1997) Bell, K. R., Cassen, P. M., Klahr, H. H., Henning, Th. 1997. The Structure and Appearance of Protostellar Accretion Disks: Limits on Disk Flaring. Astrophysical Journal 486, 372.
- Boss (2005) Boss, A. P. 2005. Evolution of the Solar Nebula. VII. Formation and Survival of Protoplanets Formed by Disk Instability. Astrophysical Journal 629, 535-548.
- Caselli et al. (1998) Caselli, P., Hasegawa, T. I., Herbst, E. 1998. A Proposed Modification of the Rate Equations for Reactions on Grain Surfaces. Astrophysical Journal 495, 309.
- Cazaux and Tielens (2002) Cazaux, S., Tielens, A. G. G. M. 2002. Molecular Hydrogen Formation in the Interstellar Medium. Astrophysical Journal 575, L29-L32.
- Chiang and Goldreich (1997) Chiang, E. I., Goldreich, P. 1997. Spectral Energy Distributions of T Tauri Stars with Passive Circumstellar Disks. Astrophysical Journal 490, 368.
- Ciesla (2007) Ciesla, F. J. 2007. Outward Transport of High-Temperature Materials Arount the Midplane of the Solar Nebula. Science 318, 613.
- Ciesla and Cuzzi (2006) Ciesla, F. J., Cuzzi, J. N. 2006. The evolution of the water distribution in a viscous protoplanetary disk. Icarus 181, 178-204.
- Charnley and Rodgers (2008) Charnley, S. B., Rodgers, S. D. 2008. Interstellar Reservoirs of Cometary Matter. Space Science Reviews 40.
- Collings et al. (2004) Collings, M. P., Anderson, M. A., Chen, R., Dever, J. W., Viti, S., Williams, D. A., McCoustra, M. R. S. 2004. A laboratory survey of the thermal desorption of astrophysically relevant molecules. Monthly Notices of the Royal Astronomical Society 354, 1133-1140.
- D’Alessio et al. (2006) D’Alessio, P., Calvet, N., Hartmann, L., Franco-Hernández, R., Servín, H. 2006. Effects of Dust Growth and Settling in T Tauri Disks. Astrophysical Journal 638, 314-335.
- Desch (2007) Desch, S. J. 2007. Mass Distribution and Planet Formation in the Solar Nebula. Astrophysical Journal 671, 878-893.
- Dodson-Robinson et al. (2008) Dodson-Robinson, S. E., Bodenheimer, P., Laughlin, G., Willacy, K., Turner, N. J., Beichman, C. A. 2008. Saturn Forms by Core Accretion in 3.4 Myr. ArXiv e-prints arXiv:0810.0228 (accepted for publication in Astrophysical Journal Letters).
- Dullemond et al. (2006) Dullemond, C. P., Apai, D., Walch, S. 2006. Crystalline Silicates as a Probe of Disk Formation History. Astrophysical Journal 640, L67-L70.
- Ferguson et al. (2005) Ferguson, J. W., Alexander, D. R., Allard, F., Barman, T., Bodnarik, J. G., Hauschildt, P. T., Heffner-Wong, A., Tamanai, A. 2005. Low-Temperature Opacities. Astrophysical Journal 623, 585-596.
- Flasar et al. (2005) Flasar, F. M., and 45 colleagues. 2005. Temperatures, Winds, and Composition in the Saturnian System. Science 307, 1247-1251.
- Fraser et al. (2001) Fraser, H. J., Collings, M. P., McCoustra, M. R. S., Williams, D. A. 2001. Thermal desorption of water ice in the interstellar medium. Monthly Notices of the Royal Astronomical Society 327, 1165-1172
- Freeman et al. (2007) Freeman, J., Stegman, D., May, D. 2007. The Role of Ammonia in the Evolution of Enceladus. AGU Fall Meeting Abstracts 7.
- Garrod and Herbst (2006) Garrod, R. T., Herbst, E. 2006. Formation of methyl formate and other organic species in the warm-up phase of hot molecular cores. Astronomy and Astrophysics 457, 927-936.
- Grundy et al. (2002) Grundy, W. M., Buie, M. W., Spencer, J. R. 2003. Spectroscopy of Pluto and Triton at 3-4 Microns: Possible Evidence for Wide Distribution of Nonvolatile Solids. Astronomical Journal 124, 2273-2278.
- Haisch et al. (2001) Haisch, K. E., Jr., Lada, E. A., Lada, C. J. 2001. Disk Frequencies and Lifetimes in Young Clusters. Astrophysical Journal 553, L153-L156.
- Hallenbeck et al. (2000) Hallenbeck, S. L., Nuth, J. A. III, Nelson, R. N. 2000. Evolving Optical Properties of Annealing Silicate Grains: From Amorphous Condensate to Crystalline Mineral. Astrophysical Journal 535, 247-255.
- Harker and Desch (2002) Harker, D. E., Desch, S. J. 2002. Annealing of Silicate Dust by Nebular Shocks at 10 AU. Astrophysical Journal 565, L109-L112.
- Hasegawa and Herbst (1993) Hasegawa, T. I., Herbst, E. 1993. New gas-grain chemical models of quiescent dense interstellar clouds - The effects of H2 tunnelling reactions and cosmic ray induced desorption. Monthly Notices of the Royal Astronomical Society 261, 83-102
- Hasegawa et al. (1992) Hasegawa, T. I., Herbst, E., Leung, C. M. 1992. Models of gas-grain chemistry in dense interstellar clouds with complex organic molecules. Astrophysical Journal Supplement Series 82, 167-195.
- Hawley and Stone (1998) Hawley, J. F., Stone, J. M. 1998. Nonlinear Evolution of the Magnetorotational Instability in Ion-Neutral Disks. Astrophysical Journal 501, 758.
- Hawley et al. (1999) Hawley, J. F., Balbus, S. A., Winters, W. F. 1999. Local Hydrodynamic Stability of Accretion Disks. Astrophysical Journal 518, 394-404.
- Hayashi (1981) Hayashi, C. 1981. Structure of the Solar Nebula, Growth and Decay of Magnetic Fields and Effects of Magnetic and Turbulent Viscosities on the Nebula. Progress of Theoretical Physics Supplement 70, 35-53.
- Helling et al. (2000) Helling, Ch., Winters, J. M., Sedlmayr, E. 2000. Circumstellar dust shells around long-period variables. VII. The role of molecular opacities. Astronomy and Astrophysics 358, 651-664.
- Herbst et al. (2005) Herbst, E., Chang, Q., Cuppen, H. M. 2005. Chemistry on interstellar grains. Journal of Physics Conference Series, 6, 18-35.
- Hersant et al. (2001) Hersant, F., Gautier, D., Huré, J.-M. 2001. A Two-dimensional Model for the Primordial Nebula Constrained by D/H Measurements in the Solar System: Implications for the Formation of Giant Planets. Astrophysical Journal 554, 391-407.
- Hersant et al. (2004) Hersant, F., Gautier, D., Lunine, J. I. 2004. Enrichment in volatiles in the giant planets of the Solar System. Planetary and Space Science 52, 623-641.
- Hornekaer et al. (2003) Hornekaer, L., Baurichter, A., Petrunin, V. V., Field, D., Luntz, A. C. 2003. Importance of Surface Morphology in Interstellar H2 Formation. Science 302, 1943-1946.
- Hubbard and Blackman (2006) Hubbard, A., Blackman, E. G. 2006. Planetesimal growth in turbulent discs before the onset of gravitational instability. New Astronomy 12, 246-263.
- Hubickyj et al. (2005) Hubickyj, O., Bodenheimer, P., Lissauer, J. J. 2005. Accretion of the gaseous envelope of Jupiter around a 5-10 Earth-mass core. Icarus 179, 415-431.
- Hussmann et al. (2006) Hussmann, H., Sohl, F., Spohn, T. 2006. Subsurface oceans and deep interiors of medium-sized outer planet satellites and large trans-neptunian objects. Icarus 185, 258-273.
- Ilgner and Nelson (2006) Ilgner, M., Nelson, R. P. 2006. On the ionisation fraction in protoplanetary disks. II. The effect of turbulent mixing on gas-phase chemistry. Astronomy and Astrophysics 445, 223-232.
- Jessberger et al. (1988) Jessberger, E. K., Christoforidis, A., Kissel, J. 1988. Aspects of the major element composition of Halley’s dust. Nature 332, 691-695.
- Keller et al. (2006) Keller, L. P., and 32 colleagues. 2006. Infrared Spectroscopy of Comet 81P/Wild 2 Samples Returned by Stardust. Science 314, 1728.
- Kippenhahn and Weigert (1994) Kippenhahn, R., Weigert, A. 1994, Stellar Structure and Evolution (Berlin: Springer-Verlag)
- Kretke and Lin (2007) Kretke, K. A., Lin, D. N. C. 2007. Grain Retention and Formation of Planetesimals near the Snow Line in MRI-driven Turbulent Protoplanetary Disks. Astrophysical Journal 664, L55-L58.
- Lodders (2003) Lodders, K. 2003. Solar System Abundances and Condensation Temperatures of the Elements. Astrophysical Journal 591, 1220-1247.
- Lodders (2004) Lodders, K. 2004. Jupiter Formed with More Tar than Ice. Astrophysical Journal 611, 587-597.
- Lodders and Fegley (1994) Lodders, K., Fegley, B. 1994. The origin of carbon monoxide in Neptune’s atmosphere. Icarus, 112, 368-375.
- Lopes et al. (2007) Lopes, R. M. C., and 43 colleagues 2007. Cryovolcanic features on Titan’s surface as revealed by the Cassini Titan Radar Mapper. Icarus 186, 395-412.
- Lynden-Bell and Pringle (1974) Lynden-Bell, D., Pringle, J. E. 1974. The evolution of viscous discs and the origin of the nebular variables. Monthly Notices of the Royal Astronomical Society 168, 603-637.
- Lyra et al. (2008) Lyra, W., Johansen, A., Klahr, H., and Piskunov, N. 2008. Global magnetohydrodynamical models of turbulence in protoplanetary disks. I. A cylindrical potential on a Cartesian grid and transport of solids. Astronomy and Astrophysics 479, 883-901.
- Mihalas (1978) Mihalas, D. 1978, Stellar Atmospheres (San Francisco: Freeman)
- Millar et al. (1997) Millar, T. J., Farquhar, P. R. A., Willacy, K. 1997. The UMIST Database for Astrochemistry 1995. Astronomy and Astrophysics Supplement Series 121, 139-185.
- Milsom et al. (1994) Milsom, J. A., Chen, X., Taam, R. 1994. The vertical structure and stability of accretion disks surrounding black holes and neutron stars. Astrophysical Journal 421, 668-676.
- Öberg et al. (2005) Öberg, K. I., van Broekhuizen, F., Fraser, H. J., Bisschop, S. E., van Dishoeck, E. F., Schlemmer, S. 2005. Competition between CO and N2 Desorption from Interstellar Ices. Astrophysical Journal 631, L33-L36.
- Owen (2000) Owen, T. 2000. On the origin of Titan’s atmosphere. Planetary and Space Science 48, 747-752.
- Owen and Encrenaz (2003) Owen, T., Encrenaz, T. 2003. Element Abundances and Isotope Ratios in the Giant Planets and Titan. Space Science Reviews 106, 121-138.
- Podolak (2003) Podolak, M. 2003. The contribution of small grains to the opacity of protoplanetary atmospheres. Icarus 165, 428-437.
- Pollack et al. (1996) Pollack, J. B., Hubickyj, O., Bodenheimer, P., Lissauer, J. J., Podolak, M., Greenzweig, Y. 1996. Formation of the Giant Planets by Concurrent Accretion of Solids and Gas. Icarus 124, 62-85.
- Prentice (2007) Prentice, A. J. 2007. Iapetus: a Prediction for Bulk Chemical Composition, Internal Physical Structure and Origin. AGU Fall Meeting Abstracts 1432.
- Pringle (1981) Pringle, J. E. 1981. Accretion discs in astrophysics. Annual Review of Astronomy and Astrophysics 19, 137-162.
- Press et al. (1992) Press, W. H., Teukolsky, S. A., Vetterling, W. T., Flannery, B. P. 1992, Numerical Recipes in Fortran 77, Second Edition (Cambridge: Cambridge University Press)
- Reyes-Ruiz et al. (2003) Reyes-Ruiz, M., Pérez-Tijerina, E., Sánchez-Salcedo, F. J. 2003. The Magneto-Rotational Instability in Protoplanetary Disks. Revista Mexicana de Astronomia y Astrofisica Conference Series 18, 92-96.
- Rivkin et al. (2000) Rivkin, A. S., Howell, E. S., Vilas, F., Lebofsky, L. A. 2002. Hydrated Minerals on Asteroids: The Astronomical Record. Asteroids III 235-253.
- Ruffle and Herbst (2000) Ruffle, D. P., Herbst, E. 2000. New models of interstellar gas-grain chemistry - I. Surface diffusion rates. Monthly Notices of the Royal Astronomical Society 319, 837-850.
- Ruden and Lin (1986) Ruden, S. P., Lin, D. N. C. 1986. The global evolution of the primordial solar nebula. Astrophysical Journal 308, 883-901.
- Ruden and Pollack (1991) Ruden, S. P., Pollack, J. B. 1991. The dynamical evolution of the protosolar nebula. Astrophysical Journal 375, 740-760.
- Safronov (1969) Safronov, V. S. 1969, In Russian, English translation: NASA-TTF-677, 1972
- Sandford and Allamandola (1990) Sandford, S. A., Allamandola, L. J. 1990. The volume- and surface-binding energies of ice systems containing CO, CO2, and H2O. Icarus 87, 188-192.
- Semenov et al. (2003) Semenov, D., Henning, Th., Helling, Ch., Ilgner, M., Sedlmayr, E. 2003. Rosseland and Planck mean opacities for protoplanetary discs. Astronomy and Astrophysics 410, 611-621.
- Shakura and Syunyaev (1973) Shakura, N. I., Syunyaev, R. A. 1973. Black holes in binary systems. Observational appearance. Astronomy and Astrophysics 24, 337-355
- Spohn and Schubert (2003) Spohn, T., Schubert, G. 2003. Oceans in the icy Galilean satellites of Jupiter? Icarus 161, 456-467.
- Stamatellos and Whitworth (2008) Stamatellos, D., Whitworth, A. P. 2008. Can giant planets form by gravitational fragmentation of discs? Astronomy and Astrophysics 480, 879-887.
- Stepinski and Valageas (1997) Stepinski, T. F., Valageas, P. 1997. Global evolution of solid matter in turbulent protoplanetary disks. II. Development of icy planetesimals. Astronomy and Astrophysics 319, 1007-1019.
- Tielens and Allamandola (1987) Tielens, A. G. G. M., Allamandola, L. J. 1987. Composition, structure, and chemistry of interstellar dust. Interstellar Processes 134, 397-469.
- Tielens and Hagen (1982) Tielens, A. G. G. M., Hagen, W. 1982. Model calculations of the molecular composition of interstellar grain mantles. Astronomy and Astrophysics 114, 245-260.
- Tsiganis et al. (2005) Tsiganis, K., Gomes, R., Morbidelli, A., Levison, H. F. 2005. Origin of the orbital architecture of the giant planets of the Solar System. Nature 435, 459-461.
- Turner and Sano (2008) Turner, N. J., Sano, T. 2008. Dead Zone Accretion Flows in Protostellar Disks. Astrophysical Journal 679, L131-L134.
- Umebayashi and Nakano (1980) Umebayashi, T., Nakano, T. 1980. Recombination of Ions and Electrons on Grains and the Ionization Degree in Dense Interstellar Clouds. Publications of the Astronomical Society of Japan 32, 405.
- Umebayashi and Nakano (1981) Umebayashi, T., Nakano, T. 1981. Fluxes of Energetic Particles and the Ionization Rate in Very Dense Interstellar Clouds. Publications of the Astronomical Society of Japan 33, 617.
- van Boekel et al. (2004) van Boekel, R., and 22 colleagues. 2004. The building blocks of planets within the ‘terrestrial’ region of protoplanetary disks. Nature 432, 479-482.
- Weidenschilling (1977) Weidenschilling, S. J. 1977. The distribution of mass in the planetary system and solar nebula. Astrophysics and Space Science 51, 153-158.
- Willacy and Langer (2000) Willacy, K., Langer, W. D. 2000. The Importance of Photoprocessing in Protoplanetary Disks. Astrophysical Journal 544, 903-920.
- Willacy et al. (2006) Willacy, K., Langer, W., Allen, M., Bryden, G. 2006. Turbulence-driven Diffusion in Protoplanetary Disks: Chemical Effects in the Outer Regions. Astrophysical Journal 644, 1202-1213.
- Woods and Willacy (2007) Woods, P. M., Willacy, K. 2007. Benzene Formation in the Inner Regions of Protostellar Disks. Astrophysical Journal 655, L49-L52.
- Womack et al. (1992) Womack, M., Wyckoff, S., Ziurys, L. M. 1992. Estimates of N2 abundances in dense molecular clouds. Astrophysical Journal 401, 728-735.
| Parameter | Description | Value | Units |
|---|---|---|---|
| star mass | 0.95 | ||
| disk mass | 0.12 | ||
| inner radius | 0.3 | AU | |
| outer radius | 30 | AU | |
| mass distribution | g cm-2 | ||
| viscosity parameter | 0.002 | dimensionless | |
| ambient temperature | 20 | K |
| Element | AbundanceaaAbundances are logarithmic, with | Solids Formed |
|---|---|---|
| H | 12.00 | ice, refractory CHON |
| He | 10.99 | none |
| C | 8.60 | ice, refractory CHON |
| N | 7.97 | ice, refractory CHON |
| O | 8.87 | rock, ice, refractory CHON |
| Ne | 8.07 | none |
| Mg | 7.58 | rock |
| Si | 7.55 | rock |
| S | 7.21 | rock, ice |
| Fe | 7.51 | metal |
| Parameter | Description | value | units |
|---|---|---|---|
| cosmic ray penetration depth | 150 | g cm-2 | |
| surface density of reaction sites on grains | cm-2 | ||
| mean grain radius | 0.258 | ||
| grain number density | cm-3 | ||
| sticking coefficient of species x | dimensionless | ||
| atomic hydrogen fraction | 0.01 | dimensionless | |
| fraction of carbon in grains | 0.4 | dimensionless | |
| fraction of nitrogen in grains | 0.1 | dimensionless | |
| fraction of oxygen in grains | 0.2 | dimensionless | |
| fraction of sulfur in grains | 0.85 | dimensionless |
| Species | Binding Energy (K) | Referenceaa References: CT = Cazaux & Tielens (2002); TA = Tielens & Allamandola (1987); O = Öberg et al. (2005); HH = Hasegawa & Herbst (1993); SA = Sandford & Allamandola (1990); C = Collings et al. (2004). |
|---|---|---|
| H | 600bbSurface binding energy on an amorphous H2O ice substrate. | CT |
| C | 800 | TA |
| N | 800 | TA |
| O | 800 | TA |
| S | 1100 | TA |
| N2 | 790 | O |
| NO | 1210 | HH |
| CO | 1720bbSurface binding energy on an amorphous H2O ice substrate. | SA |
| H2O | 5700 | C |
| HCN | 1760 | HH |
| H2S | 1800 | HH |
| CO2 | 2860 | SA |
| OCS | 3000 | HH |
| NH3 | 5700 | C |
| CH4 | 1360 | HH |
| H2CS | 2250 | HH |
| C2H2 | 1610 | HH |
| Species | Abundance |
|---|---|
| H | 4.08 (-05)aaAll abundances are fractional with respect to the total number of hydrogen nuclei, . 1.00 (-10) should be read as . |
| He | 9.77 (-02) |
| C | 2.61 (-11) |
| N | 2.65 (-11) |
| O | 3.76 (-11) |
| H+ | 4.48 (-07) |
| He+ | 7.01 (-09) |
| H | 2.57 (-10) |
| H2 | 4.99 (-01) |
| CS | 8.07 (-15) |
| GCObbG denotes solid-phase grain mantle species. | 2.82 (-05) |
| GSi | 2.00 (-08) |
| GNO | 7.43 (-07) |
| GH2O | 5.27 (-04) |
| GHCN | 7.20 (-06) |
| GHNC | 8.74 (-08) |
| GCO2 | 3.80 (-09) |
| GNH3 | 7.56 (-05) |
| GC2H2 | 1.48 (-07) |
| GH2CO | 9.80 (-08) |
| GCH4 | 2.02 (-04) |
| GC3H2 | 2.94 (-07) |
| GHC3N | 1.31 (-08) |
| GCH3OH | 1.96 (-09) |
| GCH3CN | 4.53 (-09) |
| GN2 | 1.85 (-07) |
| GCH2CO | 9.80 (-10) |
| GC2O | 1.12 (-10) |
| GCH3CHO | 1.61 (-11) |
| GC2H4 | 2.38 (-08) |
| GH2S | 2.42 (-06) |
| GH2CS | 2.54 (-09) |
| GC2S | 6.60 (-09) |
| GSO2 | 5.06 (-10) |
| GC3S | 5.19 (-10) |
| GC2H6 | 3.77 (-12) |
| GC3H4 | 7.14 (-14) |
| Ice Species | |
|---|---|
| H2O | |
| CH4 | 0.38 |
| NH3 | 0.14 |
| CO | 0.054 |
| HCN | 0.014 |
| NO | 0.0014 |
| N2 | 0.00035 |
| Radius (AU) | |||||||||||||||
|---|---|---|---|---|---|---|---|---|---|---|---|---|---|---|---|
| Time (Myr) | 1 | 2 | 3 | 4 | 5 | 6 | 7 | 8 | 9 | 10 | 12 | 14 | 16 | 18 | 20 |
| 0 | 110.63aaSurface density units are g cm-2. | 39.11 | 21.29 | 13.83 | 9.90 | 16.28 | 13.04 | 10.68 | 9.15 | 8.23 | 7.07 | 5.61 | 4.59 | 3.85 | 3.28 |
| 0.01 | 38.48 | 24.14 | 17.25 | 12.73 | 9.94 | 12.62 | 15.11 | 12.58 | 10.28 | 8.85 | 7.31 | 5.72 | 4.64 | 3.87 | 3.29 |
| 0.02 | 25.95 | 18.06 | 13.51 | 10.70 | 8.94 | 16.08 | 15.02 | 13.07 | 11.11 | 9.61 | 7.81 | 5.88 | 4.70 | 3.89 | 3.30 |
| 0.03 | 20.70 | 14.88 | 11.39 | 9.37 | 8.22 | 15.94 | 14.41 | 12.85 | 11.24 | 9.85 | 8.34 | 6.13 | 4.79 | 3.93 | 3.31 |
| 0.04 | 17.57 | 12.83 | 10.02 | 8.46 | 8.68 | 15.07 | 13.78 | 12.48 | 11.11 | 9.90 | 8.67 | 6.41 | 4.92 | 3.97 | 3.32 |
| 0.05 | 15.42 | 11.37 | 9.06 | 7.81 | 12.77 | 14.33 | 13.22 | 12.08 | 10.88 | 9.86 | 8.84 | 6.66 | 5.08 | 4.03 | 3.33 |
| 0.06 | 13.90 | 10.29 | 8.34 | 7.33 | 14.28 | 13.70 | 12.73 | 11.70 | 10.63 | 9.78 | 8.90 | 6.85 | 5.23 | 4.10 | 3.35 |
| 0.07 | 12.75 | 9.47 | 7.79 | 7.04 | 14.04 | 13.17 | 12.33 | 11.36 | 10.38 | 9.68 | 8.91 | 6.98 | 5.37 | 4.18 | 3.36 |
| 0.08 | 11.84 | 8.84 | 7.36 | 7.15 | 13.54 | 12.73 | 11.97 | 11.05 | 10.15 | 9.58 | 8.89 | 7.07 | 5.49 | 4.26 | 3.39 |
| 0.09 | 11.10 | 8.33 | 7.01 | 8.27 | 13.09 | 12.34 | 11.65 | 10.77 | 9.94 | 9.46 | 8.86 | 7.12 | 5.57 | 4.32 | 3.41 |
| 0.1 | 10.49 | 7.91 | 6.72 | 10.40 | 12.70 | 12.00 | 11.35 | 10.52 | 9.75 | 9.34 | 8.81 | 7.14 | 5.64 | 4.38 | 3.44 |
| 0.15 | 8.53 | 6.59 | 5.85 | 11.83 | 11.35 | 10.83 | 10.24 | 9.56 | 9.10 | 8.72 | 8.46 | 7.05 | 5.74 | 4.55 | 3.54 |
| 0.2 | 7.46 | 5.89 | 6.19 | 10.91 | 10.50 | 10.05 | 9.51 | 8.93 | 8.70 | 8.28 | 8.07 | 6.82 | 5.66 | 4.55 | 3.57 |
| 0.3 | 6.28 | 5.12 | 10.03 | 9.80 | 9.48 | 9.04 | 8.56 | 8.28 | 7.95 | 8.04 | 7.41 | 6.35 | 5.35 | 4.37 | 3.49 |
| 0.4 | 5.62 | 4.69 | 9.51 | 9.11 | 8.80 | 8.37 | 7.96 | 7.78 | 7.54 | 7.80 | 6.88 | 5.94 | 5.03 | 4.14 | 3.35 |
| 0.5 | 5.17 | 4.43 | 8.99 | 8.59 | 8.29 | 7.87 | 7.60 | 7.34 | 7.46 | 7.39 | 6.46 | 5.59 | 4.74 | 3.92 | 3.20 |
| 0.6 | 4.84 | 4.33 | 8.57 | 8.19 | 7.88 | 7.48 | 7.31 | 7.06 | 7.33 | 7.00 | 6.11 | 5.29 | 4.48 | 3.72 | 3.05 |
| 0.7 | 4.58 | 4.65 | 8.23 | 7.86 | 7.55 | 7.18 | 7.02 | 6.94 | 7.08 | 6.67 | 5.82 | 5.03 | 4.25 | 3.54 | 2.92 |
| 0.8 | 4.37 | 5.71 | 7.94 | 7.57 | 7.27 | 6.95 | 6.75 | 6.91 | 6.80 | 6.38 | 5.56 | 4.80 | 4.05 | 3.38 | 2.79 |
| 0.9 | 4.19 | 7.03 | 7.69 | 7.32 | 7.02 | 6.78 | 6.54 | 6.83 | 6.55 | 6.12 | 5.34 | 4.59 | 3.87 | 3.23 | 2.68 |
| 1 | 4.03 | 7.56 | 7.46 | 7.10 | 6.79 | 6.62 | 6.39 | 6.68 | 6.31 | 5.90 | 5.13 | 4.40 | 3.71 | 3.10 | 2.58 |
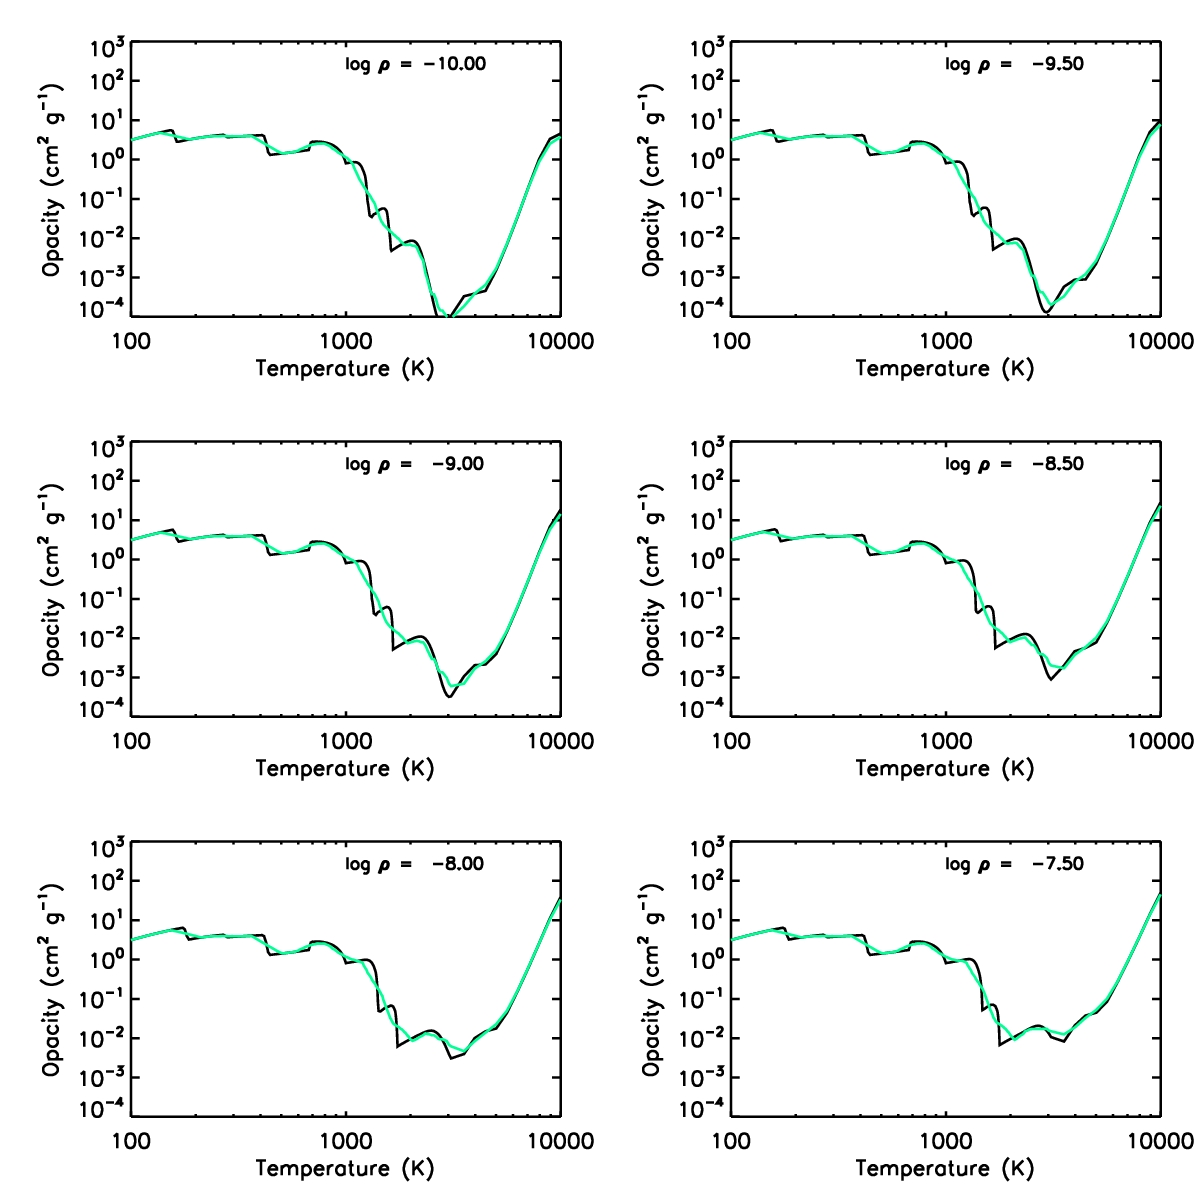
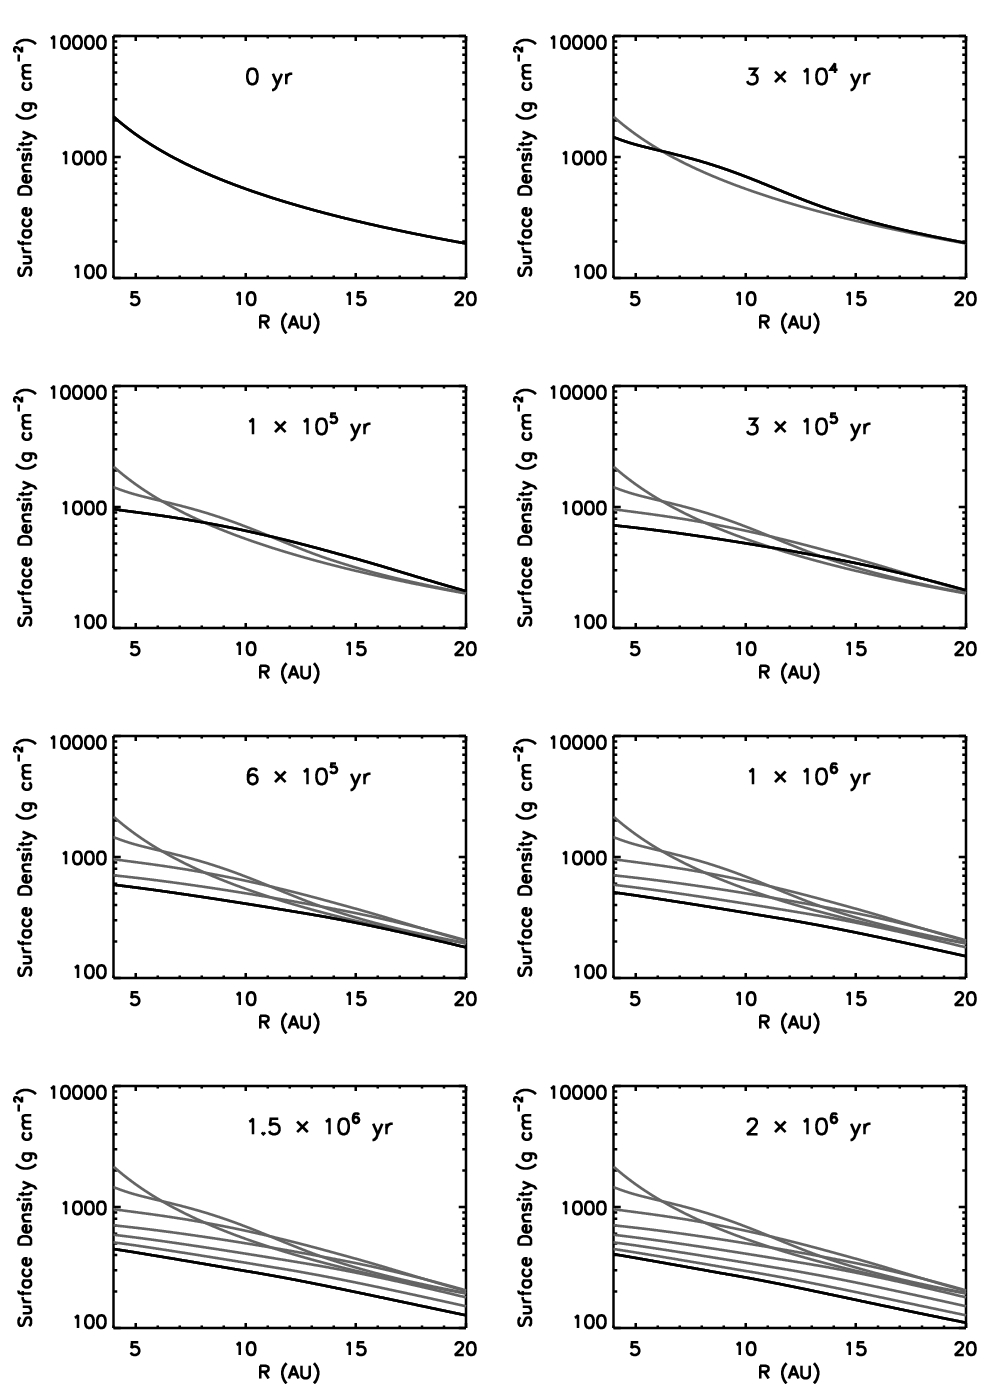
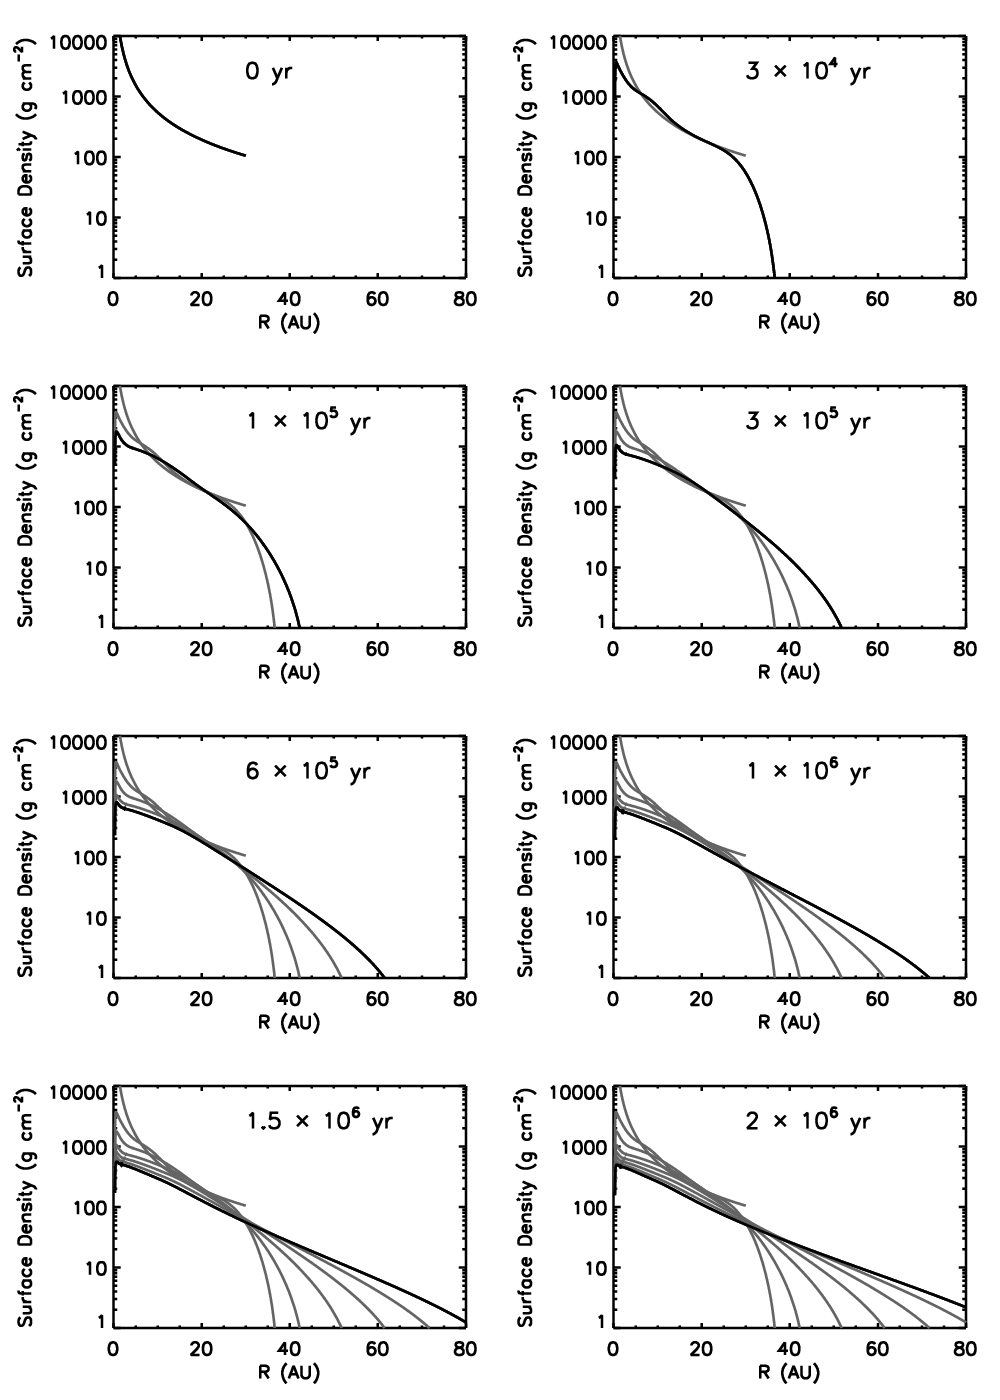
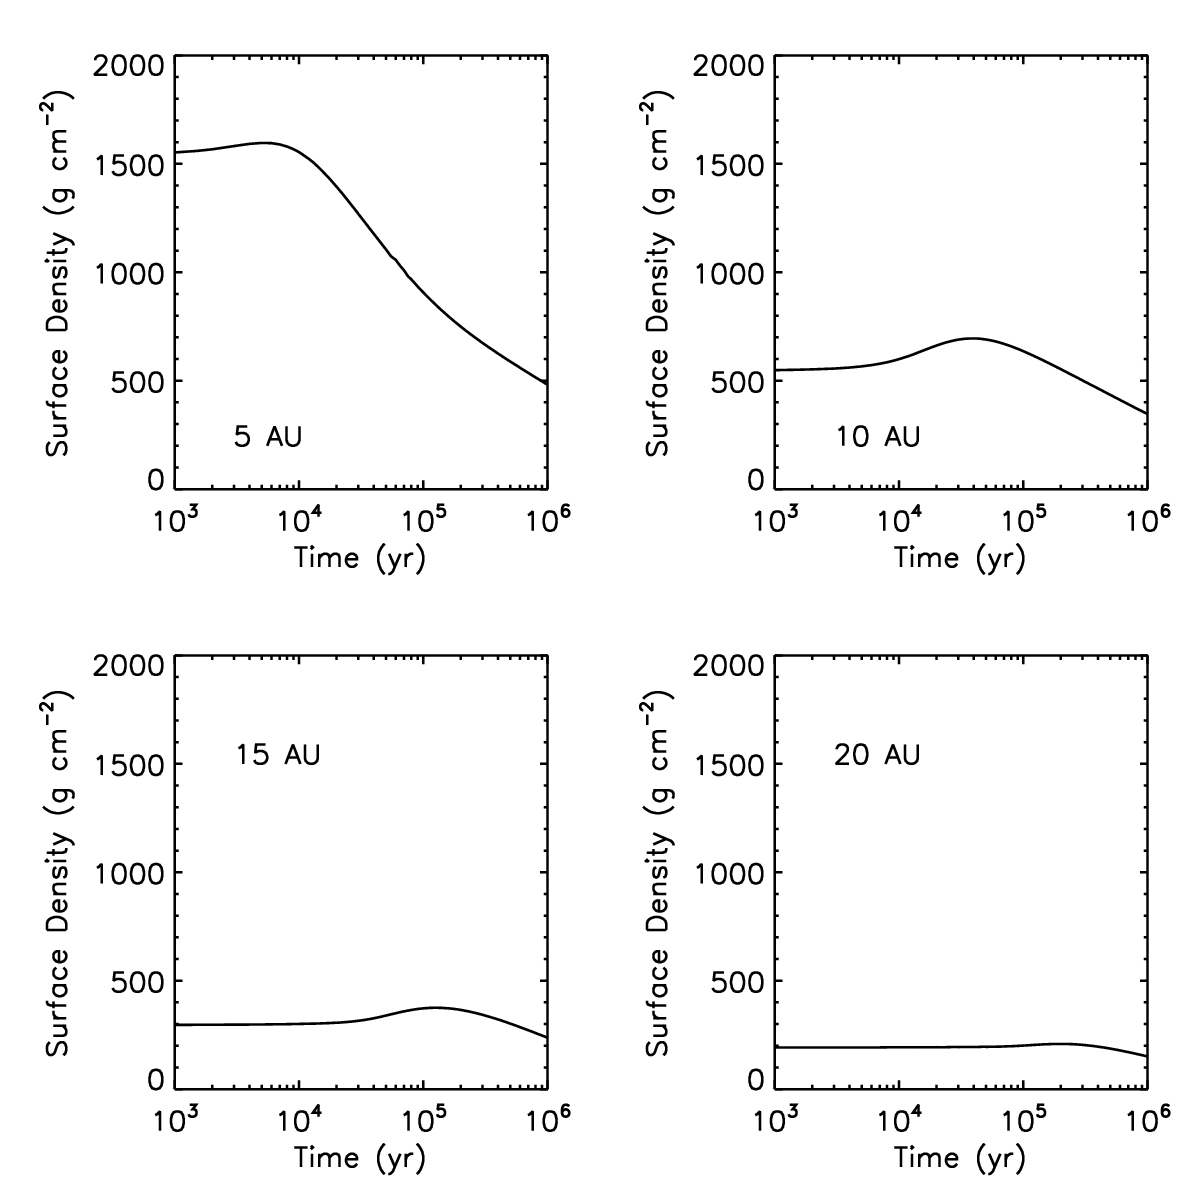
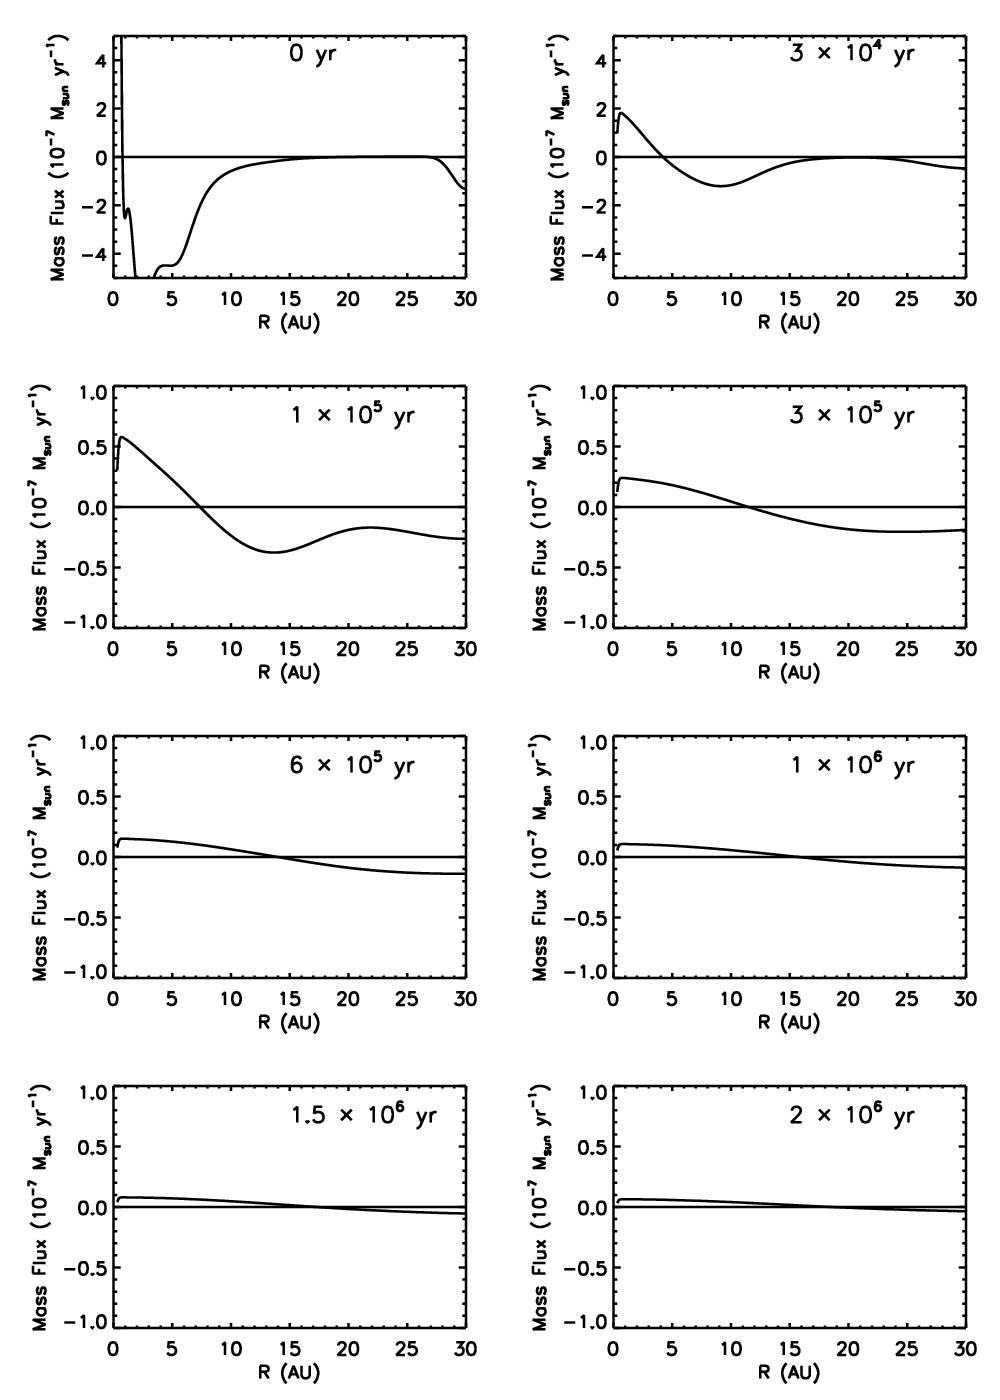
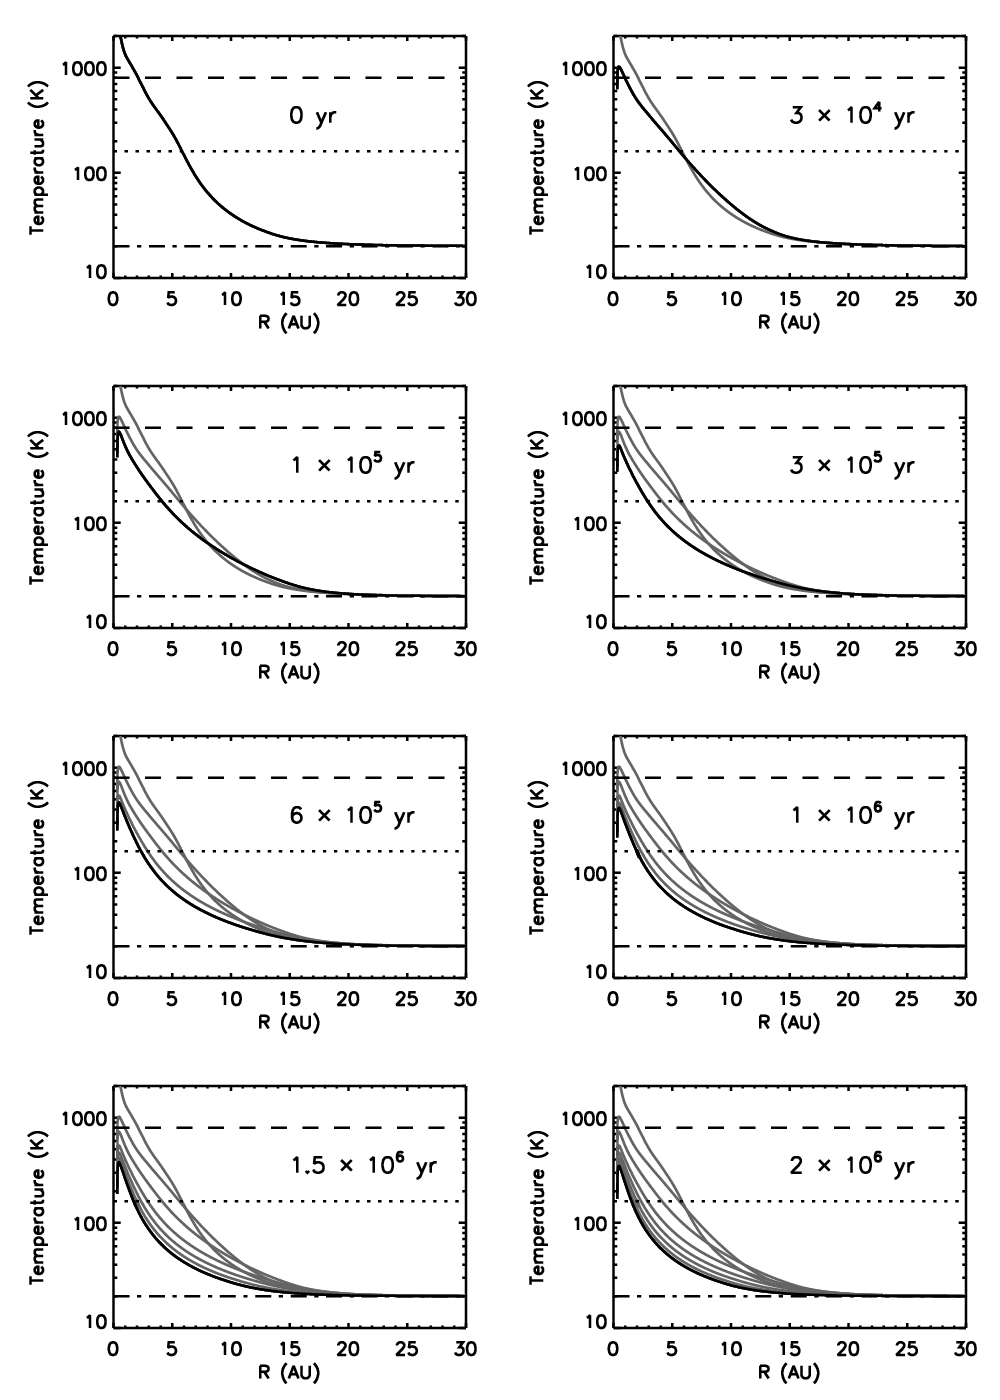
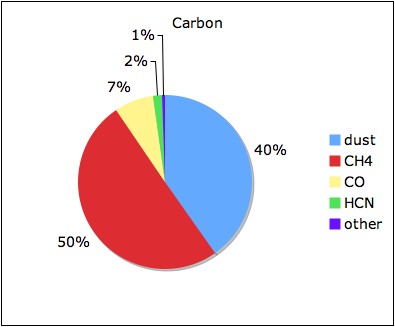 |
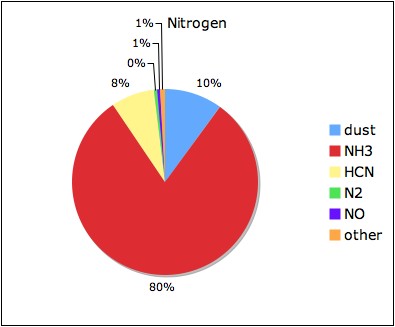 |
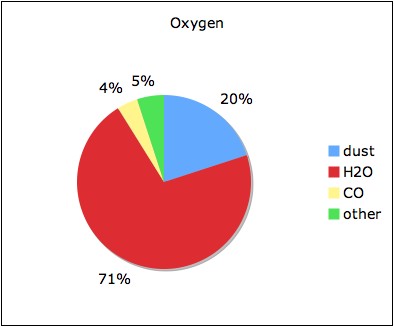 |