Long-wavelength excesses of FU Orionis objects: flared outer disks or infalling envelopes?
Abstract
The mid- to far-infrared emission of the outbursting FU Orionis objects has been attributed either to a flared outer disk or to an infalling envelope. We revisit this issue using detailed radiative transfer calculations to model the recent, high signal-to-noise data from the IRS instrument on the Spitzer Space Telescope. In the case of FU Ori, we find that a physically-plausible flared disk irradiated by the central accretion disk matches the observations. Building on our previous work, our accretion disk model with outer disk irradiation by the inner disk reproduces the spectral energy distribution between 4000 Å to m. Our model is consistent with near-infrared interferometry but there are some inconsistencies with mid-infared interferometric results. Including the outer disk allows us to refine our estimate of the outer radius of the outbursting, high mass accretion rate disk in FU Ori as 0.5 AU, which is a crucial parameter in assessing theories of the FU Orionis phenomenon. We are able to place an upper limit on the mass infall rate of any remnant envelope infall rate to 10-7 M⊙yr-1 assuming a centrifugal radius of 200 AU. The FUor BBW 76 is also well modelled by a 0.6 AU inner disk and a flared outer disk. However, V1515 Cyg requires an envelope with an outflow cavity to adequately reproduce the IRS spectrum. In contrast with the suggestion by Green et al., we do not require a flattened envelope to match the observations; the inferred cavity shape is qualitatively consistent with typical protostellar envelopes. This variety of dusty structures suggests that the FU Orionis phase can be present at either early or late stages of protostellar evolution.
1 Introduction
The FU Orionis systems are a small but remarkable class of variable young stellar objects (YSOs) which undergo outbursts in optical light of 5 magnitudes or more (Herbig, 1977), with a F-G supergiant optical spectra and K-M supergiant near-infrared (near-IR) spectra dominated by deep CO overtone absorption. FU Orionis objects (FUors) have been modelled as a high mass accretion disk around pre-main-sequence stars (Hartmann Kenyon 1985, 1987a, 1987b) to explain the infrared color excesses and the variations of both the spectral type and rotational line width with wavelength (Hartmann Kenyon 1996; Paper I).
Herbig (1977) argued that at least some FU Orionis outbursts must be repetitive, and Hartmann & Kenyon (1996) suggested that this could be explained by infall from an envelope to the disk, replenishing the disk mass for further outbursts. The infall picture is also suggested by the presence of scattered light envelopes around FUors, suggesting that they are objects in early stages of star formation (Herbig, 1977; Goodrich, 1987). In the evolution sequence, FUors may play significant role in transfering a large amount of mass (10) to the central star, which is even higher than the mass accumulated in the T Tauri phase (Hartmann, 1998).
However, not all FUors show the large mid-infrared (mid-IR) excesses that clearly demand dense infalling envelopes. In particular, Adams et al. (1987) suggested that FU Ori itself had only a depleted or low-density envelope. Kenyon & Hartmann (1991) suggested that a pure flared disk model could explain FU Ori while an infalling envelope was needed for V1057 Cyg, but Turner et al. (1997) proposed that both FU Ori and V1057 Cyg required flattened envelopes. Finally, taking advantage of IRS spectra obtained with the Spitzer Space Telescope, Green et al. (2006) concluded that the SEDs of V1057 and V1515 Cyg required envelopes and derived crude models for these objects, while FU Ori and BBW 76 might be explained with flared disks only. Some recent studies about the silicate features also show FUors can be classified as two categories and some objects are evolved (FU Ori and BBW 76) with only disks left (Quanz et al., 2007).
The IRS spectra provide us with the opportunity to perform a much more detailed SED analysis for FUors. In Paper I, we developed detailed accretion disk models to study the inner disk of FU Ori and we derived an inner disk size 1 AU. In this paper, we re-examine the interpretation of mid-IR excesses, taking advantage of the IRS spectra, with more detailed radiative transfer models, to resolve the disk/envelope problem. We will describe the observational data in §2. In §3, the method to calculate the temperature structure of the irradiated surface and the resulting spectrum is described. Model results for three FU Orionis objects (FU Ori, BBW 76, and V1515 Cyg) are presented in §5. Finally, in §6 we discuss some implications of our results.
2 Optical and infrared data
2.1 Photometry and Spectra
Because FU Orionis objects are significantly variable, it is crucial to minimize differences in the times of observations at differing wavelengths. We build on the database assembled in Paper I for FU Ori. For other FU Orionis objects, we also collected optical photometry from Green et al. (2006). These data were obtained in 2004 at the Maidanak Observatory and all the data collected in this year for the same band were averaged considering FUors are variable objects. Near-IR fluxes are from 2MASS point-source catalog (PSC). V1057 Cyg was observed in June, 2000; V1515 Cyg was observed in November, 1998; BBW 76 was observed in February 1999. As mentioned in Green et al. (2006), because FU Orionis objects are fading slowly, the extrapolation from the 2MASS epoch (1998) to the IRS epoch (2004) is not important; thus, we adopted the 2MASS JHK photometry without any correction. Mid-infrared fluxes are derived from the Spitzer IRS spectra observed in 2004 (Green et al., 2006).
The spectral energy distributions (SEDs) need to be corrected for extinction to assess the brightness of the mid-IR excess relative to the central hot disk, which will determine whether or not a flared disk can explain the observations. To get the right extinction correction, we de-reddened the optical and near-IR photometry by a variety of extinction parameters (AV). Then we compared these de-reddened observations with the steady disk spectra calculated with our disk model (Paper I), in which disk temperatures peak around 6000 K. Through this comparison, the extinction parameter which gave the best fit to the model spectrum was chosen for that object. Because the disk radial temperature distribution may deviate from the steady disk and boundary layer emission may be present, we estimate the uncertainty of our extinction values as 0.5.
2.2 Interferometry
We use both the near-IR and mid-IR interferometry to test our modelling of FU Ori. The near-IR interferometric data are from Malbet et al. (2005), who obtained 287 long-baseline interferometric observations in the H and K bands from 1998 to 2003, with resolution of AU scales at the distance of FU Ori. The -plane coverage is shown in Fig. 1 in their paper and the averaged square visibilities are provided in Table 3 of their paper. The mid-IR interferometric data are from Quanz et al. (2006), who carried measurements from 8 m to 13 m at three baselines (44.56m, 86.25m, and 56.74m) between October 31 and November 4 2004 with the Mid-Infrared Interferometric Instrument (MIDI) at ESO’s Very Large Telescope Interferometer (VLTI) on Paranal, Chile. The visibilities are provided in Table 5 of their paper.
3 Model calculations
3.1 Temperature structure of the irradiated surface
We follow the method of Calvet et al. (1991) to calculate the temperature structure of the outer flaring surface irradiated by the inner hot high disk. In this treatment we have not considered the outer disk self-heating, which is not important for a moderate flaring disk, but has a non-negligible effect on a highly flared envelope, as discussed further in §5.2. We have assumed the flaring surface is very optically thick whether it is the disk surface or the outflow cavity driven into an opaque envelope. Milne’s reflection effect is included and LTE is assumed. Milne’s reflection effect tells us that, without additional heating sources, the incident radiation alters the temperature structure of the low-optical depth layers such that all the energy incident on those layers is radiated back or, in other words, the net fluxes of those layers are zero. In the case of LTE, when the source function is determined by local conditions, the transfer equation is a linear equation and solutions can be superposed.
Specifically, if is the temperature structure of the standard viscous heating disk with zero incident radiation but net viscous flux
| (1) |
and is a temperature structure with a given incident radiation but zero net flux, then the temperature structure of the disk with both of a net flux and a given incident radiation is . We can solve by assuming the incident radiation from the central star/high disk covers a well separated frequency range from the disk emergent radiation; details can be found in Calvet et al. (1991). If the incident radiation consists of a parallel beam carrying energy (ergs cm-2), incident at an angle cos to the normal of the disk surface, a fraction of the energy in the beam will be scattered and a fraction of the incident beam will be truly absorbed and remitted. The temperature structure corresponding to an atmosphere that has net flux and incident radiation of flux is
| (2) |
where
| (3) |
| (4) |
| (5) |
and
| (6) |
| (7) |
where , and . and are the optical depths at the stellar and disk frequency. For a viscous heating disk,
| (8) |
while for an envelope without viscous heating, .
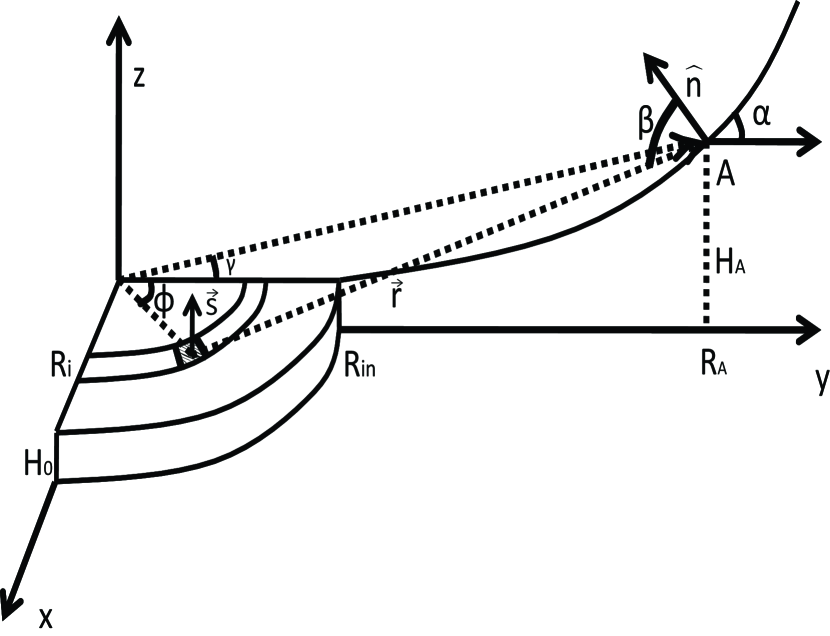
We assume a two part model: an inner steady accretion disk of high mass accretion rate with outer radius , which is optically thick but geometrically thin and flat with height ; and an outer optically thick region, , which is heated by absorption of the light from the inner disk. The geometrical details are described in the Appendix A and Fig. 1. The values of the quantities and characterizing the incoming radiation to every outer annulus are calculated by integrating the mean intensity arriving from every part of the inner disk. These quantities depend on both of the inner disk physical condition (eg. the peak temperature, disk size) and the geometry of the outer disk surface (Appendix A).
We used the same parametrization to describe the flared surface geometry of the disk outside as Calvet et al. (1991). The scale height of a vertically isothermal disk is
| (9) |
where is the sound speed at the disk midplane and is the angular velocity. For typical disk temperature distributions, , where 3/4 n 1/2. Thus, for a Keplerian disk, , where 9/8 5/4.
For a very optically thick disk, the absorption height where most of the inner disk radiation is absorbed is a nearly constant multiple of (D’Alessio et al., 2001); thus we parameterize as
| (10) |
where is the disk height of the inner high disk and is the outer radius of the inner high disk, which is also the inner boundary of the flared outer surface (Fig. 1). Thus, for FU Ori, 0.5-1 AU. We adopt this form to model all objects. When it turns out that , or , we conclude that the absorbing surface we are describing is not that of a flared disk but rather represents the edge of a cavity in a dusty opaque envelope. Our outer disk (or envelope) structure joins abruptly to the inner flat thin disk. In reality we expect a smoother joining between inner and outer regions, but this depends upon the precise geometry of the inner disk (height,flaring) which in turn depends upon the detailed viscosity, etc. Thus, the details of our model near (and the precise values of and ) are uncertain, while the structure at is more robustly modeled.
The gas opacity used in this model is the same as we used in Paper I. We improve our dust opacity by using the prescription in D’Alessio et al. (2001). For each dust component, the grain size distribution is given by a power law of the grain radius, , between a minimum and maximum radius. We choose =0.005 m, =1 m, and =3.5. The detailed ingredients of the dust are shown in Table 1. With this monochromatic dust opacity and gas opacity from Paper I, we calculate the and parameters of Eq. (2). For , we weight the monochromatic by the Planck function at the stellar temperature. For , we calculate the Rosseland mean opacity weighted by the planck function at the stellar temperature and the disk temperature separately, and then divide them. We also use the same opacity to calculate the emergent spectra and disk images. Although the dust ingredients may vary for different objects, we use the ingredients in Table 1 for all, considering that larger uncertainties caused by the invalidity of the plane parallel assumption, as discussed below.
3.2 Emergent spectra and disk images
Given , , and E0, we can calculate the temperature structure of every outer irradiated annulus using Eq. (2). The emergent intensity of any annulus at any outgoing direction then can be derived by solving the radiative transfer equation. Our calculation of the emergent spectrum does not include scattering. Scattering is unlikely to be important in the mid-infrared but may have an effect in the near-infrared; we will consider a detailed scattering treatment in a future paper.
When the intensity of every annulus, every outgoing direction and every wavelength is derived, the total flux and the image of the flared surface for any inclination angle can be derived, for given flared surface geometry. The total flux can be compared with the IRS spectra while the image can be used to do interferometric tests. The details are shown in Appendix B.
4 Results
4.1 FU Ori
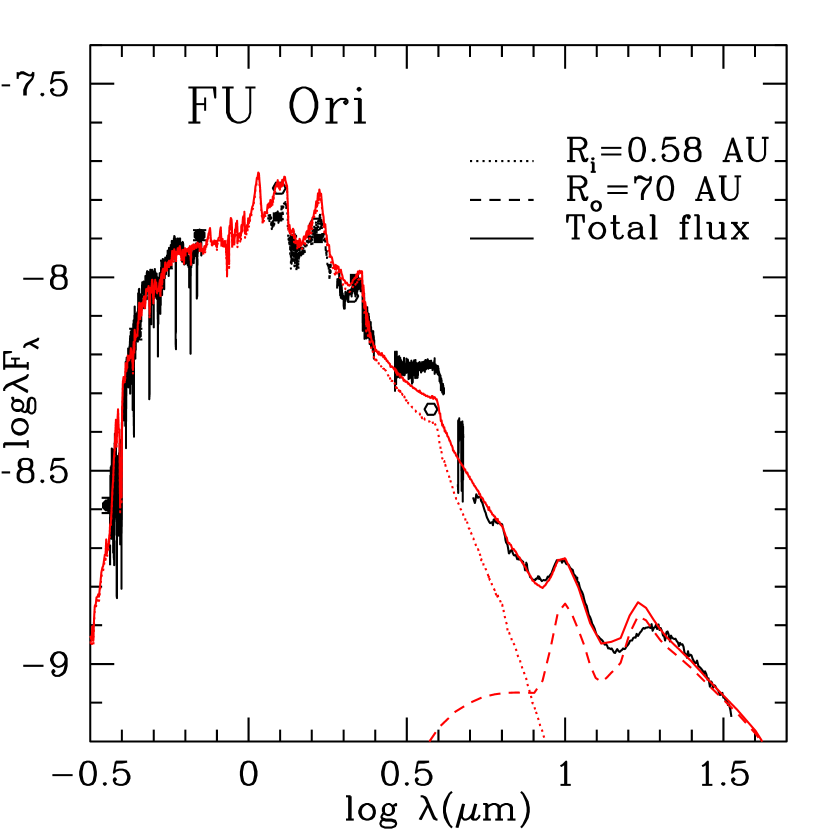
Fig. 2 shows the final model spectra for FU Ori compared with the observed SED. The parameters are in Table 2. The inner disk model is that of Paper I, which shows absorption features because it is internally heated by viscous dissipation. The outer flared disk exhibits 10 and 18 m silicate emission features due to the strong irradiation by the inner high disk, which produces a temperature inversion at its surface. The model does not fit the 18 m feature very well, suggesting that either the size distribution we are using for the dust may vary with radius or the temperature structure of the outer region is not accurate.
The adopted surface has the parameters AU, where =0.58 AU (see Fig. 3). To investigate whether this surface is plausibly that of a flared disk, we computed the approximate local vertical scale height , assuming that the central mass is 0.3 M⊙ (Paper I) and the temperature at the mid-plane is equal to the temperature at =10 (i.e., the disk interior temperature distribution is roughly isothermal.). The results indicate that our adopted surface lies roughly 3 scale heights above the midplane (Fig. 3), comparable to the dusty disk scale heights estimated for typical T Tauri stars (Kenyon & Hartmann, 1987; D’Alessio et al., 1998, 2001). Thus, a physically-plausible flared disk can reproduce the mid-IR flux of FU Ori. The temperature at is shown in Fig. 4. Because the disk is isothermal when , the midplane temperature is almost the same as Fig. 4.
In Paper I, without considering the flux from the flared outer surface, we derived an inner high disk size of 1 AU, constrained by the mid-IR IRS spectrum. The flared outer disk contributes some emission shortward of 10 m, necessitating a reduction of the outer radius of the inner outbursting disk from 1 AU to 0.58 AU. This reduction of the outer radius does not significantly affect the conclusions of Paper I; in particular, the model of Bell & Lin (1994) still cannot reproduce the observations.
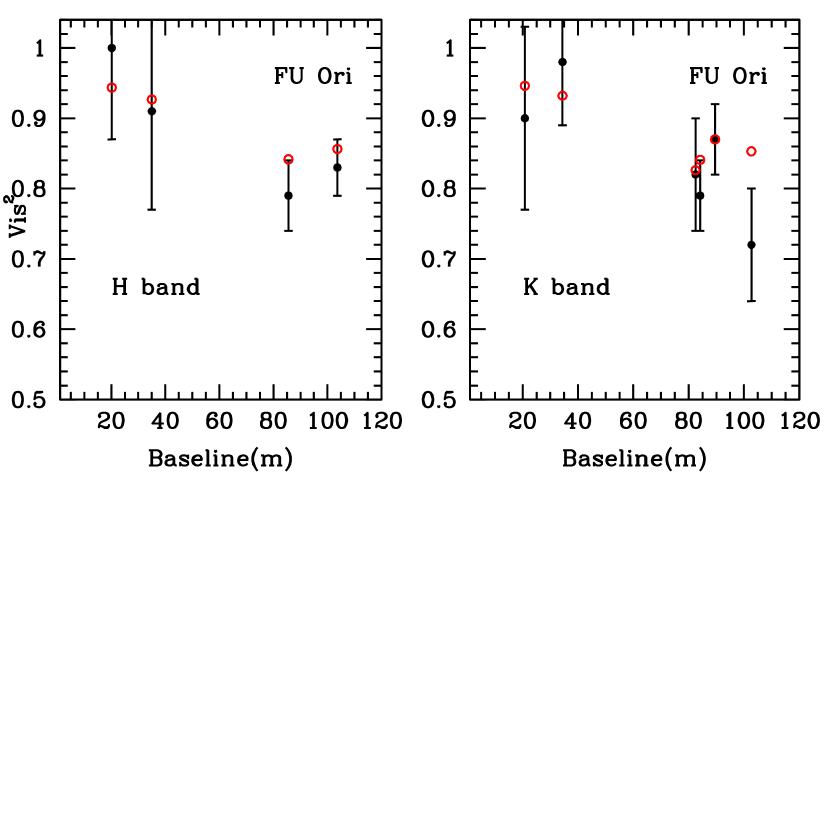
We next compare model results with near-IR and mid-IR interferometry. The images at the H and K bands are calculated by assuming the above flared surface geometry and all the parameters flow strictly from the SED fitting. To compensate for the lack of scattering in our models, we add an extra component of emission corresponding to an “effective albedo” of about 30% in H and K; compared with the case without scattering, the scattering model decreases the square visibilities by only 5%. We adopt the 55 degree inclination angle estimated by Malbet et al. (2005). We further adopt a -30 degree position angle for the disk, which is roughly perpendicular to the axis of large-scale reflection nebulosity seen in optical imaging (Hartmann & Kenyon, 1996), although due to the large error bars in the observed visibilities, the choice of the position angle has little effect.
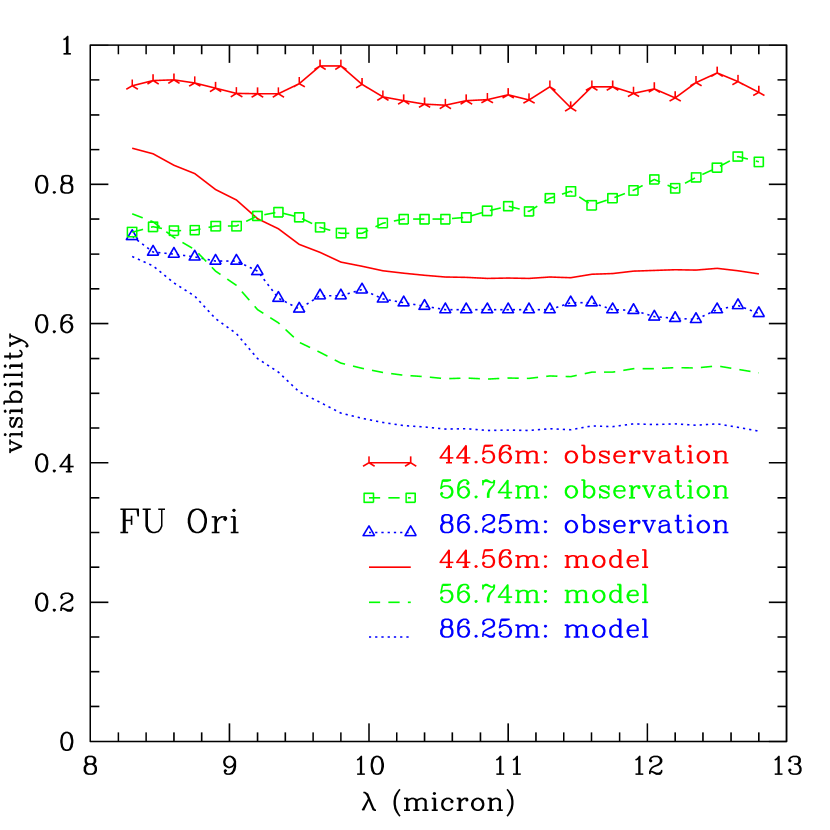
With the image as shown in Fig. 5, the resulting model visibilities are compared with the observations in Fig. 6. Within the relatively large observational errors, our FU Ori model is consistent with the near-IR interferometry. Considering 90% of the flux at H and K bands is from the inner disk, the near-IR interferometry only tests the inner disk modeling and longer wavelength data are needed to test the outer disk modeling. We compute the mid-infrared visibilities, and compare with the VLTI-MIDI data from Quanz et al. (2006); The comparison is shown in Fig. 7. While the model predictions are in reasonable agreement with the observations at the shortest wavelengths, the predicted visibilities are considerably lower than the observations at long wavelengths. Although self-heating is not important in SED fitting because only 17 of the inner disk radiation intercepted by the outer disk within 10 AU by Eq. 7 in Green et al. (2006), self-heating may change the visibility a little bit. However, it is not apparent to tell whether the visibility will increase or decrease, because the inclusion of the self-heating will decrease the flaring slightly, and thus decrease the amount of light intercepted from the inner disk, to keep the same SED.
The comparison with the mid-infrared observation might be improved if the disk has a higher inclination angle than estimated by Malbet et al. With a bigger inclination angle, the disk would be less resolved (higher visibility) for the 44.56 m baseline which lies on the short axes of the disk image. The visibilities for other two baselines would also increase, though not as much as for the 44.56 m baseline. However, a bigger inclination angle may also increase the visibilities at shorter wavelengths which may contradict with the observed visibilities around 8 m. Unfortunately we can not test this by our model because the light from the inner disk has to travel through the outer disk to reach us at higher inclination angle and this needs a more complicated radiative transfer treatment than adopted in this paper.
Another possibility is that there might be an abrupt change in the disk absorption height at the radius around where dust condenses, due to the much larger opacity of dust than gas; this might produce a radially-sharp mid-infrared emission feature in the disk where the dust begins to form at T1500 K, by intercepting more irradiated flux from the inner disk. Finally, there might simply be narrower structures than we can model, such as non-axisymmetric spiral arms due to gravitational instability in the outer disk (Paper I).
Overall, the spectrum fitting and the near-infrared interferometry support our flared disk model. Better uv plane coverage in mid-infrared interferometry would help to improve our understanding of the outer disk structure.
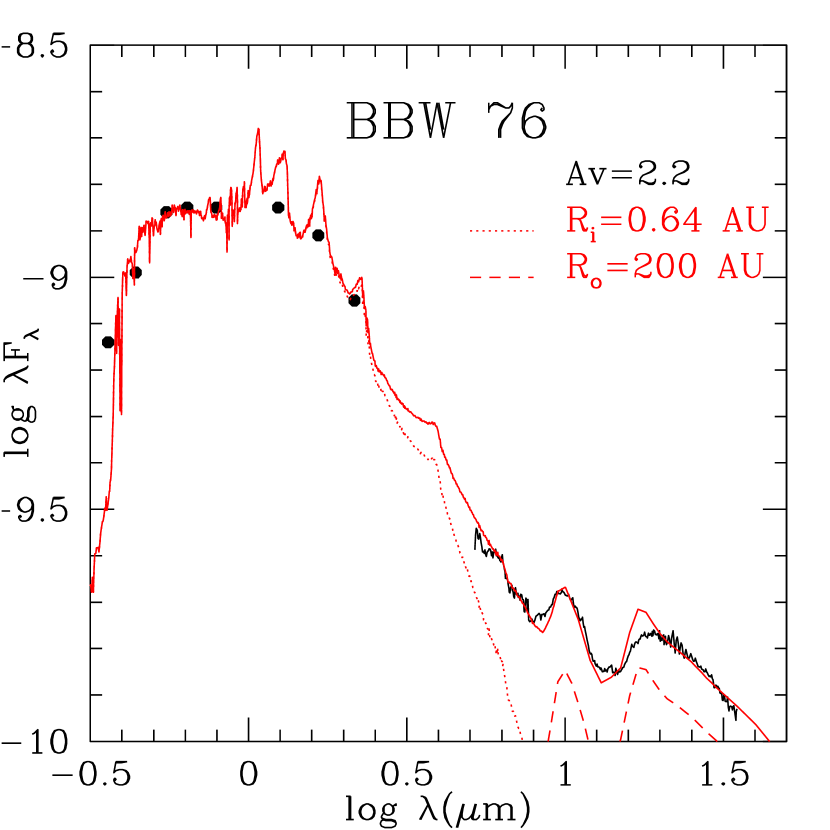
4.2 BBW 76
We fit the SED of BBW 76 following the same procedure as used for FU Ori (Fig. 8). Given the similarity of the large scale nebulosity to that of FU Ori, we adopt a similar inclination angle of 50 degrees. Because BBW 76 has the same rotational velocity broadening as FU Ori (Reipurth et al. 2002), we choose the same central star mass 0.3 M⊙. The parameters of the best fit model are displayed in Table 2. The flared surface (solid curve in Fig. 3) also lies close to 3 scale heights, and is therefore consistent with a flared disk structure. With the same relative strength of the IRS spectrum with respect to the optical flux and the same IRS spectrum shape as FU Ori, we derived a similar outer radius of the inner high disk 0.6 AU. However, the outer disk extends further than in FU Ori, to 200 AU, due to the slightly higher 18 m excess of BBW 76.
4.3 V1515 Cyg
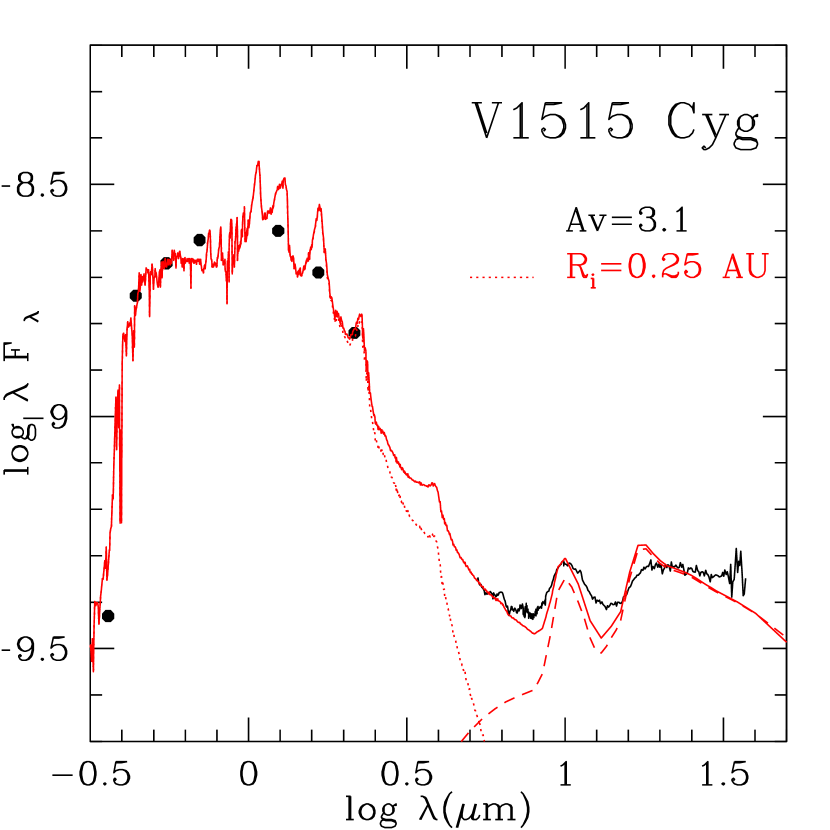
The nebulosity seen on large scales suggests that we view V1515 Cyg nearly pole-on, looking right down an outflow cavity (Goodrich 1987). For simplicity we assume an inclination angle of 0; small departures from this will have little effect on our modelling. Because of the low inclination, it is difficult to constrain the central star mass very well (Kenyon, Hartmann, & Hewett 1988). We therefore assume the central star is like FU Ori with a mass of 0.3 M⊙. In contrast to FU Ori and BBW 76, the absorption height of the surface required to fit the SED of V1515 Cyg is highly flared (Fig. 9). This surface lies at about 6 scale heights (Fig. 3) with the assumption that the central star mass is 0.3 M⊙; this value is higher than a physically plausible height for a disk. Instead, the large dust surface height and relatively small opening angle (H/R 1) strongly suggest that this surface defines an outflow-driven cavity in an infalling envelope, as suggested by Kenyon & Hartmann (1991) and Green et al. (2006).
Though this surface may extend to a very large radius, most of the IRS mid-IR flux comes from small radii, eg. 80 of 10 m flux and 50 of 20 m flux come within 10 AU. This can be roughly estimated from Fig. 4. By wien’s law, 100 K blackbody has its peak flux at 20 m and from Fig. 4 100 K corresponds to 10 AU.
Our assumed dust properties fit the silicate emission features of FU Ori very well, but in V1515 Cyg the model continuum is a bit too steeply declining longward of 30 m; in addition, the model predicts slightly stronger silicate features than observed (Fig. 9). These discrepancies might be reduced if we had adopted larger dust grain sizes which can make the silicate features wider and shallower. However, it could also be that our assumption of plane-parallel geometry is not correct for the outer envelope. As Fig. 4 shows, although the fluxes at (characteristic of a black body temperature 300 K) are mainly from the surface within 10 AU, the long wavelength fluxes may come from a much larger radius from 10 AU to 100 AU. Because infalling envelopes are much less optically thick than disks at these radii, long wavelength photons may travel further into the envelope, invalidating the plane-parallel assumption.
5 Discussion
5.1 Flared Disks
The inner disks of the FUors are internally-heated accretion disks, which produce absorption features. However, the silicate emission features must arise in a dusty region that is externally heated to produce a temperature inversion in the surface of optically-thick dusty disks and envelopes. In the cases of FU Ori and BBW 76, we find that the IRS SED can be explained with physically plausible flared disks.
For the flared disks of FU Ori and BBW 76 we derived which is larger than the value of 0.2 crudely estimated by Green et al. (2006) for FU Ori. The main reason for the discrepancy is that we adopt a smaller than Green et al. (2006), which makes the inner disk fainter and thus requires a more flared outer disk to absorb and reemit the same luminosity (the long-wavelength spectrum is relatively unaffected at these low values of extinctions). If anything our extinction estimate is likely to be low, which means that we may have overestimated the required flaring, and thus makes it even more plausible that the long-wavelength emission comes from the outer disks.
We note that, in estimating the number of scale heights for the disk, we have assumed that the disk has been able to relax to vertical hydrostatic equilibrium after the outburst. Before the outburst, we expect the outer disk to be cooler and thus thinner. After the outburst, the outer disk is heated by the inner hot disk and gets puffed up. The time scale for the disk to adjust its vertical hydrostatic equilibrium to the extra irradiation is , where is the disk scale height and is the sound speed. Since , or , where is the orbital period. Thus,
| (11) |
As the outburst of FU Ori has been proceeding for over 70 years now, our assumption of hydrostatic equilibrium is good for the inner parts of the flared disk, but may be less appropriate for the outer disk; beyond 50 AU for an assumed 0.3 M⊙ central star (Paper I), the hydrostatic equilibrium time starts to become longer (100 yrs) than the length of the current outburst.
While it is not necessary to include disk accretion energy in the outer disk to fit the spectrum reasonably well, this does not mean that the disk is not accreting; the local viscous energy release is simply much less than the irradiation heating. We find that outer disk accretion rates greater than of the inner disk accretion rate yield silicate features shallower than observed in the IRS spectra. Thus, the data suggest that the outer disk accretion rates in BBW 76 and FU Ori are significantly smaller than the inner disk accretion rates. This is consistent with models in which material piles up and then accretes in bursts (e.g., Kenyon Hartmann 1991; Armitage et al. 2001).
5.2 Envelopes
The IRS SED of V1515 Cyg cannot be explained with a reasonably flared disk. A much more plausible explanation is that we are observing emission from the surface of a cavity in a dusty, infalling envelope. Green et al. (2006) also inferred an envelope around V1515 Cyg, and estimated a maximum solid angle of the outer envelope of based on 14% of the inner disk radiation being intercepted and reradiated by the envelope. However, their estimate was a lower limit because they did not include emission at longer wavelengths than observed by the IRS.
In our radiative transfer model, 80 of the 10 m flux and 50% of the 20 m flux arises from within 10 AU. At this radius the height of the envelope surface is about 10 AU (Fig. 3), so that the fraction of solid angle covered at this point is about 70%. This is roughly twice the solid angle estimated by from Green et al. , but the assumed geometries are different. Our cavity structure (Fig. 2) is much more consistent with typical outflow cavity structures (Dougados et al., 2000) and our radiative transfer methods are more robust. We estimate that self-heating of the outer flared disks, which we ignore, is a relatively small effect because the outer disk only intercepts a small fraction of the inner disk flux. This is not true of the envelope for V1515 Cyg, and so our results for this object can only be suggestive rather than conclusive. Our main point is that a flared disk model cannot reproduce the observations of V1515 Cyg and V1057 Cyg. We are currently exploring models o these two objects with two-dimensional radiative transfer and will report results in a future paper.
We have also begun to investigate V1057 Cyg. Our preliminary model is very similar to that of V1515 Cyg, with a highly flared envelope. However, when the object is not pole-on or a flat disk our method is questionable (i.e., maybe we are looking along the edge of the envelope, or even through some of the envelope), thus we will revisit V1057 Cyg using a more detailed radiative transfer method in a subsequent paper.
The near-IR Keck interferometer (Millan-Gabet et al., 2006) also found a difference between the near-IR sizes for V1515 Cyg and V1057 Cyg compared with FU Ori. The low near-IR visibilities suggest V1515 Cyg and V1057 Cyg are more resolved than FU Ori, which suggests dense envelops may be present for these objects. This is an additional support for the envelope model, but in future the detailed modeling is needed to fit these interferometry data.
5.3 Do FU Ori and BBW 76 have envelopes?
As both FU Ori and BBW 76 have large-scale reflection nebulosities, it suggests that they have remnant infalling envelopes, if sufficiently optically thin. We can estimate an upper limit to the amount of possible envelope material in FU Ori and BBW 76 from a limit on the visual extinction. We use the rotating collapse model of Terebey, Shu, & Cassen (1984). When ,where is the centrifugal radius,
| (12) |
when ,
| (13) |
Integrating the above equations from 0 to and then multiplying by the visual dust opacity at the V band,
| (14) |
With , , =100 cm2/gr, and 2 constrained by AV2, we find
| (15) |
If =200 AU, we thus estimate an upper limit of yr-1, which is considerably smaller than typical Class I infall rates of yr-1.
Adams et al. (1987) also suggested that FU Ori has a highly depleted dusty envelope, with a density depletion factor 0.01 with respect to the density derived by their standard infall envelope model. Though they didn’t give the mass infall rate for the depleted envelope models, we can estimate their mass infall rate is 10-7M⊙/yr by multiplying the depletion factor 0.01 by their standard mass infall rate 10-5M⊙/yr. Because they didn’t consider the flared outer disk which is the main contributor at IRS range, this infall rate is an upper limit. Submillimeter observations barely resolve FU Ori and BBW 76 (Sandell & Weintraub, 2001), which also implies highly evolved or absent envelopes.
5.4 Dust properties
The 18 m features in the SEDs are not well fit, indicating that we may need to use a different grain opacity or a more detailed radiative transfer method. However, we can still study the dust properties from the 10 m silicate emission features. The dust, with a power-law distribution of the grain radius and a maximum radius 1 m, is larger than the typical interstellar medium dust with a maximum grain radius 0.25 m (D’Alessio et al., 2001). Although this dust composition differs from the one used by Quanz et al. (2007), where they use a mixture of grains with three different sizes (0.1,1.5 and 6 m), it also suggests that grain growth has taken place in the disk. Our results confirm Quanz et al. (2007) that a significantly higher fraction of 1m grains is required. BBW 76 is similar to FU Ori while V1515 Cyg seems to require grains growing to even larger sizes.
In Paper I, we suggested that dust might be depleted in the inner disk, based on the observed water vapor absorption features at m. However, if we deplete the dust in the outer disk of FU Ori and BBW 76, we predict a strong water vapor emission at 8 m, which is not observed. Thus, there may not be significant depletion in the outer disk, which may be reasonable given the youth of the system and the likelihood that grain growth/settling timescales are longer at larger radii (Weidenschilling et al., 1997). However, this is not a firm conclusion, as the abundance of water vapor is poorly understood and the region of the disk where most of the 8 flux comes from is at the region where we join the inner and outer disk solutions, and thus is uncertain.
5.5 Evolutionary states and FU Ori classification
The (meager) event statistics suggest that there must be repeated FU Orionis outbursts in at least some young stars (Herbig 1977; Hartmann & Kenyon 1996). Kenyon & Hartmann (1991) proposed that continued infall was needed to replenish the material accreted onto the central star during an outburst. While we are unable to determine the infall rate for V1515 Cyg from our particular modelling, previous estimates suggest that sufficient matter may be falling in to make repeat outbursts possible in V1515 Cyg and in V1057 Cyg (Kenyon & Hartmann 1991; Green et al. 2006).
In contrast, we have shown that FU Ori and BBW 76 have little or no infall from remnant envelopes. The low upper limits of infall in these objects suggest that continuing infall may not be important in continuing outbursts; any subsequent outbursts may have to rely on material already present in these disks. Thus, we suggest that FU Ori and BBW 76 are nearing the end of their outburst lives, while V1515 Cyg and V1057 Cyg have a much higher probability of continuing their activity.
The significant difference between FU Ori and BBW 76 on the one hand, and V1515 Cyg and V1057 Cyg on the other, is also supported by submillimeter observations. FU Ori and BBW 76 are very faint and hardly resolved at submilimeter wavelengths (Sandell & Weintraub, 2001), suggesting that they have more depleted envelopes than other FU Orionis objects.
Overall, the variety of the FU Orionis envelopes suggests that FU Orionis phenomenon is observed at different stages of the protostars and every YSO may experience several FU Orionis outbursts from the early to the late stages of protostellar infall.
In this regard, young stellar objects (YSO) have been classified as two categories based on their spectral index log( log in the near-infrared and mid-infrared (Adams et al., 1987). represents the protostars embedded in infalling envelopes (Class I) and represents the T Tauri stars without envelopes (Class II). This classification helps us to understand the evolutionary sequence of YSO, from protostars to pre-main-sequence stars. As we discussed above, FU Orions objects are in a stage between Class I and Class II. Thus, it is also helpful to classify FU Orions objects in two categories (Quanz et al., 2007). However because of the strong near-IR flux produced by the high disk, is always positive in the near-IR and mid-IR (1-10 m) range. Thus, based on the spectra and envelope structures of FU Ori, BBW 76 and V1057 Cyg, we suggest a criterion to classify FU Orionis objects by using mid-IR spectral index log( log from 14 to 40 m, where most of the flux is contributed by the outer region beyond the inner disk. If is negative or close to zero, this FU Orionis object has a circumstellar envelope which produces a flat mid-IR spectrum (eg: V1057 Cyg and V1515 Cyg). If is positive it may have a remnant envelope far away and the mid-IR flux is contributed by a flared outer disk (eg: FU Ori and BBW 76).
This classification method is different from the method used by Quanz et al. (2007) where they used the 10 m silicate feature to classify FU Orionis objects. They suggest that the objects with absorption features are in Category I, embedded in circumstellar envelopes, while the objects with emission features are in Category II, which are more evolved and show properties of Class II sources. However, as discussed above, some FU Orionis objects embedded in envelopes have cavities (eg. V1057 Cyg and V1515 Cyg) with moderate opening angles. Thus, if we view these objects pole on, we will still detect the emission features and would classify them as Category I by the emission silicate feature method.
Another benefit of using a mid-IR index is that the strength of 10 m silicate features are dependent on the inclination angle. In contrast, for continuum emission at 14-40 m is not affected significantly by the inclination and envelope extinction, since the opacity at 14 m is close to the opacity at 30 m, and 5 times smaller than the opacity at 9 m for amax=1 m olivine grains. Even for a highly embedded FU Orionis objects, AV=10 (Asilicate=0.7), A14μm is only 0.15, in which case an extinction correction is not necessary. With the mid-IR index method, we get the same classification for the objects listed in Quanz et al. (2007) except that V1057 Cyg, V1515 Cyg, and V 1647 Ori are identified in Category I. In this paper, we suggest that V1057 Cyg, V1515 Cyg have normal envelopes, thus they are indeed in Category I. V1647 Ori object is a special FUor with both large extinctions, A11 and silicate emission features. Quanz et al. (2007) suggests there maybe a foreground cloud between this object and us, which makes it hard to classify and it needs detailed modelling.
6 Conclusions
With the latest IRS spectra and a detailed radiative transfer model including irradiation, we revisited the envelope/flared disk problem of FUors. We confirmed the results of Green et al. (2006) that FU Ori and BBW 76 have flared outer disks while V1515 Cyg has a circumstellar envelope. However, instead of a flattened envelope and a large opening angle (Green et al., 2006), we derived a more reasonable cavity structure.
For FU Ori, near-infrared interferometry also supports our model, while mid-infrared interferometry does not fit perfectly and needs further modelling. Including the contribution from the outer flared disk, we gave a tighter constraint on the outer radius of the inner disk 0.5 AU, which is essential to test outburst theories (Paper I).
We also suggest using a spectral index from 14 m to 40 m to classify FUors into early (Category I) and late (Category II), which is less sensitive to the viewing angle. The variety of FU Orionis envelopes suggests that FU Orionis phenomenon is observed at different stages of the protostars, and every YSO may experience several FU Orionis outbursts from very early to late stages of the infalling envelope.
This research was supported in part by the University of Michigan. In addition, this work was based in part on observations made with the Spitzer Space Telescope, which is operated by the Jet Propulsion Laboratory, California Institute of Technology under a contract with NASA. We gratefully acknowledges John D. Monnier who drew our attention to the interferometry and gave us many helpful advices.
Appendix A Flared surface geometry
The inner disk and outer flared surface are shown in Figure 1. For point A, located at distance from the center, the quantities and are derived as follows. We define several vectors as shown in the Figure 1; the normal vector to the flaring surface at A is:
| (A1) |
The vector from the shaded area at Ri in the inner disk to point A at the flaring outer disk is:
| (A2) |
where
| (A3) |
The solid angle extended by S with respect to point A is ( S is the area of the tiny shaded region at Ri in figure 1.)
| (A4) |
where
| (A5) |
Thus , the amount of energy irradiated from the inner disk annulus Ri to unit area normal to at point A , is integrated over all the area of annulus i. Thus,
| (A6) |
Because of limb darkening, from the inner disk annulus i equals to , where is the intensity at radius Ri towards z direction (direction perpendicular to the inner disk surface) and is the cosine of the angle between and z direction; thus we use to approximate .
Then, , the amount of energy irradiated from the inner disk annulus Ri to unit area at the flaring surface point A (notice it is different from the above unit area normal to at point A), is
| (A7) |
Finally, we add the contributions of all the inner annuli together to get the flux ,
| (A8) |
and the equivalent ( cosine of the equivalent incident angle ) :
| (A9) |
Appendix B Emergent flux and image
To derive the total flux and the image detected by the observer on earth, the flared surface needs to be projected onto the plane of sky . For a tiny patch of the flared surface , with area vector normal to the surface, the projection area to the plane which is normal to our line of sight is , where is the unit vector pointing to the observer along our line of sight. The angle between and is =cos-1(/). The flux we observed from can be derived by multiplying the intensity at direction , , and the solid angle extended by towards us, , is the distance between the object and the observer. The addition over all the surface, , is the total flux. The image of the flared surface could also be derived in this way.
References
- Adams et al. (1987) Adams, F. C., Lada, C. J., & Shu, F. H. 1987, ApJ, 312, 788
- Armitage et al. (2001) Armitage, P. J., Livio, M., & Pringle, J. E. 2001, MNRAS, 324, 705
- Bell & Lin (1994) Bell, K. R., & Lin, D. N. C. 1994, ApJ, 427, 987
- Calvet et al. (1991) Calvet, N., Patino, A., Magris, G. C., & D’Alessio, P. 1991, ApJ, 380, 617
- D’Alessio et al. (2001) D’Alessio, P., Calvet, N., & Hartmann, L. 2001, ApJ, 553, 321
- D’Alessio et al. (1998) D’Alessio, P., Canto, J., Calvet, N., & Lizano, S. 1998, ApJ, 500, 411
- Dougados et al. (2000) Dougados, C., Cabrit, S., Lavalley, C., & Ménard, F. 2000, A&A, 357, L61
- Green et al. (2006) Green, J. D., Hartmann, L., Calvet, N., Watson, D. M., Ibrahimov, M., Furlan, E., Sargent, B., & Forrest, W. J. 2006, ApJ, 648, 1099
- Goodrich (1987) Goodrich, R. W. 1987, PASP, 99, 116
- Hartmann (1998) Hartmann, L. 1998, Accretion processes in star formation / Lee Hartmann. Cambridge, UK ; New York : Cambridge University Press, 1998. (Cambridge astrophysics series ; 32) ISBN 0521435072.,
- h (1985) Hartmann, L., & Kenyon, S. J. 1985, ApJ, 299, 462
- h (1987) Hartmann, L., & Kenyon, S. J. 1987a, ApJ, 312, 243
- h (1987) Hartmann, L., & Kenyon, S. J. 1987b, ApJ, 312, 243
- Hartmann & Kenyon (1996) Hartmann, L., & Kenyon, S. J. 1996, ARA&A, 34, 207
- Herbig (1977) Herbig, G. H. 1977, ApJ, 217, 693
- Kenyon & Hartmann (1987) Kenyon, S. J., & Hartmann, L. 1987, ApJ, 323, 714
- Kenyon & Hartmann (1991) Kenyon, S. J., & Hartmann, L. W. 1991, ApJ, 383, 664
- Kenyon et al. (1988) Kenyon, S. J., Hartmann, L., & Hewett, R. 1988, ApJ, 325, 231
- Malbet et al. (2005) Malbet, F., et al. 2005, A&A, 437, 627
- Millan-Gabet et al. (2006) Millan-Gabet, R., et al. 2006, ApJ, 641, 547
- Quanz et al. (2006) Quanz, S. P., Henning, T., Bouwman, J., Ratzka, T., & Leinert, C. 2006, ApJ, 648, 472L127
- Quanz et al. (2007) Quanz, S. P., Henning, T., Bouwman, J., van Boekel, R., Juhász, A., Linz, H., Pontoppidan, K. M., & Lahuis, F. 2007, ApJ, 668, 359
- Sandell & Weintraub (2001) Sandell, G., & Weintraub, D. A. 2001, ApJS, 134, 115
- Terebey et al. (1984) Terebey, S., Shu, F. H., & Cassen, P. 1984, ApJ, 286, 529
- Turner et al. (1997) Turner, N. J. J., Bodenheimer, P., & Bell, K. R. 1997, ApJ, 480, 754
- Weidenschilling et al. (1997) Weidenschilling, S. J., Spaute, D., Davis, D. R., Marzari, F., & Ohtsuki, K. 1997, Icarus, 128, 429
- Zhu et al. (2007) Zhu, Z., Hartmann, L., Calvet, N., Hernandez, J., Muzerolle, J., & Tannirkulam, A.-K. 2007, ApJ, 669, 483 (Paper I)


| Ingredient | aaDust-to-gas mass ratio of the particular ingredient | Tsub (K)bbSublimation temperature at the gas density =10-10g/cm3 |
|---|---|---|
| Mg0.8Fe1.2SiO4 (Olivine) | 0.0017 | 1460 |
| Mg0.8Fe0.2SiO3 (Pyroxene) | 0.0017 | 1460 |
| Graphite | 0.0041 | 734 |
| Water ice | 0.0056 | 146 |
| Object | AV | Inclination | aaRin and H0 are described in Eq. 10 | bbThe outer radii are poorly constrained by the data. | |||||
|---|---|---|---|---|---|---|---|---|---|
| angle | 10-5Myr-1 | R⊙ | L⊙ | AU | R⊙ | AU | |||
| FU Ori | 1.5 | 55 | 7.4 | 5 | 232 | 0.58 | 41.5 | 1.125 | 70 : |
| BBW 76 | 2.2 | 50 | 8.1 | 4.6 | 277 | 0.64 | 49.22 | 1.125 | 200 : |
| V1515 Cyg | 3.2 | 0 | 1.3 | 2.8 | 73 | 0.25 | 16.8 | 1.3 | 104 : |