SHELL REVEALED IN SN 1979C
Abstract
VLBI observations at 5 GHz have revealed that supernova 1979C, in the galaxy M100 in the Virgo cluster, has shell structure. The shell is approximately circular with the 50% contour deviating from a circle by an rms of no more than 8% of the radius. The brightness distribution along the ridge may vary. The position of the center of the shell is at R.A.= and decl.= (J2000), with a standard error of 0.8 mas in each of the coordinates. No isolated central component is visible above a flux density limit of 150 Jy which corresponds to an upper limit of 15 times the corresponding spectral luminosity of the Crab Nebula. The radio lightcurve is clearly falling again and the radio spectrum is now flatter than at earlier times. SN 1979C is only the fourth, and oldest (optically identified) supernova of which a detailed image could be obtained.
Subject headings:
supernovae: individual (SN 1979C) — galaxies: individual (M100) — radio continuum: supernovae1. INTRODUCTION
SN 1979C (catalog ) (type II-L) was discovered in the galaxy M100 (catalog ) (NGC 4321 (catalog ), distance: 15.2 Mpc as estimated by Freedman et al., 2001) in the Virgo cluster on 1979 April 19 by G. E. Johnson (Mattei et al., 1979) and subsequently became one of the most optically and radio luminous Type II supernovae ever found. On the basis of its radio lightcurve, its explosion date is estimated to be 1979 April 4 (see Weiler et al., 1986), hereafter yr. VLBI observations started as early as 1982. They resulted in a determination of the angular expansion rate (Bartel, 1985; Bartel et al., 1985) and deceleration. This determination allowed an estimate of the mass-loss to wind-velocity ratio of the progenitor, which was found to be an order of magnitude lower (Bartel & Bietenholz, 2003) than that reported from radio lightcurve fitting.
However, despite a quarter century of VLBI observations, the relatively far distance to Virgo has prevented determining the detailed structure of SN 1979C (catalog ) with VLBI. The determination of the expansion rate and the deceleration had to be based on size estimates made by using a model fit of the supernova brightness distribution. Clearly, a determination of the supernova’s morphology is important for a more accurate determination of the expansion velocity and deceleration. Such more accurate determination would also allow for a direct, geometric, estimate of the distance to SN 1979C (catalog ) and Virgo using the expanding shock front method (ESM; see, e.g., Bartel et al., 2007) and resolve the ambiguity in an earlier estimate (Bartel & Bietenholz, 2003). It is also important for revealing the morphological type of the supernova: purely shell-like or center filled, perhaps with a bright compact component. Previously, only three other optically-identified supernovae could be imaged with an angular resolution high enough to unambiguously determine the morphological type. All three, SN 1986J (catalog ) (Bartel et al., 1991; Bietenholz et al., 2004), SN 1987A (catalog ) (Gaensler et al., 1997, 2007), and SN 1993J (catalog ) (Marcaide et al., 1995; Bartel et al., 1995, 2000; Bietenholz et al., 2003) have shell structure, with SN 1986J having a central component in addition to the shell. SN 1979C is the oldest optically-identified supernova that can still be monitored with VLBI. As such, it provides a bridge between our understanding of supernovae (interacting with the circumstellar medium left over from the progenitor) and supernova remnants (interacting with the interstellar medium).
Only a few supernova remnants which are less than a century old are known, all extragalactic, e.g., in M82 (McDonald et al., 2001) and in Arp220 (Parra et al., 2007). The youngest Galactic remnants are several centuries old, e.g., the Crab Nebula, which shows a pulsar wind nebula, Cas A, which shows a shell, and G21.50.9, which shows both a pulsar wind nebula (e.g., Bietenholz & Bartel, 2008b) and likely also a shell (Matheson & Safi-Harb, 2005; Bocchino et al., 2005). Since all radio supernovae originate from the explosions of massive stars, they are expected to leave a neutron star or a black hole. Either a young neutron star or a black hole may be accompanied by a bright, compact radio source near the center of the expanding shell. Young neutron stars are likely to be associated with radio-bright pulsar wind nebulae, and black holes may have radio bright jets due to an accretion-disk system.
Indeed, pulsar wind nebulae are found around a number of young pulsars, although the youngest known pulsars have ages near 1000 yr. A central radio source possibly associated with a neutron star or black hole was recently found in SN 1986J (Bietenholz et al., 2004). Such a central radio source might also be seen near the centers of other older supernovae when clearly resolved images are obtained. Here we report on such an image of SN 1979C, discuss its morphology, radio lightcurve, and spectral evolution, and search for signs of a central compact remnant of the explosion. The expansion rate, deceleration, and distance determination will be reported elsewhere.
2. OBSERVATIONS AND DATA ANALYSIS
The VLBI observations were carried out on 2005 February 25 with a global array of 21 antennas. The array consisted of the Very Long Baseline Array (VLBA; each of 25 m diameter), phased Very Large Array (VLA; 130 m equivalent diameter), and the Robert C. Byrd telescope (GBT; 105 m diameter), all of the National Radio Astronomy Observatory, NRAO, in addition to the Arecibo Radio Telescope (305 m diameter) and eight telescopes of the European VLBI Network, namely the Effelsberg Radio Telescope, Germany (100 m diameter), the Westerbork Array, The Netherlands (92 m equivalent diameter), and the telescopes at Medicina and Noto, Italy (32 m diameter), at Torun, Poland (32 m diameter), Jodrell Bank, Great Britain (26 m diameter), and Hartebeesthoek, South Africa (26 m diameter). We observed for a total of 15 h at a frequency of 5 GHz with a bandwidth of 32 MHz and recorded both senses of circular polarization with a total recording bit rate of 256 Mbits s-1. The data were correlated with the NRAO VLBA processor in Socorro and further analyzed with NRAO’s Astronomical Image Processing System (AIPS). The initial flux density calibration was done through measurements of the system temperature at each telescope, and then improved through self-calibration of the reference sources.
We phase-referenced our VLBI observations to J1215+1654 (catalog ), which is 2.2° away on the sky, and used, through most of the run, a repeating cycle of 250 s, pointing for 170 s to SN 1979C and for 80 s to the reference source. Finally, we also used the VLA, which was in the B configuration, to determine the total flux density of SN 1979C at 1.43, 4.99, and 8.43 GHz. In order to obtain the best possible image, we phase self-calibrated the data after phase-referencing.
3. RESULTS
3.1. The Brightness Distribution
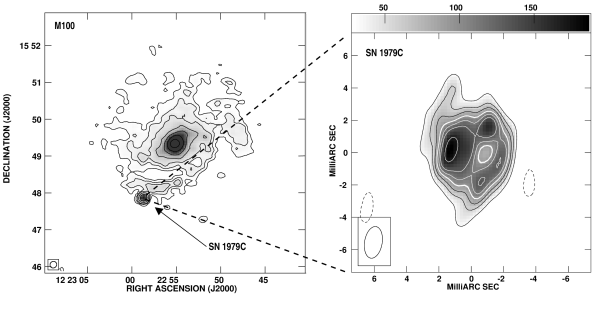
In Figure 1 we show the VLBI image of SN 1979C juxtaposed with an earlier VLA image of the host galaxy M100. The supernova is located in a southern spiral arm of the galaxy. The VLBI image shows that the supernova has shell structure with a brightness minimum located only slightly to the west of the center. The outer contour at half of the maximum brightness is approximately circular with rms deviations from circularity of 8% of the radius. We think that this estimate is somewhat conservative since it is based on an image convolved with an elliptical beam, which tends to elongate the structure along the long axis of the beam, which is oriented north-south. The 50% contour is indeed slightly elongated in the north-south direction. An ellipse fit to the 50% contour has a ratio between the major and minor axes of 1.10 and a p.a. of 173°.
The maximum brightness is only 187 Jy beam-1 and the rms noise brightness in the background is 11 Jy beam-1. How much could possible deconvolution errors contribute to the uncertainty in the brightness distribution of the supernova? We investigated the significance of the appearance of the shell structure and of features in the brightness distribution by using simulations. We used a disk model as a test source, converted it to visibility data for our - coverage, added noise, and then imaged and deconvolved the simulated data in the same way as the observed data. In this way we produced 36 images of our model source with different noise realizations but with the rms background noise brightness being always close to our observed background rms of 11 Jy beam-1. The average of the 36 images resembled the original disk model, indicating that there are no systematic distortions or biases. The individual images, however, varied in their appearance with the rms of the brightness variations on the image being twice as large as the rms of the background noise brightness. None of these images had a closed ridge with a clear minimum in or near the center. We therefore exclude the possibility that the true brightness distribution is uniform across the source or has a filled center. Instead, with high probability, it is indeed a shell.
Our simulations also showed that the northern and southern low-brightness extensions are likely due to corrugations in the image plane caused by our incomplete - coverage, and are therefore probably not significant. The brightness varies along the ridge between 187 Jy beam-1 and 112 Jy beam-1, representing a range of only the estimated on-source brightness uncertainty of Jy beam-1. It is not clear whether the variation is significant.
The brightness at the local minimum slightly to the west of the center of the shell is 80 Jy beam-1. The brightness increases toward the east and is Jy beam-1at the center, although no isolated central component is visible. We determine an upper limit of the flux density of any compact component in the central area of the shell of Jy beam-1.
3.2. The Position
Phase-referencing allowed us to determine the position of SN 1979C relative to that of our calibrator, J1215+1654. The calibrator’s position was taken from the VLBA Calibrator Survey (VCS1, Beasley et al., 2002) as R.A.= and decl.= (J2000). The standard error111Beasley et al. (2002) call this error “inflated formal error.” is 0.5 and 0.6 mas in RA and decl., respectively. In our VLBI image of SN 1979C in Figure 1, we place the origin of the coordinate system at the estimated center of the outer 50% contour. This coordinate origin is at the position of R.A.= and decl.= (J2000). We estimate that our standard error of the position of SN 1979C relative to J1215+1654 is 0.5 mas in each coordinate (compare with Pradel et al., 2006). Adding in quadrature the standard position error of J1215+1654’s to that of SN 1979C, we estimate a standard error of the position of the center of the image in Figure 1 to be 0.8 mas in each coordinate.
As a check, we also determined the position of SN 1979C relative to J1215+1654 by using our earlier 1.7 GHz data from 2001. At this frequency, SN 1979C was barely resolved, and contributions to the position error due to unmodeled effects of the ionosphere expected to be much larger. We estimate a standard error of 2 mas in each coordinate. Our estimated relative position of SN 1979C at 1.7 GHz in 2001 was within 1 mas of the more accurate position given above, well within the uncertainties.
3.3. VLA Total Flux Densities
We determined the total flux density, , of SN 1979C from the interferometric observations with the VLA made during the time of our VLBI observations. We list these flux densities for frequencies, , of 8.43, 4.99, and 1.43 GHz in Table 1. In addition, we give the flux densities for and 1.67 GHz measured in 2001, for comparison. Then we convert the flux densities to and 1.47 GHz and plot them in Figure 2, together with the much larger set of flux density determinations at these frequencies of Weiler et al. (1986, 1991), Montes et al. (2000), and Bartel & Bietenholz (2003).
| Date | Age (yr)aaTime since assumed explosion date of 1979 April 4 (1979.26). | Flux densities (mJy)bbTotal flux density, , measured with the VLA. The uncertainties are approximate standard errors and were computed by adding in quadrature the statistical standard error and a systematic calibration error of %. | ccThe spectral index, , determined from the flux density measurements, , at frequency, : . For our last epoch a weighted fit was used. The errors are one standard deviation, determined by varying the flux density values by their standard errors. | |||
|---|---|---|---|---|---|---|
| 1.43 GHz | 1.67 GHz | 4.99 GHz | 8.43 GHz | |||
| 2001 Feb 23 | 21.89 | 4.280.23 | 2.30.4ddData are from Bartel & Bietenholz (2003).eeThe observing frequency was 8.46 GHz. | |||
| 2005 Feb 25 | 25.90 | 3.190.22 | 1.680.09 | 1.370.10 | ||
The new measurements of the flux density show that the supernova is again fading, reaching at 1.5 GHz its lowest level ever. The bumpy pattern seen previously is extended downward.
3.4. Radio Spectra
Montes et al. (2000) found that the optically-thin spectrum had a spectral index, , of with a deviation range of to for yr (i.e., before 1991; being obtained from the fit of an empirical model to the multi-frequency radio lightcurves), and for yr. At their latest times, and 18.8 yr, they obtained . Our latest measurements give still flatter spectra (see Table 1). The difference of our spectral indices to that of may be significant. In Figure 3 we plot our flux density measurements and the corresponding spectra for our two latest epochs. For comparison we show the flux density measurements at and 18.8 yr from Montes et al. (2000) and the corresponding average spectrum. Clearly, there is evidence that the spectrum of SN 1979C has flattened further since 17 yr.
4. DISCUSSION
SN 1979C is the fourth (optically identified) extragalactic supernova for which an image with sufficient angular resolution could be made to determine the nature of the brightness distribution. The other three, as mentioned in the introduction, are SN 1986J, SN 1987A, and SN 1993J. Our VLBI image shows that SN 1979C has a morphology similar to the other three, namely a fairly to highly round shell, with the brightness possibly being modulated along the ridge. The possible brightness modulation likely arises from density irregularities either in the circumstellar medium or in the ejecta.
The flux density of SN 1979C is now clearly again on the downward trend. Earlier, it was suggested that the radio lightcurve exhibits a quasi-periodic pattern (Weiler et al., 1992) which was interpreted as possibly being due to the dynamical modulation of the wind from the red supergiant progenitor by a binary companion (Schwarz & Pringle, 1996). With more data up to yr, it was noticed that any periodic variation of the radio lightcurve was not extended beyond yr. Instead, it was suggested that, with the flattening of the radio lightcurve, the supernova had apparently entered a new stage of evolution (Montes et al., 2000).
With our new data up to yr, which show that the lightcurve is again falling after yr, a new look at the characteristics of the radio lightcurve is warranted. In particular, we think that the evidence for a periodicity in the radio lightcurve or a new stage of evolution now seems weaker. If at all, then the radio lightcurve appears to be periodic on a logarithmic time scale. However, a closer inspection leads us to think that, rather than being periodic on a logarithmic time scale, the radio lightcurve is modulated on a whole range of time scales. For instance, there appear to be variations on time scales of less than a year. There are also variations on time scales of several years with e.g., a 5-yr bump in the radio lightcurve at yr and a bump lasting at least 15 yr at the end of the observed radio lightcurve. These variations are likely caused by variations in the density of the ejecta (for discussions in the case of SN 1993J, see Mioduszewski et al., 2001) and/or of the circumstellar medium. In case of the variations in the latter, the radio lightcurve can be thought of as a “time machine” which records in reverse the mass-loss to wind-velocity ratio of the progenitor for thousands of years before the star died.
The spectrum appears to have flattened somewhat with the spectral index being above the deviation range of to given by Montes et al. (2000). A similar behavior is also seen for SN 1993J where the spectrum flattens while the source dimming accelerates222Please note that although Weiler et al. (2007) claim that the spectral index of SN 1993J remains constant over time, an increase of the spectral index consistent with the measurements of Bartel et al. (2002) and Pérez-Torres et al. (2002) can be clearly seen in their data with the smallest errors and/or scatter. (Bartel et al., 2002; Pérez-Torres et al., 2002).
No clearly isolated component was found in the central region of the projected shell of SN 1979C. However, the brightest portion of the shell appears to extend toward the center in projection, and could overlap with any compact component that may be present in the interior. An isolated central component was in fact found for SN 1986J, with a spectrum peaking at 20 GHz while the emission from the remaining parts of the supernova has an optically thin spectrum from at least 1.7 to 22 GHz (Bietenholz & Bartel, 2008a; Bietenholz et al., 2004). This isolated central component may be emission associated with the compact remnant of the explosion.
It is intriguing that the spectrum of SN 1979C shows evidence of flattening with time. Such flattening would be expected for a supernova with emission from a compact remnant that is starting to appear in the center of a shell which is expanding and becoming increasingly transparent at progressively higher frequencies. However, no central component can clearly be seen in SN 1979C, so the observed spectral flattening cannot be ascribed to such a component.
It is probable, therefore, that the spectral flattening is intrinsic to the shell’s synchrotron emission. The flattening must then be due to a change in the population of accelerated particles which produce the synchrotron emission. Calculations have shown that physical conditions in supernova shocks can effect the spectral index of radio emission (e.g., Ellison et al., 2007, 2000).
Our new upper limit on the flux density of any central compact source in SN 1979C of 150 Jy puts strong constraints on the luminosity of such a source. Bandiera et al. (1984) argued that young pulsar wind nebulae would have spectral luminosities of 10 to 1000 times that of the Crab Nebula. The spectral luminosity of the central component of SN 1986J is 200 times that of the Crab Nebula between 14 GHz and 43 GHz (Bietenholz & Bartel, 2008a). In contrast, the upper limit on the 5 GHz spectral luminosity of any central component in SN 1979C is only 15 times the corresponding spectral luminosity of the Crab Nebula, more than an order of magnitude fainter than both that in SN 1986J and our previous limit for SN 1979C (Bartel & Bietenholz, 2005), and at the low end of Bandiera et al. (1984)’s estimate. Any pulsar wind nebula that may exist inside the shell can probably not yet be detected because the shell is likely still opaque at radio frequencies. Since the supernova shell becomes less dense and more transparent as it expands, any central component will become more easily detectable in the future. Searching for emission from the compact central remnant of the explosion therefore remains an intriguing prospect.
References
- Bandiera et al. (1984) Bandiera, R., Pacini, F., & Salvati, M. 1984, ApJ, 285, 134
- Bartel (1985) Bartel, N., ed. 1985, Lecture Notes in Physics, Berlin Springer Verlag, Vol. 224, Supernovae as distance indicators; Proceedings of the Workshop, Cambridge, MA, September 27, 28, 1984
- Bartel & Bietenholz (2003) Bartel, N., & Bietenholz, M. F. 2003, ApJ, 591, 301
- Bartel & Bietenholz (2005) —. 2005, Advances in Space Research, 35, 1057
- Bartel et al. (1995) Bartel, N., Bietenholz, M. F., & Rupen, M. P. 1995, Proceedings of the National Academy of Science, 92, 11374
- Bartel et al. (2000) Bartel, N., Bietenholz, M. F., Rupen, M. P., Beasley, A. J., Graham, D. A., Altunin, V. I., Venturi, T., Umana, G., Cannon, W. H., & Conway, J. E. 2000, Science, 287, 112
- Bartel et al. (2002) —. 2002, ApJ, 581, 404
- Bartel et al. (2007) Bartel, N., Bietenholz, M. F., Rupen, M. P., & Dwarkadas, V. V. 2007, ApJ, 668, 924
- Bartel et al. (1985) Bartel, N., Rogers, A. E. E., Shapiro, I. I., Gorenstein, M. V., Gwinn, C. R., Marcaide, J. M., & Weiler, K. W. 1985, Nature, 318, 25
- Bartel et al. (1991) Bartel, N., Rupen, M. P., Shapiro, I. I., Preston, R. A., & Rius, A. 1991, Nature, 350, 212
- Beasley et al. (2002) Beasley, A. J., Gordon, D., Peck, A. B., Petrov, L., MacMillan, D. S., Fomalont, E. B., & Ma, C. 2002, ApJS, 141, 13
- Bietenholz & Bartel (2008a) Bietenholz, M. F., & Bartel, N. 2008a, Advances in Space Research, 41, 424
- Bietenholz & Bartel (2008b) —. 2008b, ArXiv e-prints, 802
- Bietenholz et al. (2003) Bietenholz, M. F., Bartel, N., & Rupen, M. P. 2003, ApJ, 597, 374
- Bietenholz et al. (2004) —. 2004, Science, 304, 1947
- Bocchino et al. (2005) Bocchino, F., van der Swaluw, E., Chevalier, R., & Bandiera, R. 2005, A&A, 442, 539
- Ellison et al. (2000) Ellison, D. C., Berezhko, E. G., & Baring, M. G. 2000, ApJ, 540, 292
- Ellison et al. (2007) Ellison, D. C., Patnaude, D. J., Slane, P., Blasi, P., & Gabici, S. 2007, ApJ, 661, 879
- Freedman et al. (2001) Freedman, W. L., Madore, B. F., Gibson, B. K., Ferrarese, L., Kelson, D. D., Sakai, S., Mould, J. R., Kennicutt, Jr., R. C., Ford, H. C., Graham, J. A., Huchra, J. P., Hughes, S. M. G., Illingworth, G. D., Macri, L. M., & Stetson, P. B. 2001, ApJ, 553, 47
- Gaensler et al. (1997) Gaensler, B. M., Manchester, R. N., Staveley-Smith, L., Tzioumis, A. K., Reynolds, J. E., & Kesteven, M. J. 1997, ApJ, 479, 845
- Gaensler et al. (2007) Gaensler, B. M., Staveley-Smith, L., Manchester, R. N., Kesteven, M. J., Ball, L., & Tzioumis, A. K. 2007, in American Institute of Physics Conference Series, Vol. 937, American Institute of Physics Conference Series, ed. S. Immler & R. McCray, 86–95
- Marcaide et al. (1995) Marcaide, J. M., Alberdi, A., Ros, E., Diamond, P., Schmidt, B., Shapiro, I. I., Baath, L., Davis, R. J., de Bruyn, A. G., Elosegui, P., Guirado, J. G., Jones, D. L., Krichbaum, T. P., Mantovani, F., Preston, R. A., Ratner, M. I., Ruis, A., Rogers, A. E. E., Schilizzi, R. T., Trigilio, C., Whitney, A. R., Witzel, A., & Zensus, A. 1995, Nature, 373, 44
- Matheson & Safi-Harb (2005) Matheson, H., & Safi-Harb, S. 2005, Advances in Space Research, 35, 1099
- Mattei et al. (1979) Mattei, J., Johnson, G. E., Rosino, L., Rafanelli, P., & Kirshner, R. 1979, IAU Circ., 3348, 1
- McDonald et al. (2001) McDonald, A. R., Muxlow, T. W. B., Pedlar, A., Garrett, M. A., Wills, K. A., Garrington, S. T., Diamond, P. J., & Wilkinson, P. N. 2001, MNRAS, 322, 100
- Mioduszewski et al. (2001) Mioduszewski, A. J., Dwarkadas, V. V., & Ball, L. 2001, ApJ, 562, 869
- Montes et al. (2000) Montes, M. J., Weiler, K. W., Van Dyk, S. D., Panagia, N., Lacey, C. K., Sramek, R. A., & Park, R. 2000, ApJ, 532, 1124
- Parra et al. (2007) Parra, R., Conway, J. E., Diamond, P. J., Thrall, H., Lonsdale, C. J., Lonsdale, C. J., & Smith, H. E. 2007, ApJ, 659, 314
- Pérez-Torres et al. (2002) Pérez-Torres, M. A., Alberdi, A., & Marcaide, J. M. 2002, A&A, 394, 71
- Pradel et al. (2006) Pradel, N., Charlot, P., & Lestrade, J.-F. 2006, A&A, 452, 1099
- Schwarz & Pringle (1996) Schwarz, D. H., & Pringle, J. E. 1996, MNRAS, 282, 1018
- Weiler et al. (1986) Weiler, K. W., Sramek, R. A., Panagia, N., van der Hulst, J. M., & Salvati, M. 1986, ApJ, 301, 790
- Weiler et al. (1991) Weiler, K. W., van Dyk, S. D., Discenna, J. L., Panagia, N., & Sramek, R. A. 1991, ApJ, 380, 161
- Weiler et al. (1992) Weiler, K. W., van Dyk, S. D., Pringle, J. E., & Panagia, N. 1992, ApJ, 399, 672
- Weiler et al. (2007) Weiler, K. W., Williams, C. L., Panagia, N., Stockdale, C. J., Kelley, M. T., Sramek, R. A., Van Dyk, S. D., & Marcaide, J. M. 2007, ApJ, 671, 1959

3 Conversion with a slightly different spectral index of , as used in Bartel & Bietenholz (2003) would result in values virtually indistinguishable from those plotted.
