Impurity bands and the character of the electronic states in ferromagnetic GaMnAs layers
Abstract
The interplay between disorder and spin polarization in a GaMnAs thin layer results into spin-polarized impurity hole bands. A figure of merit is defined to label the nature of the sample as metallic or non-metallic. It is shown that samples with the highest figures of merit have a ratio between the extended hole density and the Mn concentration near 0.2, in agreement with the ratio of 0.1-0.25 known to occur among samples produced with the highest Curie temperatures. Both the non-metal-to-metal and the metal-to-non-metal transitions experimentally observed in the ferromagnetic regime are obtained, as the Mn concentration increases.
pacs:
75.50.Pp,75.75.+a,72.15.Rn,73.61.EyHomogeneous samples of Ga1-xMnxAs were produced more than ten years ago by Matsukura et al matsu1 ; matsu2 . Among these samples ferromagnetism has been observed in the range . The highest Curie temperatures were obtained near , and after annealing they approach 170K. In thin films and trilayer systems Curie temperatures of 160 K were obtained for newohno . Samples with this high Curie temperature have free hole concentrations near cm-3, obtained via Hall measurements. This is a fraction (10-25) of the total concentration of Mn, what is usually explained as being due to the presence of As anti-sites and interstitial Mn. At small Mn concentrations the alloy was observed to be a paramagnetic insulator. As increases the alloy becomes ferromagnetic, going through a non-metal-to-metal transition for concentrations near 3%. The transition occurs, then, at very high impurity concentrations, of the order of 1 cm-3, as compared to transitions associated to shallow donor occurring in Si and GaAs, near 1 cm-3. For above , in GaMnAs, the alloy becomes, again, a non-metallic ferromagnet matsu2 . The highest Curie temperatures were found for the highest hole concentrations matsu1 . Ferromagnetism in quasi-two-dimensional GaMnAs layers have been studied for their importance on having a spin polarizing layer inside a semiconductor nanostructure sado ; us1 .
A survey on the optical and transport properties of GaMnAs samples over a wide range of concentrations nottingham ; prague identified the existence of an impurity band and explored the character of the states near the Fermi level manyauthors . Impurity band in GaMnAs has been calculated usapl ; fiete . It is known that the character of holes determines the indirect interaction bhat1 ; nolting among the magnetic ions, influencing the Curie temperature of magnetically ordered samples.
In this work we address the entanglement of the magnetic and transport properties of GaMnAs. We model a thin Ga1-xMnxAs layer by a quasi-two-dimensional heavy hole gas of areal density submitted to Coulomb scattering by a negative ionized impurity system of concentration . The two concentrations and are considered as independent parameters. This is important in the present context, since it allows for changing and by co-doping furdyna2003 or controlling by external means chiba2006 ; furdyna2007 . In addition to the Coulomb scattering, the spins of the carriers are assumed to interact with the localized magnetic moments at the Mn ions through a Hubbard-like sp-d potential us1 .
At low temperatures (as compared to the Curie temperature) we can neglect the magnetic moment fluctuations on the impurities, which otherwise produce spin-flip scattering. Assuming an homogeneous distribution of the localized magnetic moments resulting into an average normalized magnetization, , the effective magnetic potential becomes . The hole spins are aligned () or anti-aligned to the average magnetization (). is the Mn doping factor, and is the exchange potential for holes, eV matsu1 . If , introduces a splitting of 150 meV for fully magnetic ordered samples.
For a very large number of impurities, we can define an “impurity-averaged” Green’s function, , assuming they are randomly located without any correlation. The multiple scattering approximation consists in selecting from the self-energy insertions only those consisting in the scattering which occur several times by the same impurity, as described in Figure 1.
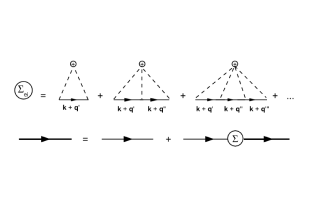
It is convenient to define a vertex function ghaz1 ; usapl :
| (1) | |||||
where is the concentration of scatterers and is the Coulomb scattering potential. In terms of this vertex function, the impurity self-energy becomes . A function is defined as . With this we obtain a linearized matrix equation: where the sign tilde is used to identify a matrix. A self-consistent process is therefore established.
A free electron, or an electron in a perfectly periodic crystal with effective mass and wave vector , has its energy determined by the wave vector, . The spectral density function (SDF) for a given in this case is represented by a delta function in variable , centered at . On the other extreme, a hidrogen-like electron bound to an impurity is a well localized particle in the real space in a region of dimensions given in the scale of the effective Bohr radius. Its SDF is well spread in the reciprocal space, having a half-Laurentzian shape with its maximum at and half width , in a scale of the inverse of the Bohr radius. In the past, doped bulk silicon was studied in a wide range of concentrations using the Klauder multiple-scattering technique ghaz1 . A sharp density of states (DOS) at the proper impurity energy and a well defined conduction band were obtained in the extreme diluted regime. A broadening of the impurity band and a tailing of the conduction band were observed in the intermediate regime, and a mixing of them appeared in the highly concentrated regime ghaz1 , in that case around cm-3 . This behavior of the DOS comes out of the disorder due to randomly located scattering centers, leading to a non-metal-to-metal transition. This transition is associated to the change in the aspect of the SDF by crossing the Fermi level.
We have performed similar multiple-scattering calculations for ferromagnetic GaMnAs usapl samples having a much higher density of carriers, of the order of cm-3. For heavy holes in GaAs, , standing for the electron rest mass. In the middle of the calculated spin-polarized impurity bands the SDF has the localized half-Laurentzian-shape. Deep inside the spin-polarized valence band the SDF has a Laurentzian shape with a pronounced peak in the neighborhood of a given value of . However, due to the extremely high concentration of impurities, the DOS of the impurity and the valence parts of the DOS collapse, and we obtain two spin-polarized sub-bands. Then, we need to know about the possible existence of a mobility edge inside them, i.e., an energy, for a given spin-polarization, where the character of the hole state changes from localized to extended, and if this energy lies below the Fermi energy.
Inspired on the arguments above we defined in this work a parameter , based on the width and on the location of the peak of the SDF, as the ratio , where is the wave vector at which the SDF for a given energy reaches its maximum, and is the width of the anti-aligned SDF for this energy. Obviously, the higher the more “conductive”, or less localized is the state. For instance, a free hole gives zero width and a value infinity for the parameter. A single-impurity bound hole gives a value zero for the parameter. In all cases calculated the spin-aligned bands were fully localized, therefore they do not contribute to the transitions. Then, we classify the character of the samples by a figure of merit defined as
| (2) |
where refers to the highest value obtained inside our ensemble, i.e., among the set of and used to characterize our samples. By obtaining for energies going downward from , we can identify a nominal mobility edge as the energy for which the figure of merit tends to zero.
A calculation of the SDF for a fully ordered, , sample with cm-2 and cm-2 is shown in Fig.2. The SDF is shown for a few energies below and above the nominal mobility edge. No sudden change occurs, but the shape of the curve changes continuously and quickly in the neighborhood of Ry*. This energy lies in the anti-aligned band in a region where the impurity band merged totally into the valence band, as shown in the inset. This sample is representative of the best figure of merit obtained in our ensemble.

Figure 3 shows a 2D plot of the figure of merit in a wide interval of and with its color scale appended. It is remarkable the formation of an “island” of metallic samples in the neighborhood of cm-2 and cm-2. Crossing the scale from left to right we go through the two transitions that have been observed experimentally. First, there is a non-metal-to-metal transition, at the far left region. Keeping constant and increasing we enter a region, starting nearly at cm-2 and ending at cm-2, where the figure of merit reaches the maximum value, shown in the figure by the straight line segment in black. We leave this island by entering a region where the figure of merit decreases very quickly, after cm-2, which is clearly associated to the metal-to-non-metal transition occurring on the ferromagnetic samples with high Mn concentration. Representative points with maximum of the figure of merit correspond to the best quality sample from the metallic point of view. According to the conclusions based on the samples shown in Ref. sado, , they are expected to show the highest Curie temperatures. Another region where good metallic samples appears is in the upper left side of our figure. However, this is a region where is low and high, as compared with , and subjected to oscillations on the indirect exchange potential. It is also remarkable that the right hand side of the plot shows all states as localized. This is a region of high disorder, corresponding to high Mn concentration.
The values of the density of extended carriers for each metallic sample, , are shown in Fig. 4, as the ratio . A Hall measurement is, in fact, a measurement of . We can see that, for cm-2 and cm-2 we have roughly 40% of the total hole charge as extended. Since this island corresponds to a fraction , this means that the “best samples” in our ensemble corresponds to the density of holes 20% of the Mn concentration, matching very well the experimental observations.
The entanglement of disorder and spin polarization leads to the existence of a region in which a non-metal-to-metal transition occurs, as the Mn concentration is increased. Following a track in which a favorable relation exists between the Mn and the hole concentrations, we cross an island of metallic samples and reach another transition, this time into a non-metallic state. The transitions are determined solely by the relative positions of the Fermi level and the mobility edge. This calculation brings light to the origin of the magnetic and transport properties of GaMnAs. At low Mn concentrations the magnetic order is assumed to be provided by localized hole states, the Curie temperature being, in consequence, rather low. By increasing the Mn concentration the average magnetization determined by those localized states mechanism persists, but as soon as we go through a non-metal-to-metal transition the extended states come into play. They now contribute to increase the magnetic order through an indirect exchange, the Curie temperature raising as we choose a “good track” to reach the region of the best samples in the metallic island. Somewhere in this region the Curie temperature reaches its maximum value, controlled by the dependence of the exchange potential on the parameters and . By keeping the Mn concentration increasing and following the track, we leave the best samples region and we go through the metal-to-non-metal transition. This is the end of the indirect exchange mediated by the extended carriers, and the Curie temperature decreases.
This work, supported by CNPq, CAPES FAPERJ, and FAPEMIG, Brazil, is dedicated to the memory of A. Ghazali.
References
- (1) F. Matsukura, h. Ohno, A. Shen, and Y. Sugawara, Phys. Rev. B 57, R2037 (1998).
- (2) A. Oiwa, S. Katsumoto, A. Endo, M. Hirasawa, Y. Iye, H. Ohno, F. Matsukura, A. Shen, and Y. Sugawara, Solid State Commun. 103 209 (1997).
- (3) D. Chiba, K. Takamura, F. Matsukura, and H. Ohno, Appl. Phys. Lett. 82, 3020 (2003).
- (4) R. Mathieu, P. Svendlindh, J. Sadowski, K. Światek, M. Karlsteen, J. Kanski, and L. Ilver, Appl. Phys. Lett. 81, 3013 (2002).
- (5) M. A. Boselli, I. C. da Cunha Lima, and A. Ghazali, Phys. Rev. B 68, 085319 (2003).
- (6) R. P. Campion, K. W. Edmonds, L. X. Zhao, K. Y. Wang, C. T. Foxon, B. L. Gallagher, and C. R. Staddon, J. Cryst. Growth 247, 42 (2003).
- (7) M. Kopecký, J. Kub, E. Busetto, A. Lausi, M. Cukr, V. Novák, K. Olejník, J. P. Wright, and J. Fábry, J. Appl. Crystallogr. 39, 735 (2006).
- (8) T. Jungwirth, J. Sinova, A. H. MacDonald, B. L. Gallagher, V. Novák, K. W. Edmonds, A. W. Rushforth, R. P. Campion, C. T. Foxon, L. Eaves, E. Olejník, J. Mašek, S.-R. Eric Yang, J. Wunderlich, C. Gould, L. W. Molenkamp, T. Dietl, and H. Ohno, Phys. Rev. B 76, 125206 (2007).
- (9) E. Dias Cabral, M. A. Boselli, A. T. da Cunha Lima, A. Ghazali, and I. C. da Cunha Lima, Appl. Phys. Lett. 90, 142118 (2007).
- (10) G. A. Fiete, G. Zaránd and K. Damle Phys. Rev. Lett. 91, 097202 (2003); G. A. Fiete, G. Zaránd, K. Damle, and C. Pascu Moca, Phys. Rev B, 72, 045212 (2005).
- (11) M. Berciu, and R. N. Bhatt, Phys. Rev. Lett. 87, 107203 (2001); M. P. Kennett, M. Berciu, and R. N. Bhatt, Phys. Rev. B 66, 045207 (2002).
- (12) G. Tang, W. Nolting, Phys. Rev. B 75, 024426 (2007).
- (13) Sh. U. Yuldashev, Hyunsik Im, V. Sh. Yalishev, C. S. Park, and T. W. Kang, S. Lee, Y. Sasaki, X. Liu, and J. K. Furdyna, Appl. Phys. Lett. 82, 1206 (2003).
- (14) D. Chiba, M. Yamanouchi, F. Matsukura, H. Ohno, Science 301, 943 (2003); D. Chiba, F. Matsukura, H. and Ohno, Appl. Phys. Lett. 89, 162505 (2006).
- (15) J. Wang, I. Cotoros, K. M. Dani, X. Liu, J. K. Furdyna, and D. S. Chemla, Phys. Rev. Lett. 98, 217401 (2007).
- (16) J. Serre, and A. Ghazali, Phys. Rev. B 28, 4704 (1983).