GALEX Spectroscopy of SN 2005ay suggests UV spectral uniformity among type II-P supernovae
Abstract
We present the first results from our GALEX program designed to obtain
ultraviolet (UV) spectroscopy of nearby core-collapse supernovae (SNe).
Our first target, SN 2005ay in the nearby galaxy NGC 3938, is a typical
member of the II-P SN subclass. Our spectra show remarkable similarity
to those of the prototypical type II-P event SN 1999em, and resemble
also Swift observations of the recent type II-P
event SN 2005cs. Taken together, the observations of these three events
trace the UV spectral evolution of SNe II-P during the first month after
explosion, as required in order to interpret optical observations
of high-redshift SNe II-P, and to derive cross-filter K-corrections.
While still highly preliminary, the apparent UV homogeneity of SNe II-P
bodes well for the use of these events as cosmological probes at high
redshift.
Subject headings:
supernovae: individual (SN 2005ay) – ultraviolet: general1. Introduction
In order to interpret optical observations of high-redshift supernovae (SNe), sampling the restframe ultraviolet (UV) radiation of these events, we need to have UV observations of local SNe of all types. Studies of high-redshift SNe promise, in turn, to shed light on key open questions, such as the evolution of cosmic metallicity, star formation at high redshift, and SN “feedback” processes shaping galaxy formation.
Type Ia SNe, famed for their cosmological utility as precision distance estimators, are the best-studied of all SN subclasses in restframe UV (e.g., Kirshner et al. 1993; Ellis et al. 2008; Foley et al. 2007, 2008). SNe Ia are broadly thought to result from thermonuclear explosions of white dwarf stars approaching the critical Chandrasekhar mass due to accretion from (or a merger with) a binary companion, and show remarkable homogeneity in their observational properties. However, UV studies may hint at unexplained dispersion in the restframe UV band (Ellis et al. 2008).
All other types of SNe (see Filippenko 1997 for a review) probably result from the gravitational collapse of short-lived massive stars (e.g., Crockett et al. 2008; Li et al. 2007, Gal-Yam et al. 2007 and references therein). In general, core-collapse SNe are extremely heterogeneous in every observational respect, and, in particular, different types of core-collapse events have diverse UV properties (e.g., UV-bright type IIn SN 1998S, Lentz et al. 2001 vs. UV-deficient type Ic SN 1994I, Millard et al. 1999). The dispersion in UV properties among objects within specific core-collapse SN subtypes are so far unknown.
Unfortunately, UV spectroscopy of reasonable quality was obtained for only a handful of core-collapse SNe (Panagia 2003; 2007 for reviews) and some of the best-observed events (notably SN 1987A, e.g., Eastman & Kirshner 1989) are quite peculiar. This observational deficit introduces significant uncertainties into the interpretation of high-redshift SN observations, which are forced to rely either on little-tested models for the UV spectrum of core-collapse events, or on the use of the few observed UV spectra for the entire population, neglecting possible dispersion in spectral evolution. The sparse database of UV core-collapse SN spectroscopy continues to limit the scientific utility of large samples of core-collapse SNe at high redshifts. These include both samples currently assembled using the Hubble Space Telescope (HST; e.g., GOODS, Dahlen et al. 2004; Riess et al. 2007) and from the ground (e.g., Poznanski et al. 2007a), and future datasets expected to emerge from a possible JDEM mission that includes a SN component and from deep infrared observations with the James Webb Space Telescope. Furthermore, in order to probe the physics of core-collapse SNe, broad spectral coverage, particularly of the UV range, where line blanketing by iron peak elements plays a crucial role in the formation of the spectrum (e.g., Pauldrach et al. 1996), is essential. UV spectra are most sensitive to the metal content of the SN ejecta, a key probe of the nucleosynthetic evolution.
To alleviate this problem is the main motivation for our target of opportunity GALEX program (GALEX-GI-44, cycle 1; GALEX-GI-67, cycle 2; GALEX-GI-61, cycle 3; GALEX-GI-20, cycle 4; PI Gal-Yam), designed to obtain multi-epoch UV spectroscopy of nearby core-collapse SNe. Here, we report the first results from this program. In we describe our observation, and in we present our results. Discussion and conclusions follow in . UT dates are used throughout the paper.
2. Observations
SN 2005ay in the nearby galaxy NGC 3938 (heliocentric velocity ) was discovered on 2005 March 27 by Rich (2005) and rapidly identified as a type II supernova (Taubenberger et al. 2005; Gal-Yam & Smith 2005). Pre-explosion limits (2005 March 19; Yamaoka & Itagaki 2005) indicate it was discovered shortly after explosion, leading us to trigger our GALEX target of opportunity program.
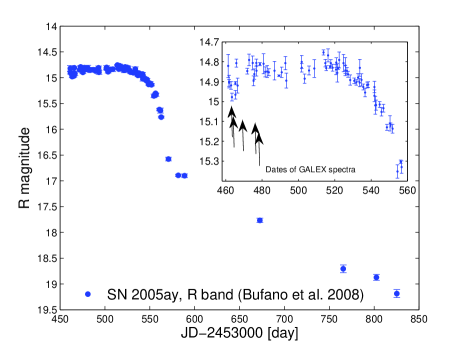
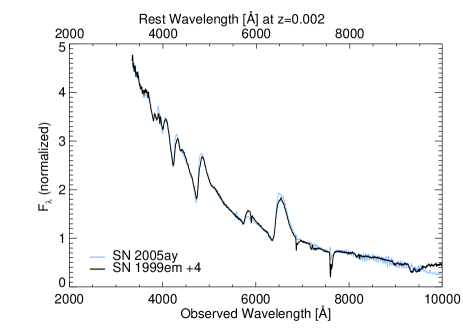
Following the activation of our GALEX program, we launched an intensive campaign to study SN 2005ay from the ground in optical and IR wavelengths, to complement the GALEX UV study. We obtained dense multicolor photometry during the months after the SN discovery, and followed its decline for approximately a year (Fig. 1). Numerous optical spectra follow the evolution of this object in great detail, starting shortly after explosion (Fig. 2). Our observations confirm the identification of this event as a typical SN II-P (Tsvetkov et al. 2006), and will be reported in detail by Bufano et al. (in preparation). In this Letter we present the earliest GALEX UV spectra of SN 2005ay and compare it with additional examples from the literature (Fig. 3). The spectral similarity between these supernovae highlights an emerging picture of uniform UV properties of SNe II-P, the most common subclass of core-collapse SNe, and the first for which analysis based on a sample of events is possible.
The GALEX mission observed SN 2005ay in grism spectroscopy mode on 2005 April 2, 3, 8, 15 and 16. At that time, only the near-UV (NUV) camera was operational, yielding a wavelength coverage of Å. Reduction of these data required a custom approach, in order to properly remove the contribution from UV-bright knots and residual small-scale structure in the nearby spiral arm of the host galaxy, NGC 3938. This process will be presented in detail by Bufano et al. (in preparation). In brief, we have obtained reference grism-dispersed images of the location of SN 2005ay on 2007 March 4-28, presumably including only negligible light from SN 2005ay, using an identical instrumental configuration. We performed digital image subtraction using the 2007 epoch as reference, and extracted our spectra from the background-subtracted reference frames. Fig. 3 shows the combined spectra obtained on Apr. 2, 2005 (4 GALEX orbits; total exposure time 5705 s) and Apr. 3 2005 (7 orbits; 9516 s). The spectra were binned to Å resolution elements to increase the signal-to-noise ratio. Errors for each spectral bin were directly measured from the dispersion among consecutive orbits (1 errors are plotted in Fig. 3).
3. Discussion
3.1. UV Homogeneity
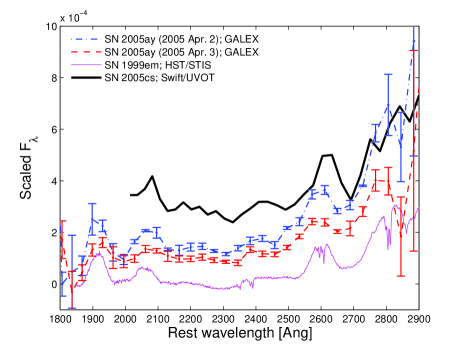
In Figure 3, we compare our restframe-UV spectra of SN 2005ay with those of two other SNe II-P, SN 1999em and SN 2005cs, which are the only other II-P events with high signal-to-noise ratio restframe-UV spectra. SN 1999em was discovered on 1999 October 28.9, and the estimated explosion date is days before discovery (Leonard et al. 2000). The HST spectrum reproduced here (Baron et al. 2000) was obtained on 1999 Nov. 5, i.e., approximately 12 days after explosion. SN 2005cs was discovered on 2005 June 29, approximately two days post-explosion (Dessart et al. 2008). The Swift spectrum reproduced here was obtained on 2005 July 3, i.e., approximately 6 days post-explosion (Brown et al. 2007). Tsvetkov et al. (2006) estimate the explosion date of SN 2005ay as 2005 March days. From spectral comparison with SN 1999em (Fig. 2) we find that the TNG spectrum of SN 2005ay has, consistently, an age of approximately 9 days after explosion. So our GALEX spectra reported in Fig. 3 were obtained 11-13 days post explosion. This estimate is also consistent with available pre-explosion limits ().
Since the UV spectra of SNe evolve rapidly, in order to compare our GALEX spectra with those from the literature we had to adjust the Swift spectrum of SN 2005cs (obtained days post explosion) to approximately match those of the other events, both of which happen to have been obtained at a similar epoch (11-13 days post explosion). We perform this adjustment using two alternative methods, giving consistent results. First we interpolated the Swift photometry reported by Brown et al. (2007) and Dessart et al. (2008) in the , and bands (central wavelengths Å, Å, and Å, respectively, see Brown et al. 2007 for additional bandpass details), which bracket our wavelength range, to 6 and 12 days post explosion. We then adjust the spectral shape of the early spectrum to match the evolution of the spectral energy distribution of the SN, measured from Swift photometry.
Alternatively, we can use an additional spectrum obtained by Swift days after explosion. This later spectrum has much lower signal-to-noise ratio (see Brown et al. 2007). However, assuming that the spectral shape of this late spectrum is correct, even if individual features cannot be reliably measured, we can adjust the day 6, high signal-to-noise spectrum to match the shape of the day 11 spectrum. This yields consistent results with those obtained using the UV photometry (see above) and we plot the adjusted spectrum in black in Figure 3. A more detailed discussion of the Swift spectra of SN 2005cs will appear in Bufano et al. (in preparation). Obviously, both these procedures introduce additional uncertainties to the spectral shape of SN 2005cs, which should therefore be regarded as approximate only (in contrast to the other spectra in Fig. 3 that have not been modified from their observed form).
UV spectra are particularly sensitive to effects of dust extinction. Since the estimated extinction for the three events in question is uncertain but small ( mag; Leonard et al. 2002, Baron et al. 2000; Pastorello et al. 2006; Brown et al. 2007; Dessart et al. 2008; Tsvetkov et al. 2006; this work (Fig. 2)), we have made no correction for extinction to the spectra in Fig. 3, and postpone a more detailed discussion of this issue to Bufano et al. (in preparation).
Inspecting Fig. 3, we note the remarkable similarity among the spectra of these three SNe. Identical spectral features are prominent, i.e., the Mg II P-Cygni profile around Å, as well as the emission “bumps” around Å, Å, Å, and Å. This similarity is independent of the overall spectral shape and suggests that similar physical conditions occur at the photospheres of these SNe. The continuum shape is also almost identical when SN 1999em and SN 2005ay are compared, with SN 2005cs also a close match, considering the additional uncertainty introduced to compensate for the earlier observation (see above). This apparent homogeneity is in stark contrast to the wide diversity among UV spectra of other subtypes of core-collapse SNe, and is instead reminiscent of the uniformity among UV spectra of standard type Ia supernovae (e.g., Foley et al. 2008).
The combined set of restframe UV spectroscopy now available for SNe II-P (SN 1999em, SN 2005cs and SN 2005ay) samples the UV spectral evolution of such events between 6 days (the earliest Swift observation of SN 2005cs) and 25 days (our last GALEX spectrum of SN 2005ay) after explosion. Assuming these events are representative of the population of SNe II-P, the data suffice to describe the UV evolution these objects throughout the interesting UV-bright period after explosion (Bufano et al., in preparation).
3.2. Implications
The use of SNe II-P as an alternative cosmological distance indicator to SNe Ia has been advocated for many years (e.g., Kirshner & Kwan 1974; Wagoner 1977; Schmidt et al. 1994; Hamuy & Pinto 2002; Baron et al. 2004). Nugent et al. (2006) have recently demonstrated that SN II-P distances can be measured, with existing facilities, out to cosmological distances, and that an independent cosmological measurement is feasible. A possible advantage of SNe II-P for cosmological use is that these events, arising from the explosion of relatively low-mass red supergiant stars (e.g., Hendry et al. 2006; Li et al. 2007 and references therein) are much more common (per unit volume) than SNe Ia, and should occur in abundance out to high redshifts, where such massive stars are formed in great numbers. SNe Ia, in contrast, may show a decline in rate above (Dahlen et al. 2008; though see Poznanski et al. 2007a), which, if real, may reflect a metallicity “floor” required for these events to take place (Kobayashi et al. 1998), or a long delay time between the formation of SN Ia progenitors and their explosion (Strolger et al. 2004).
Since optical detectors still offer the most powerful combination of efficiency, low sky background, and relatively wide fields, taking advantage of the benefits of SNe II-P for cosmology at high redshifts may require the use of optical surveys, sampling the restframe UV, to discover high redshift SNe II-P. A UV spectral homogeneity as suggested by our data, if confirmed, would allow the use of UV spectral templates to discover and photometrically identify high-redshift SNe II-P (e.g., Poznanski et al. 2002; Riess et al. 2004; Poznanski et al. 2007b). Furthermore, accurate photometry could be derived using cross-filter K-corrections which take into account the effects of spectral features using template spectra (S-corrections; Stritzinger et al. 2002).
Another important application of high-redshift supernova surveys is to measure supernova rates, which probe the star formation rate and cosmic metal production. SNe that decline quickly in the UV would be detectable for shorter periods in restframe-UV surveys, and thus a small number of detections is translated into a higher true rate, while a smaller correction needs to be applied to SNe that remain bright in restframe UV longer. Properly calculating these corrections for SNe at different redshifts, for which the same survey band samples different spectral ranges within the restframe UV, requires detailed knowledge about the spectral evolution of SNe, one of the goals of our GALEX program. As shown here, for SNe II-P, the most common type of core-collapse subtypes, we have made good progress in achieving this goal.
4. Conclusions
We are carrying out a spectroscopic survey of nearby core-collapse SNe using GALEX grism spectroscopy in target-of-opportunity mode. About nearby events are observed each year, increasing our knowledge of the spectral evolution of core-collapse SNe of the various subtypes. Our collaboration also provides supporting IR and optical observations of our GALEX targets. We have presented first results from this project – spectra of the nearby type II-P SN 2005ay. Combined with additional observations of two similar objects from the literature, we trace the UV spectral evolution of SNe II-P and find a remarkable similarity among these objects, the most common type of core-collapse SNe and the only subtype with a sample of events having UV spectroscopic measurements. Such restframe-UV homogeneity, if supported by additional objects, indicates that the use of these SNe as cosmological probes is a promising prospect.
Acknowledgments
Based on observations made with the NASA Galaxy Evolution Explorer, GALEX, which is operated for NASA by the California Institute of Technology under NASA contract NAS5-98034. We further acknowledge financial support from NASA through the GALEX guest investigator program (projects GALEX-GI-44, cycle 1; GALEX-GI-67, cycle 3, and GALEX-GI-20, cycle 4). We are indebted to the GALEX Science Operations Center (SOC), and in particular to K. Forster, for making this ToO program possible. We thank D. Poznanski for comments on the manuscript. A.G. acknowledges support by the Benoziyo Center for Astrophysics and the William Z. and Eda Bess Novick New Scientists Fund at the Weizmann Institute. SB, EC and MT are supported by the Italian Ministry of Education via the PRIN 2006 n.2006022731 002.
References
- Baron et al. (2000) Baron, E., et al. 2000, ApJ, 545, 444
- Baron et al. (2004) Baron, E., Nugent, P. E., Branch, D., & Hauschildt, P. H. 2004, ApJ, 616, L91
- Brown et al. (2007) Brown, P. J., et al. 2007, ApJ, 659, 1488
- Crockett et al. (2008) Crockett, R. M., et al. 2008, ArXiv e-prints, 805, arXiv:0805.1913
- Dahlén et al. (2004) Dahlen, T., et al. 2004, ApJ, 613, 189
- Dahlén et al. (2008) Dahlen, T., Strolger, L.-G., & Riess, A. G. 2008, ArXiv e-prints, 803, arXiv:0803.1130
- Dessart et al. (2008) Dessart, L., et al. 2008, ApJ, 675, 644
- Eastman & Kirshner (1989) Eastman, R. G., & Kirshner, R. P. 1989, ApJ, 347, 771
- Ellis et al. (2007) Ellis, R. S., et al. 2007, ApJ, 674, 51
- Filippenko (1997) Filippenko, A. V. 1997, ARA&A, 35, 309
- Foley et al. (2007) Foley, R. J., et al. 2007, ArXiv e-prints, 710, arXiv:0710.2338
- Foley et al. (2008) Foley, R. J., Filippenko, A. V., & Jha, S. W. 2008, ArXiv e-prints, 803, arXiv:0803.1181
- Gal-Yam & Smith (2005) Gal-Yam, A., & Smith, G. P. 2005, The Astronomer’s Telegram, 448, 1
- Gal-Yam et al. (2007) Gal-Yam, A., et al. 2007, ApJ, 656, 372
- Hamuy & Pinto (2002) Hamuy, M., & Pinto, P. A. 2002, ApJ, 566, L63
- Hendry et al. (2006) Hendry, M. A., et al. 2006, MNRAS, 369, 1303
- Howell et al. (2005) Howell, D. A., et al. 2005, ApJ, 634, 1190
- Kirshner & Kwan (1974) Kirshner, R. P., & Kwan, J. 1974, ApJ, 193, 27
- Kirshner et al. (1993) Kirshner, R. P., et al. 1993, ApJ, 415, 589
- Kobayashi et al. (1998) Kobayashi, C., Tsujimoto, T., Nomoto, K., Hachisu, I., & Kato, M. 1998, ApJ, 503, L155
- Leonard et al. (2002) Leonard, D. C., et al. 2002, PASP, 114, 35
- Li et al. (2007) Li, W., Wang, X., Van Dyk, S. D., Cuillandre, J.-C., Foley, R. J., & Filippenko, A. V. 2007, ApJ, 661, 1013
- Lentz et al. (2001) Lentz, E. J., et al. 2001, ApJ, 547, 406
- Li et al. (2007) Li, W., Wang, X., Van Dyk, S. D., Cuillandre, J.-C., Foley, R. J., & Filippenko, A. V. 2007, ApJ, 661, 1013
- Millard et al. (1999) Millard, J., et al. 1999, ApJ, 527, 746
- Nugent et al. (2006) Nugent, P., et al. 2006, ApJ, 645, 841
- Panagia (2007) Panagia, N. 2007, ArXiv e-prints, 704, arXiv:0704.1666
- Panagia (2003) Panagia, N. 2003, Supernovae and Gamma-Ray Bursters, 598, 113
- Pastorello et al. (2006) Pastorello, A., et al. 2006, MNRAS, 370, 1752
- Pauldrach et al. (1996) Pauldrach, A. W. A., Duschinger, M., Mazzali, P. A., Puls, J., Lennon, M., & Miller, D. L. 1996, A&A, 312, 525
- Poznanski et al. (2002) Poznanski, D., Gal-Yam, A., Maoz, D., Filippenko, A. V., Leonard, D. C., & Matheson, T. 2002, PASP, 114, 833
- Poznanski et al. (2007a) Poznanski, D., et al. 2007a, MNRAS, 382, 1169
- Poznanski et al. (2007) Poznanski, D., Maoz, D., & Gal-Yam, A. 2007, AJ, 134, 1285
- Rich (2005) Rich, D. 2005, IAU Circ., 8500, 2
- Riess et al. (2004) Riess, A. G., et al. 2004, ApJ, 607, 665
- Riess et al. (2007) Riess, A. G., et al. 2007, ApJ, 659, 98
- Schmidt et al. (1994) Schmidt, B. P., Kirshner, R. P., Eastman, R. G., Phillips, M. M., Suntzeff, N. B., Hamuy, M., Maza, J., & Aviles, R. 1994, ApJ, 432, 42
- Stritzinger et al. (2002) Stritzinger, M., et al. 2002, AJ, 124, 2100
- Strolger et al. (2004) Strolger, L.-G., et al. 2004, ApJ, 613, 200
- Taubenberger et al. (2005) Taubenberger, S., Benetti, S., Harutyunyan, A., & Zurita, A. 2005, IAU Circ., 8502, 3
- Tsvetkov et al. (2006) Tsvetkov, D. Y., Volnova, A. A., Shulga, A. P., Korotkiy, S. A., Elmhamdi, A., Danziger, I. J., & Ereshko, M. V. 2006, A&A, 460, 769
- Wagoner (1977) Wagoner, R. V. 1977, ApJ, 214, L5
- Yamaoka & Itagaki (2005) Yamaoka, H., & Itagaki, K. 2005, IAU Circ., 8502, 4