First Stellar Velocity Dispersion Measurement of a Luminous Quasar Host with Gemini North Laser Guide Star Adaptive Optics
Abstract
We present the first use of the Gemini North laser guide star adaptive optics (LGS AO) system and an integral field unit (IFU) to measure the stellar velocity dispersion of the host of a luminous quasar. The quasar PG1426+015 () was observed with the Near-Infrared Integral Field Spectrometer (NIFS) on the 8m Gemini North telescope in the H-band as part of the Science Verification phase of the new ALTAIR LGS AO system. The NIFS IFU and LGS AO are well suited for host studies of luminous quasars because one can achieve a large ratio of host to quasar light. We have measured the stellar velocity dispersion of PG1426+015 from to (0.16 kpc to 1.6 kpc) to be based on high signal-to-noise ratio measurements of Si I, Mg I, and several CO bandheads. This new measurement is a factor of four more precise than a previous measurement obtained with long-slit spectroscopy and good, natural seeing, yet was obtained with a shorter net integration time. We find that PG1426+015 has a velocity dispersion that places it significantly above the - relation of quiescent galaxies and lower-luminosity active galactic nuclei with black hole masses estimated from reverberation mapping. We discuss several possible explanations for this discrepancy that could be addressed with similar observations of a larger sample of luminous quasars.
Subject headings:
galaxies: active — galaxies: kinematics and dynamics1. Introduction
The link between central supermassive black holes and the properties of their host galaxies has been firmly established in both quiescent galaxies and active galactic nuclei (AGNs; Kormendy & Richstone, 1995; Ferrarese & Merritt, 2000; Gebhardt et al., 2000a, b; Ferrarese et al., 2001; Graham et al., 2001; Marconi & Hunt, 2003; Hring & Rix, 2004). Arguably, the tightest correlation is the - relation, which relates the mass of the central black hole () and the stellar velocity dispersion of the host spheroid (). In active galaxies, the stellar velocity dispersion is typically measured using the Ca II triplet stellar absorption features at rest wavelengths of 8498, 8542, and 8662Å. The most direct and broadly applicable method for measuring the central black hole mass in active galaxies is through reverberation mapping, where the time delay between continuum and emission line variations is used as a measure of the radius of the broad-line region () and the width of the H emission line () is used as a measure of the gas velocity within the BLR (Blandford & McKee, 1982; Peterson, 1993). Then one uses the virial equation to calculate the mass:
| (1) |
The scale factor accounts for the unknown geometry, kinematics, and inclination of the BLR. Onken et al. (2004, hereafter O04) estimated statistically for the AGN population under the assumption that the zero-point of the - relation is the same for active and inactive galaxies. They derive a value of from a sample of 14 active galactic nuclei (AGNs) with masses determined by reverberation mapping and stellar velocity dispersions determined using the Ca II triplet. Using single-epoch spectroscopy, this scale factor is applied in black hole mass estimates for large samples of AGNs out to high redshift (see McGill et al. 2008 for a recent summary).
The calculation of has unfortunately been limited to low-luminosity AGNs for two reasons: dilution of stellar features by the AGN continuum and the relative scarcity of higher-luminosity AGNs. In particular, observations of higher-luminosity objects necessitate observations of higher-redshift objects, yet telluric absorption mostly limits the utility of the Ca II triplet to . Both of these problems can be somewhat circumvented with stellar velocity dispersion observations using CO bandheads in the near infrared (NIR) H-band. This wavelength range corresponds to the maximum ratio of the stellar emission from the host galaxy to the quasar continuum (Wright et al., 1994; Elvis et al., 1994). Additionally, current adaptive optics (AO) systems function well in the NIR. This combination facilitates velocity dispersion measurements of luminous quasar hosts, which are essential to determine if these objects fall on the - relation and/or are characterized by the same as lower-luminosity AGNs.
A suitable sample of higher-luminosity quasars for such a study is the reverberation-mapped sample discussed by Peterson et al. (2004). The 16 PG quasars studied in this work are on average 40 times more luminous, with black holes 10 times more massive, than the AGNs in the O04 sample (the O04 and PG quasar samples have average luminosities of and , respectively, and average black hole masses of and 8.65, respectively). Work has already begun to measure velocity dispersions in this luminosity regime. Dasyra et al. (2007, hereafter D07) investigated the hypothesized evolutionary link between PG quasars and ultra-luminous infrared galaxies (ULIRGs) with H-band CO bandhead measurements of 12 PG quasars. These data were obtained using the ISAAC long-slit spectrometer (Moorwood et al., 1998) on the 8m Antu unit of the Very Large Telescope under good natural seeing conditions. The H-band CO absorption features were detected in most of the quasars, including four reverberation-mapped quasars. However, the observations were still of faint hosts with significant nuclear emission contamination. This resulted in rather noisy host-galaxy spectra for some objects and velocity dispersions with uncertainties ranging from to ( error).
Over the next few years, integral field units (IFUs) combined with increasingly reliable AO systems should lead to substantial improvements in studies of the hosts of luminous quasars. The primary advantage of using an IFU is that more of the light in the region of interest (for example, we probe the central ) is dispersed rather than just the light within a normal single slit (e.g., in D07). Consequently, more host-galaxy light from near the galaxy’s center is gathered in a single exposure. AO is a further aid because the contamination by the intrinsically point-like quasar can be confined to the central few pixels of the image, thus minimizing the quasar dilution of the stellar absorption features. As a demonstration of this approach, we present observations of PG1426+015 obtained with the Near-Infrared Integral Field Spectrometer (NIFS) during Science Verification Time for the new ALTAIR Laser Guide Star (LGS) AO system at Gemini North. We specifically chose PG1426+015 because it had a relatively uncertain velocity dispersion measurement in the earlier study of D07, yet one which placed it suggestively above the - relation (along with two of the three other luminous reverberation-mapped quasars).
2. Observations, Data Reduction, and Data Analysis
The observations of PG1426+015 and the velocity template HIP 75799 (K0III) were carried out at Gemini North on 2007 February 6-7, and April 29 using NIFS (McGregor et al., 2002). Three additional velocity templates – HD 84769 (K5III), V* BU CVn (M1III), and BD+23 1138 (M5Ia) – were observed on 2008 February 12, 14, and 15. The image slicer of NIFS divides the 3 field of view into 29 spectroscopic slices. NIFS was fed by ALTAIR, the AO system at Gemini North, using both a natural and laser guide star (Herriot et al., 2000; Boccas et al., 2006). The quasar was used as the natural guide star for tip/tilt corrections. The average AO-assisted seeing during our observations was in the H band. The average uncorrected seeing, as measured by ALTAIR at the end of each exposure, was . Typical Strehl ratios for H-band observations using the Gemini LGS AO system are about 10%.
Our observations were obtained with the H grating and the JH filter. The spectral resolution is (FWHM velocity resolution ) and there are 1.9 pixels per resolution element. The H-band wavelength coverage from to contains many strong atomic and molecular features, including Mg I 1.488, Mg I 1.503, CO(3-0) 1.558, CO(4-1) 1.578, Si I 1.589, CO(5-2) 1.598, and CO(6-3) 1.619.
We obtained a total of 2.08 hours integration on PG1426+015 with sequences of 300 second exposures interspersed with regular sky observations. For telluric correction, an A0V star was observed at least once for every hour of quasar or velocity template observations, including sky frames. We also obtained the recommended calibration frames.
The data were processed with Gemini IRAF packages and the recommended reduction steps given on the NIFS website111http://www.gemini.edu/sciops/instruments/nifs/. We only deviated from this prescription to remove the Brackett absorption features in the A0V stellar spectra. For this procedure, we used the xtellcor_general task written by Vacca et al. (2003).
Our final host-galaxy spectrum is the difference between a 1 (1.6 kpc) and 0.1 radius extraction. We empirically chose the outer radius because there was little signal beyond this point and sky subtraction residuals became more evident when it was increased. We chose the inner radius because it included as much host-galaxy light as possible, yet minimized the quasar contribution. The LGS system allowed our inner radius to be substantially smaller than would have been possible under natural seeing conditions.
We measured the stellar velocity dispersion using the penalized pixel fitting (pPXF) method of Cappellari & Emsellem (2004). As is typical in velocity dispersion measurements, this method assumes that the host-galaxy spectrum is represented by a convolution of a stellar template spectrum and the line-of-sight velocity distribution (LOSVD). This routine works in pixel space and the LOSVD is determined by minimization. The LOSVD is assumed to be in the form of a Gauss-Hermite series, where the coefficients are determined simultaneously, but the solution is biased towards a Gaussian.
3. Discussion
Two copies of the host-galaxy spectrum of PG1426+015 are shown in the top and bottom panels of Figure 1. In the top section, the smooth curve shows the spectrum of the M5Ia velocity template, broadened by the best-fit LOSVD. The bottom spectrum shows the host spectrum with the broadened K5III velocity template. No systematic velocity offsets were present between the atomic and molecular features in the host spectrum, so we fit all six absorption features simultaneously. The shaded areas designate spectral regions excluded from our pPXF fit. We excluded the region because it did not show absorption features and had moderate telluric contamination, the region because it was affected by dense sky emission, and the region redward of because of increasingly strong telluric absorption features.
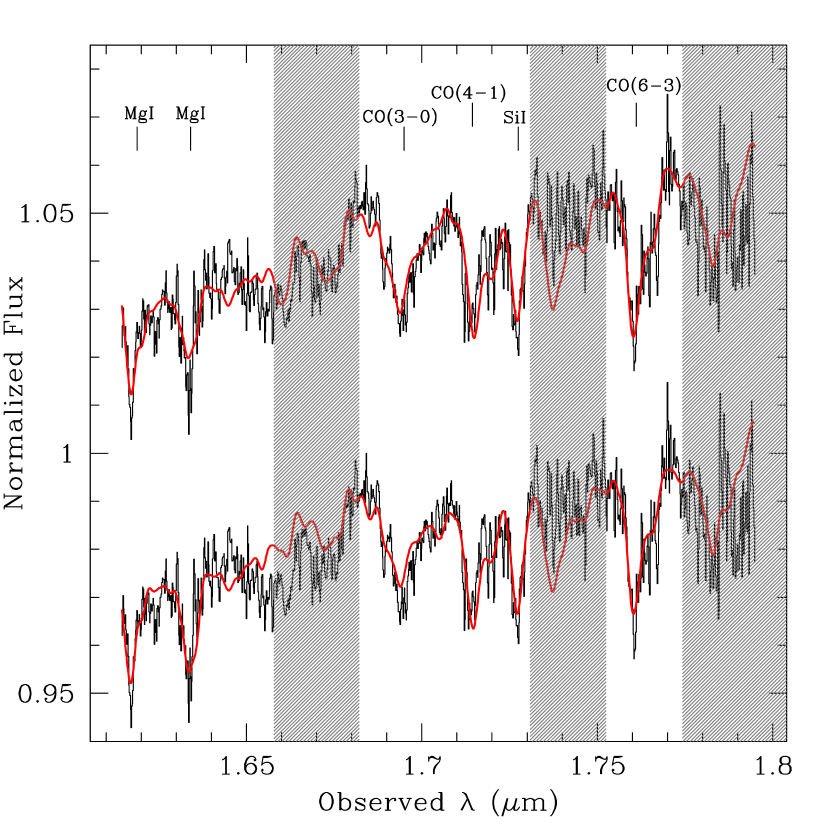
The host-galaxy spectrum has an average signal-to-noise ratio (SNR) of about 190 per pixel. This is larger than the SNR of the long-slit ISAAC spectrum, which was obtained with five hours on-source integration. This increase in the SNR for a spectrum acquired in less time is evidence of the combined advantages of the NIFS IFU and the LGS AO system.
The velocity dispersion resulting from the M5Ia fit is , with a reduced of 0.91, while the velocity dispersion resulting from the K5III fit is , with a reduced of 0.92. The CO(3-0) feature at is better fit by the M5Ia template while the Mg I feature at is better fit by the K5III template. The M1III fit resulted in a velocity dispersion of , with a reduced of 0.98. Because the M1III fit was somewhat worse than the M5Ia and K5III fits, we do not include it in Figure 1 and we use the average of only the K5III and M5Ia values as our final velocity dispersion. The K0III was not a good match to the host spectrum. Genzel et al. (2001) found that K5-M1 giants and supergiants are the best templates for the young stellar populations in ULIRGs (also see Dasyra et al., 2006a, b) while D07 used K0-M0 giants and supergiants as templates for the presumably older stellar populations in quasars. The fact that later spectral-type templates provide better fits to the host spectrum of PG1426+015 may point to a young stellar population in the host galaxy. To determine the error in individual template fits, we varied the velocity dispersion from its best-fit value while holding the velocity and higher-order Gauss-Hermite coefficients constant. In all three cases (using the K5III, M1III, or M5Ia), the location of gave a error bar of . As a measure of the error due to template mismatch, we use the standard deviation of the velocity dispersions determined from the three template fits, which is also . Our final error bar is the quadrature sum of these two errors, resulting in a velocity dispersion for PG1426+015 of .
This measurement is within an effective physical aperture of 1.6 kpc. For comparison, the effective radius () for PG1426+015 is 4.86 kpc (based on a Galfit [Peng et al. 2002] analysis of Hubble Space Telescope Wide-Field Planetary Camera 2 data). Our aperture is intermediate between and , two commonly quoted aperture sizes in the literature. We consequently choose to use our measured value for the remainder of the analysis but note that the velocity dispersion would be if we corrected our value using the relation derived by Jrgensen et al. (1995) for E and S0 galaxies. This correction does not account for the contribution to the velocity dispersion that we miss by excluding the central 0.16 kpc; however, this correction is expected to be small. For comparison, D07 measured the velocity dispersion of PG1426+015 to be . This is about lower than our measured value, although these measurements are consistent. Our higher precision is due to the higher SNR and broader wavelength coverage of the NIFS data.
Figure 2 shows that PG1426+015 is significantly above the - relation for AGNs with masses determined by reverberation mapping. The filled squares represent Ca II triplet measurements from O04. They have been updated with velocity dispersion data from Nelson et al. (2004) and improved reverberation-based black hole masses from Bentz et al. (2006, 2007) and Denney et al. (2006). The open squares represent H-band CO bandhead measurements of the PG quasars studied in D07. The solid line denotes the Tremaine et al. (2002) fit to the quiescent galaxy - relation. We have not used the Ferrarese & Ford (2005) fit to the quiescent galaxy - relation because for the AGN population has not yet been computed relative to this fit. The velocity dispersion presented in this work moves PG1426+015 to the position marked by the open star. With our smaller error bar, PG1426+015 is now more significantly discrepant with the - relation. Note that if we compare the location of PG1426+015 relative to the steeper Ferrarese & Ford (2005) - relation fit (and assume that is not significantly different from 5.5), it is somewhat less significantly discrepant.

D07 found that three of their four reverberation mapped PG quasars lie above the - relation and list three possible reasons for this. First, the scale factor, , from Equation 1 could be different for PG quasars and the lower-luminosity AGNs in the O04 sample. In general, differences in scale factors could arise if different populations have different inclinations (e.g., Wu & Han, 2001; Jarvis & McLure, 2006), accretion rates (e.g., Collin et al., 2006), radiation pressure (Marconi et al., 2008), or some combination of factors. Secondly, measurement errors in either or could spuriously drive these objects to lie above the - relation. D07 note that underestimates of the velocity dispersion by 10% are expected because of quasar continuum dilution. We found that continuum dilution does not significantly affect our measurement by varying our inner extraction aperture to include more or less quasar continuum. The velocity dispersions resulting from these tests were not significantly different from the value derived using the optimal inner aperture. In addition, preliminary results show that the black hole mass in PG2130+099—one of the D07 quasars that lies above the - relation—may be overestimated by a factor of several, based on a new measurement of the reverberation time lag (Grier et al., in preparation). Thirdly, D07 show that small number statistics can at least partly account for the PG quasars’ location above the - relation.
Two final caveats should be considered. First, this quasar is an interacting system, with a companion at a nuclear separation of (4.4 kpc). We would therefore expect the velocity dispersion to be larger than predicted by the - relation, or opposite to its observed location. Additionally, CO and Ca II triplet velocity dispersions could give inconsistent results (see Dasyra et al. 2006b for a discussion of this in the context of ULIRGs and Silge & Gebhardt 2003 for a discussion in the context of early-type quiescent galaxies). If PG1426+015 has an atypically young stellar population in its nuclear region, as circumstantially suggested by the need for later-type spectral templates, these young stars may not trace the full velocity dispersion profile of the bulge and cause an underestimate of the true stellar velocity dispersion.
4. Summary
We obtained H-band observations of PG1426+015 using the NIFS IFU on Gemini North and the newly commissioned ALTAIR LGS AO system. The combination of using an IFU and LGS AO provides a unique tool for studying the hosts of luminous quasars. This is demonstrated by the very high SNR spectrum of the quasar host galaxy presented in this work as well as our precise measurement of the stellar velocity dispersion. We measure the stellar velocity dispersion of PG1426+015 to be .
Our measured velocity dispersion and the Peterson et al. (2004) black hole mass from reverberation mapping places this quasar significantly above the - relation for local, quiescent galaxies. We have explored a number of reasons why PG1426+015 might lie above the - relationship. We can determine which of these reasons is correct by measuring velocity dispersions for the remainder of the reverberation-mapped PG quasars. It would also be valuable to reinvestigate the black hole masses of these objects and determine if there are any systematic differences between Ca II and CO velocity dispersion measurements. When these objectives have been completed, we will be able to determine if these higher-luminosity quasars lie on the - relation and if the scale factor, , is a function of luminosity. Ultimately we hope to include the higher-luminosity sample in the calculation of such that future black hole masses calculated using this factor will be more reliable.
References
- Bentz et al. (2006) Bentz, M. C., et al. 2006, ApJ, 651, 775
- Bentz et al. (2007) Bentz, M. C., et al. 2007, ApJ, 662, 205
- Blandford & McKee (1982) Blandford, R. D., & McKee, C. F. 1982, ApJ, 255, 419
- Boccas et al. (2006) Boccas, M., et al. 2006, SPIE, 6272, 114
- Cappellari & Emsellem (2004) Cappellari, M. & Emsellem, E. 2004, PASP, 116, 138
- Collin et al. (2006) Collin, S., Kawaguchi, T., Peterson, B. M., & Vestergaard, M. 2006, A&A, 456, 75
- Dasyra et al. (2006a) Dasyra, K. M., et al. 2006a, ApJ, 638, 745
- Dasyra et al. (2006b) Dasyra, K. M., et al. 2006b, ApJ, 651, 835
- Dasyra et al. (2007) Dasyra, K. M., et al. 2007, ApJ, 657, 102 (D07)
- Denney et al. (2006) Denney, K. D., et al. 2006, ApJ, 653, 152
- Elvis et al. (1994) Elvis, M., et al. 1994, ApJS, 95, 1
- Ferrarese & Ford (2005) Ferrarese, L., & Ford, H. 2005, Space Sci. Rev., 116, 523
- Ferrarese & Merritt (2000) Ferrarese, L. & Merritt, D. 2000, ApJ, 539, L9
- Ferrarese et al. (2001) Ferrarese, L., Pogge, R. W., Peterson, B. M., Merritt, D., Wandel, A., & Joseph, C. L. 2001, ApJ, 555, L79
- Gebhardt et al. (2000a) Gebhardt, K., et al. 2000a, ApJ, 539, L13
- Gebhardt et al. (2000b) Gebhardt, K., et al. 2000b, ApJ, 543, L5
- Genzel et al. (2001) Genzel, R., Tacconi, L. J., Rigopoulou, D., Lutz, D., & Tecza, M. 2001, 563, 527
- Graham et al. (2001) Graham, A. W., Erwin, P., Caon, N., & Trujillo, I. 2001, ApJ, 563, L11
- Hring & Rix (2004) Hring, N., & Rix, H.-W. 2004, ApJ, 604, L89
- Herriot et al. (2000) Herriot, G., et al. 2000, SPIE, 4007, 115
- Jarvis & McLure (2006) Jarvis, M. J., & McLure, R. J. 2006, MNRAS, 369, 182
- Jrgensen et al. (1995) Jrgensen, I., Franx, M., & Kjrgaard, P. 1995, MNRAS, 276, 1341
- Kormendy & Richstone (1995) Kormendy, J., & Richstone, D. 1995, ARA&A, 33, 581
- Marconi et al. (2008) Marconi, A., Axon, D. J., Maiolino, R., Nagao, T., Pastorini, G., Pietrini, P., Robinson, A., & Torricelli, G. 2008, ApJ, 678, 693
- Marconi & Hunt (2003) Marconi, A., & Hunt, L. K. 2003, ApJ, 589, L21
- McGill et al. (2008) McGill, K. L., Woo, J.-H., Treu, T., & Malkan, M. A. 2008, ApJ, 673, 703
- McGregor et al. (2002) McGregor, P., et al. 2002, SPIE, 4841, 178
- Moorwood et al. (1998) Moorwood, A. F. M., et al. 1998, Messenger, 94, 7
- Nelson et al. (2004) Nelson, C. H., Green, R. F., Bower, G., Gebhardt, K., & Weistrop, D. 2004, ApJ, 615, 652
- Onken et al. (2004) Onken, C. A., Ferrarese, L., Merritt, D., Peterson, B. M., Pogge, R. W., Vestergaard, M., & Wandel, A. 2004, ApJ, 615, 645 (O04)
- Peng et al. (2002) Peng, C. Y., Ho, L. C., Impey, C. D., & Rix, H.-W. 2002, ApJ, 124, 266
- Peterson (1993) Peterson, B. M. 1993, PASP, 105, 247
- Peterson et al. (2004) Peterson, B. M., et al. 2004, ApJ, 613, 682
- Silge & Gebhardt (2003) Silge, J. D., & Gebhardt, K. 2003, ApJ, 125, 2809
- Tremaine et al. (2002) Tremaine, S., et al. 2002, ApJ, 574, 740
- Vacca et al. (2003) Vacca, W. D., Cushing, M.C, & Rayner, J. T. 2003, PASP, 115,389
- Wright et al. (1994) Wright, E. L., Eisenhardt, P., & Fazio, G. 1994, BAAS, 184(2503)
- Wu & Han (2001) Wu, X.-B., & Han, J. L. 2001, ApJ, 561, L59