We report the study of , , , and
, near the peak of the
resonance. The results are based on a
data sample of 21.7 fb-1 collected with the Belle detector at
the KEKB collider.
Attributing the signals to the resonance,
the partial widths
MeV and
MeV
are obtained from the observed cross sections.
These values exceed by more than two orders of magnitude
the previously measured partial widths for dipion transitions between lower resonances.
1 Introduction
The dipion transitions between or levels below the open
flavor thresholds have been successfully
described in terms of QCD multipole moments .
The measurements of
are consistent with this picture .
However, The spectroscopy above open flavor threshold is complex,
The recent discovery of a broad state, the ,
decaying with an unexpectedly large partial width to
, has brought new challenges to the interpretation of its composition,
with “hybrid” (where
is a gluon) and (where is a color-octet light quark
pair) four quark state as possibilities. The observation of
a bottomonium counterpart to , which we shall
refer to as , could shed further light on the structure
of such particles. The expected mass is above the .
It has been suggested that a with lower mass can be
searched for by radiative return from the , and one
with higher mass through an anomalous rate of
events ; scaling from , one expects
to have branching fraction .
In our studies, the rates for and
are found to be much larger than the expectations from scaling the
comparable decays to the .
Since only one center-of-mass (CM) energy is
used, one does not know whether
these enhancements are an effect of
the itself, or due to a nearby or overlapping state.
Throughout this proceeding, we use the notation instead of
.
2 The Analysis
This study is described in details in the reference .
The and
final states are reconstructed using
decays.
Events with exactly four well-constrained charged tracks
and zero net charge are selected.
Two muons with opposite charge are selected to
form a candidate.
The two remaining tracks are treated as pion or kaon candidates. To
suppress the background from with photon conversion, pion candidates with
positive electron identification are rejected.
The cosine of the
opening angle between the and ( and )
momenta in the laboratory frame is required to be less than 0.95.
The trigger efficiency is found to be very
close to 100% for these final states.
To reject (radiative) Bhabha and -pair backgrounds, the data are
required to satisfy either , or 2 GeV GeV, where is the
maximum opening angle between any charged tracks in the CM frame,
and is the sum of the calorimeter energy.
The signal candidates are identified using the kinematic variable
, defined as the difference between
or and
for pion or kaon modes. Sharp peaks are expected at
for . For
and
, signal events should be concentrated at , since a single CM energy is
used.
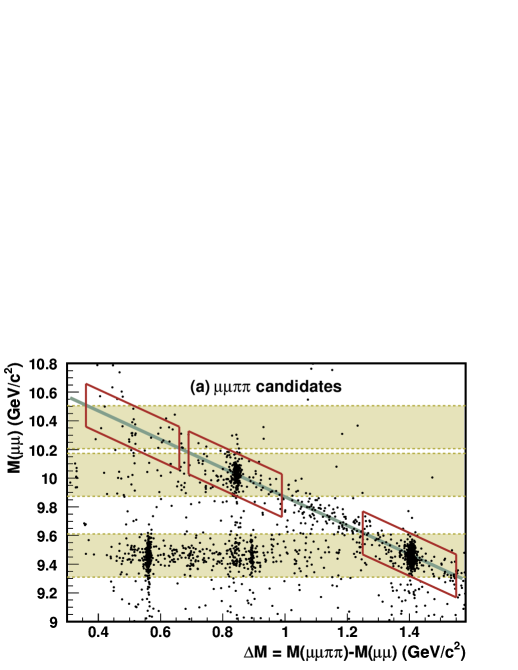
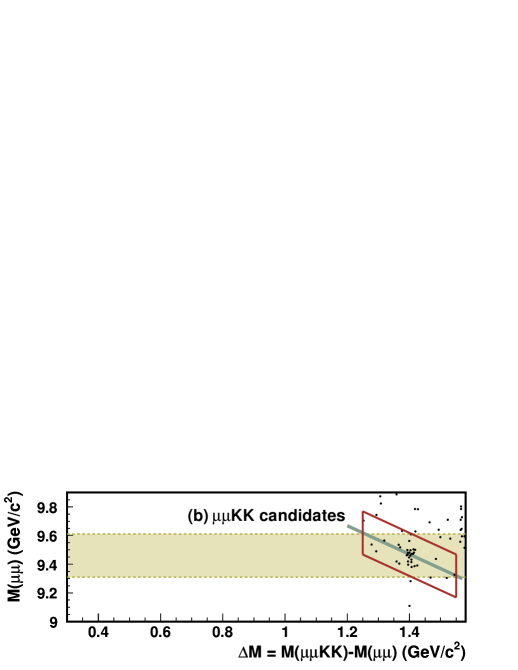
Figure 1: Scatter plot of vs.
for the data collected at GeV, for
(a) and (b) candidates.
Horizontal shaded bands correspond to ,
and (only for (b)),
and open boxes are the fitting regions for
and
. The lines indicate the kinematic boundaries,
.
Figure 1 shows the
two-dimensional scatter plot of vs. for
the data. Clear enhancements are observed, especially for
and
decays.
The dominant background processes, and
accumulate at the kinematic boundary, .
The events with MeV
or MeV are selected. The
fitting regions are defined by 1.25 GeV/ 1.55
GeV/, 0.69 GeV/ 0.99 GeV/, and 0.36
GeV/ 0.66 GeV/ for
,
, and ,
respectively. The fitting region in for
is the same as for the
mode.
The oblique fitting regions
are selected so that the background shape is monotonic along each band.
The background distributions are verified
using the off-resonance sample (recorded at GeV) .
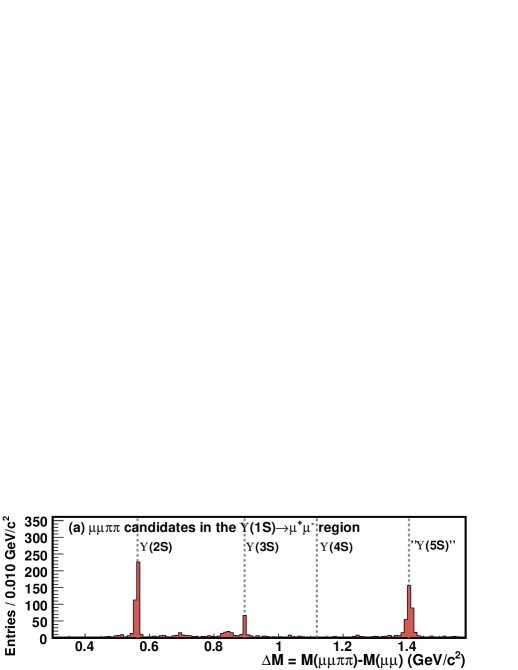
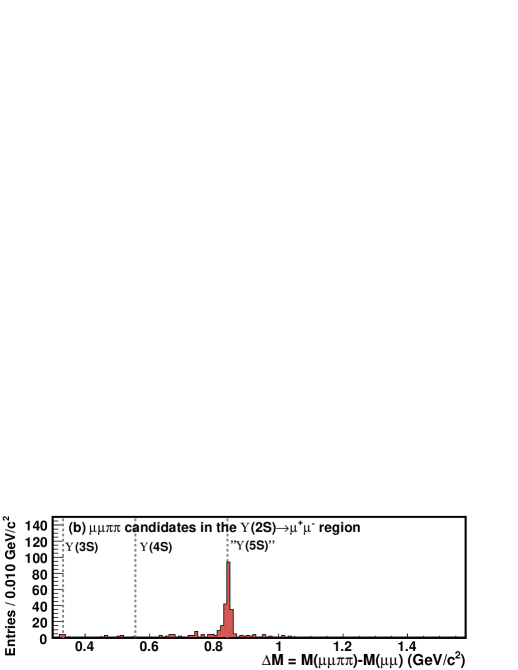
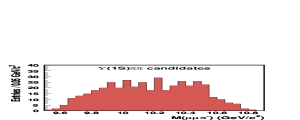
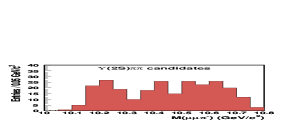
The
distributions for the candidates in the
and mass bands are shown
in Fig. 2. The peaks for
and
are located at GeV/ and GeV/, respectively. Two other peaks at
GeV/ and GeV/ correspond
to and
transitions, respectively.
The absence of a peak around 1.12 GeV/ corresponding to
is consistent with
the rates measured in references .
The structure just below
in the distribution
is from the cascade decays
with .
Figure 2: The distributions for
events in the (a) and (b)
bands of Fig. 1(a).
Vertical dashed lines show the expected values for
the transitions.
Signal yields are extracted by unbinned extended maximum likelihood (ML) fits to
the distributions.
The signal is described by a sum of two Gaussians
while the background is approximated by a linear function.
For the and
modes, the remaining PDF parameters
and yields of signal and background are floated in the fits.
For the and
transitions, where statistics are limited,
the means and widths are established based on
events and
fixed in the fits.
We observe , , ,
and events in the
,
, , and
channels, with significances of 20,
14, 3.2, and 4.9, respectively.
The significance
is calculated using the difference in likelihood values of the
best fit and of a null signal hypothesis including the effect of systematic uncertainties.
The Gaussian widths of the and
peaks are found to be MeV/ and MeV/, respectively,
and are consistent with the MC predictions.
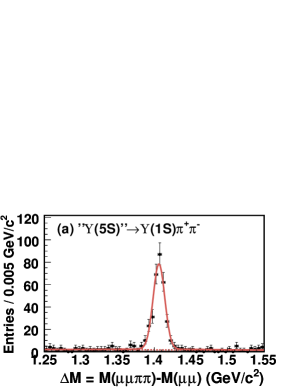
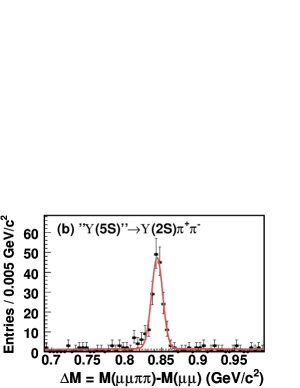
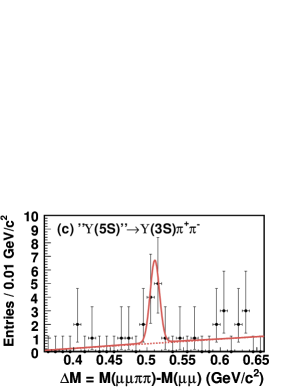
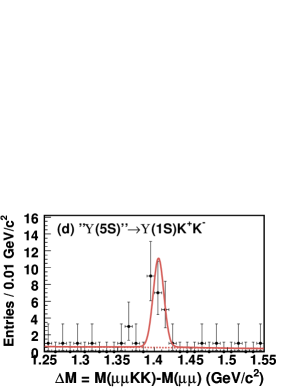
The distributions of with the fit results
superimposed are shown in Fig. 3.
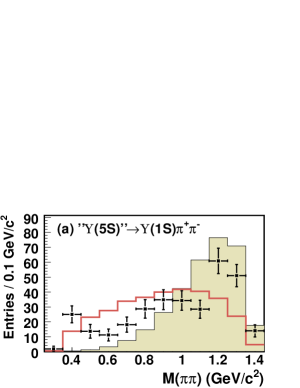
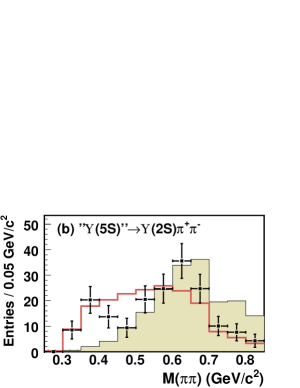
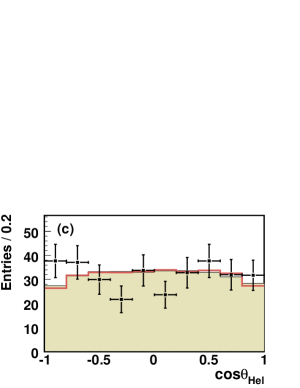
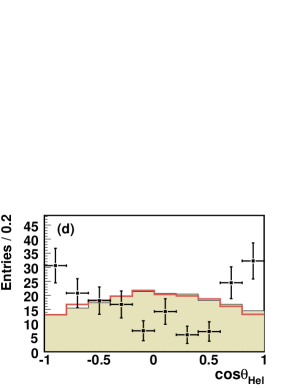
The yields for ,
are found to be large; thus, the
corresponding invariant masses of the system,
, and the cosine of the helicity angle,
, can be examined in detail. The helicity angle,
, is the angle between the and
momenta in the rest frame.
Figure 4 shows the yields as
functions of and , which
are extracted using ML fits to in bins of
or .
The shaded histograms in the figure are
the distributions from MC simulations using the
model in the paper , while the open histograms
show a generic phase space model.
As neither model agrees well with the observed distributions
and the efficiencies are sensitive to both variables,
the reconstruction
efficiencies for and
are obtained using MC
samples reweighted according to the measured and
spectra.
Comparison of the distribution obtained here
with other () decays
could be important for the theoretical interpretation of the results .
Assuming that signal events come only from the
resonance, the corresponding branching fractions and partial
widths can be extracted using ratios to the
cross section at GeV,
nb .
The results, including the observed cross sections, are given in
Table 1. The values include the world average
branching fractions for decays, and the total width of
the . The measured partial widths, of order
– MeV, are large compared to all other known
transitions among states.
Figure 3: The distributions for
(a) ,
(b) ,
(c) , and
(d) with the fit results superimposed.
The dashed curves show the background components in the fits.
Figure 4: The yields as functions of
and for (a,c) and
(b,d) transitions.
The shaded (open) histogram
are from MC simulations using the model based on QCD multi-pole expansions
(phase space model).
Table 1: Signal yield (), significance (),
reconstruction efficiency, and observed cross section ()
for and
at GeV. Assuming the to be the
sole source of the observed events, the branching fractions
() and the partial widths () for
and
are also given. The first uncertainty is statistical, and the
second is systematic.
Process
Eff.(%)
(pb)
(%)
(MeV)
20
14
3.2
4.9
3 Summary
In conclusion, we report the observation of and transitions, and the
evidence of and
transitions at a CM energy near the resonance of
GeV. Clear signals are observed at the expected
CM energy, with subsequent
decay.
The measured cross sections are
pb, pb, pb, and
pb for
,
, , and
transitions, respectively.
The first uncertainty is statistical, and the
second is systematic.
Assuming the observed signal events are due solely to the
resonance, branching fractions are measured to be
in the range (0.48–0.78)% for channels, and 0.061% for the channel.
The corresponding
partial widths are found to be in the range (0.52–0.85) MeV for
, and 0.067 MeV for the
mode, more than two orders of magnitude
larger than the corresponding partial widths for
, or decays.
The unexpectedly large partial widths disagree with the
expectation for a pure state, unless there is a new
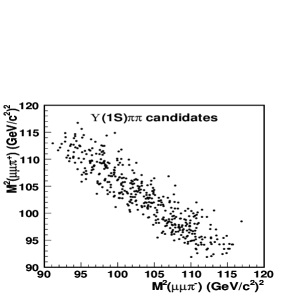
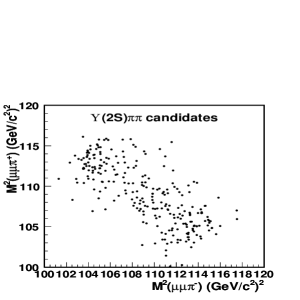
mechanism to enhance the decay rate, such as the existance of an intermediate resonant state .
Such possibility can be examined with the Dalitz plots.
As shown in Fig. 5, there is no clear structure observed for the signal candidates.
A detailed energy scan within
the energy region had been carried out at the end of 2007.
It would help to extract the resonant
spectrum, and a comparison between the yield of
events and the total hadronic
cross section may help us to understand the nature of such
signal.
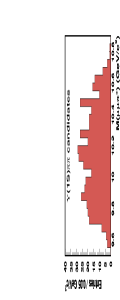
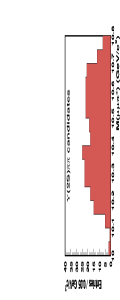
Figure 5: The Dalitz plots, and the corresponding mass projections for and
candidates in the signal region.
Acknowledgments
We thank the KEKB group for excellent operation of the
accelerator, the KEK cryogenics group for efficient solenoid
operations, and the KEK computer group and
the NII for valuable computing and Super-SINET network
support. We acknowledge support from MEXT and JSPS (Japan);
ARC and DEST (Australia); NSFC (China);
DST (India); MOEHRD, KOSEF, KRF and SBS Foundation (Korea);
KBN (Poland); MES and RFAAE (Russia); ARRS (Slovenia); SNSF (Switzerland);
NSC and MOE (Taiwan); and DOE (USA).
References
References
[1]
L. S. Brown and R. N. Cahn,
Phys. Rev. Lett. 35, 1 (1975);
M. B. Voloshin,
JETP Lett. 21, 347 (1975);
Y. P. Kuang and T. M. Yan,
Phys. Rev. D 24, 2874 (1981).
[2]
F. Butler et al. [CLEO Collaboration],
Phys. Rev. D 49, 40 (1994);
D. Cronin-Hennessy et al. [CLEO Collaboration],
Phys. Rev. D 76, 072001 (2007).
[3]
B. Aubert et al. [BaBar Collaboration],
Phys. Rev. Lett. 96, 232001 (2006).
[4]
A. Sokolov et al. [Belle Collaboration],
Phys. Rev. D 75, 071103 (2007).
[5]
Yu. A. Simonov,
JETP Lett. 87, 147 (2008).
[6]
B. Aubert et al. [BaBar Collaboration],
Phys. Rev. Lett. 95, 142001 (2005).
[7]
W. S. Hou,
Phys. Rev. D 74, 017504 (2006).
[8]
K. F. Chen et al. [Belle Collaboration],
Phys. Rev. Lett. 100, 112001 (2008).
[9] W.-M. Yao et al., J. Phys. G 33, 1 (2006).
[10]
A. Drutskoy et al. [Belle Collaboration],
Phys. Rev. Lett. 98, 052001 (2007).
[11]
M. Karliner and H. J. Lipkin,
arXiv:0802.0649 [hep-ph].