How to grow a bubble:
A model of myopic adapting agents
Appendix
Abstract
We present a simple agent-based model to study the development of a bubble and the consequential crash and investigate how their proximate triggering factor might relate to their fundamental mechanism, and vice versa. Our agents invest according to their opinion on future price movements, which is based on three sources of information, (i) public information, i.e. news, (ii) information from their “friendship” network and (iii) private information. Our bounded rational agents continuously adapt their trading strategy to the current market regime by weighting each of these sources of information in their trading decision according to its recent predicting performance. We find that bubbles originate from a random lucky streak of positive news, which, due to a feedback mechanism of these news on the agents’ strategies develop into a transient collective herding regime. After this self-amplified exuberance, the price has reached an unsustainable high value, being corrected by a crash, which brings the price even below its fundamental value. These ingredients provide a simple mechanism for the excess volatility documented in financial markets. Paradoxically, it is the attempt for investors to adapt to the current market regime which leads to a dramatic amplification of the price volatility. A positive feedback loop is created by the two dominating mechanisms (adaptation and imitation) which, by reinforcing each other, result in bubbles and crashes. The model offers a simple reconciliation of the two opposite (herding versus fundamental) proposals for the origin of crashes within a single framework and justifies the existence of two populations in the distribution of returns, exemplifying the concept that crashes are qualitatively different from the rest of the price moves.
keywords:
stock market, crash, bubble, herding, adaptation, agent-based modelChair of Entrepreneurial Risks
Department of Management, Technology and Economics
ETH Zurich, CH-8001 Zurich, Switzerland
1 Introduction
Bubbles and crashes in financial markets are events that are fascinating to academics and practitioners alike. According to the consecrated academic view that markets are efficient, bubbles, being temporally persistent, self-reenforcement deviations of the price from the fundamental value, are impossible. And crashes should only result from the revelation of a dramatic piece of information. Yet in reality, there is a large consensus both from professionals (Dudley, 2010; Trichet, 2010) and academia (Shiller, 2000; Abreu and Brunnermeier, 2003) that bubbles do exist, and even the most thorough post-mortem analyses are typically inconclusive as to what piece of information might have triggered the observed crash (Barro et al., 1989).
It is often observed that crashes occur soon after a long run-up of prices, referred to as a bubble. A crash is thus often the burst of the bubble. There is a vast amount of literature aiming at characterizing the underlying origin(s) and mechanism(s) of financial bubbles (Abreu and Brunnermeier, 2003; Kaufman, 2001; Sheffrin, 2005; Shiller, 2000; Sornette, 2003a) but there is still no consensus in the academic community on what is really a bubble and what are its characteristic properties. Bubbles do not seem to be fully explained by bounded rationality (Levine and Zajac, 2007), speculation (Lei et al., 2001) or the uncertainty in the market (Smith et al., 1988). Finally, there is no really satisfactory theory of bubbles, which both encompasses its different possible mechanisms and adheres to reasonable economic principles (no arbitrage, equilibrium, bounded rationality, …).
Most approaches to explain crashes search for possible mechanism or effects that operate at very short time scales (hours, days, or weeks at most). Other mechanisms concentrate on learning an exogenously given crash rate (Sandroni, 1998). Here, we build on the radically different hypothesis summarized in (Sornette, 2003a) that the underlying cause of the crash should be found in the preceding months and years, in the progressively increasing build-up of a characteristic that we refer to as ‘market cooperation’, which expresses the growth of the correlation between investors’ decisions leading to stronger effective interactions between them as a result of several positive feedback mechanisms. According to this point of view, the proximal triggering factor for price collapse should be clearly distinguished from the fundamental factor. A crash occurs because the market has entered an unstable phase toward the culmination of a bubble and any small disturbance or process may reveal the existence of the instability. Think of a ruler held up vertically on your finger: this very unstable position will lead eventually to its collapse, as a result of a small (or an absence of adequate) motion of your hand or due to any tiny whiff of air. This is the proximal cause of the collapse. But the fundamental cause should be attributed to the intrinsically unstable position.
What is then the origin of the maturing instability? Many studies have suggested that bubbles result from the over-optimistic expectation of future earnings and history provides a significant number of examples of bubbles driven by such unrealistic expectations (Kindleberger and Aliber, 2005; Sheffrin, 2005; Sornette, 2003a). These studies and many others show that bubbles are initially nucleated at times of burgeoning economic fundamentals in so-called “new economy” climates. This vocable refers to new opportunities and/or new technological innovations. But, because there are large uncertainties concerning present values of the economies that will result from the present innovations, investors are more prone to influences from their peers (Hong et al., 2005), the media, and other channels that combine to build a self-reflexive climate of (over-)optimism (Umpleby, 2007). In particular, these interactions may lead to significant imitation, herding and collective behaviors. Herding due to technical as well as behavioral mechanisms creates positive feedback mechanisms, which lead to self-organized cooperation and the development of possible instabilities or to the “building of castles in the air”, to paraphrase Malkiel (Malkiel, 1990). This idea is probably best exemplified in the context of the Internet bubble culminating in 2000 or the recent the CDO bubble in the USA peaking in 2007, where the new economies where the Internet or complex derivatives on sub-prime mortgages building on accelerating real-estate valuations.
Based on these ideas, the present paper adds to the literature by providing a detailed analysis of how the proximate triggering factor of a crash might relate to its fundamental mechanism in terms of a global cooperative herding mechanism. In particular, we rationalize the finding of Cutler et al. (1989) that exogenous news are responsible for no more than a third of the variance of the returns and that major financial crises are not preceded by any particular dramatic news.
In a nutshell, our multi-period many agent-based model is designed as follows. At each time step , each investor forms an opinion on the next-period value of a single stock traded on the market. This opinion is shaped by weighting and combining three sources of information available at time : (i) public information, i.e. news, (ii) information from their “friendship” network, promoting imitation and (iii) private information. In addition, we assume that the agents adapt their strategy, i.e., the relative importance of these different sources of information according to how well they performed in the past in predicting the next-time step valuation.
The a priori sensible qualities of our agents to gather all possible information and adapt to the recent past turn out to backfire. As their decisions are aggregated in the market, their collective impact leads to the nucleation of transient phases of herding with positive feedbacks. These nucleations occur as a result of random occurrences of short runs of same signed news. Our main findings can thus be summarized as follows: rallies and crashes occur due to random lucky or unlucky streaks of news that are amplified by the feedback of the news on the agents’ strategies into collective transient herding regimes. In addition to providing a convincing mechanism for bubbles and crashes, our model also provides a simple explanation for the excess volatility puzzle (Shiller, 1981).
Before presenting the model and its results, it is useful to compare it with the relevant literature and related models. A related line of research aims at developing a theory of “convention” (Orléan, 1984, 1986, 1989a, 1989b, 1991, 1995), which emphasizes that even the concept of “fundamental value” may be a convention established by positive and negative feedbacks in a social system. A first notable implementation by Topol (1991) proposes a model with an additive learning process between an ‘agent-efficient’ price dynamics and a mimetic contagion dynamics. Similar to our own set-up, the agents of Topol (1991) adjust their bid-ask prices by combining the information from the other buyers’ bid prices, the other sellers’ ask prices and the agent’s own efficient price corresponding to his knowledge of the economic fundamentals. Topol (1991) shows that mimetic contagion provides a mechanism for excess volatility. Another implementation of the concept of convention by Wyart and Bouchaud (2007) shows that agents who use strategies based on the past correlations between some news and returns may actually produce by their trading decisions the very correlation that they postulated, even when there is no a priori economic basis for such correlation. The fact that agents trade on the basis of how the information forecasts the return is reminiscent of our model, with however several important differences. The first important conceptual change is that Wyart and Bouchaud (2007) use a representative agent approach (in contrast with our heterogeneous agent framework), so that effect of imitation through the social network is neglected. The second difference is in the agent’s calculation of the correlation to adapt their strategies. In (Wyart and Bouchaud, 2007), agents’ strategies are controlled by the correlation between the news and the return resulting immediately from their aggregate action based on those news (taking into account the agents’ own impact). Our agents’ strategies are determined by the correlation between their information and the return one time step later, which embodies the more realistic situation, in which a postion first has to be open and then closed a time step later for the trade’s payoff to be observed.
Another closely related line of research is known as “information cascades”. According to (Bikhchandani et al., 1992), “an informational cascade occurs when it is optimal for an individual having observed the action of those ahead of him, to follow the behavior of the preceding individual without regard to his own information”. In these models, agents know that they have only limited information and use their neighbors actions in order to complement their information set. Bikhchandani et al. (1992) showed that the fact that agents use the decisions of other agents to make their own decision will lead with probability to an informational cascade under conditions where the decisions are sequential and irreversible. This model was later generalized by Orléan (1995) into a non-sequential version, where informational cascades were still found to be possible.
The concept of information cascades is not new in modeling bubbles. Chari and Kehoe (2003) developed a model where agents try to compensate their uncertainty about the a priori fixed payoff of an asset by observing all other agents’ actions. In our model, agents are also using the opinions of their neighbors to determine how to act but the reason behind this is different. Our agents are not so much interested in the fundamental value of the stock, but more in its future directions. They try to buy the asset before its price rises and sell before it falls, making profit from the difference in the price. The true underlying equilibrium value is not the only important information to them, and they are more clever than purely fundamental value investors. They recognize that fundamental value is just one component among others that will set the market price. They include the possibility that the price may deviate from fundamental value, due to other behavioral factors. And they try to learn and adapt to determine what are the dominant factors. In principle, they should be able to discover the fundamental value and converge to its equilibrium. But it is a fact that they do not in some circumstances, due to the amplification of runs of positive or negative news in the presence of their collective behavior when sufficiently strong. In the “information cascade” set-up, one assume that the “truth” exists, that there is a true fundamental price or a correct choice to be made which is exogenously given, and agents have no influence on the outcome. In our model however the outcome, whether selling or buying a stock was the right choice, is endogenously emerging from the aggregated choices of all agents. There is no a priori right or wrong answer, it is decided during the process. Moreover, the strength of the influence of her neighbors onto a given agent is not constant in time. This influence by the social environment evolves in time according to its past relevance and success.
A model for the formation of a boom followed by a crash was also developed by Veldkamp (2005), where the price of an unknown company can rise only slowly due to infrequent news coverage. If the company performs well resulting in a slow boom, its susceptibility towards news increases as the media become more aware of the successful company so that, eventually, a single piece of bad news can induce a sudden crash. Although the subject of research is the same, we show how a boom can also be formed with news not being constantly positive and that a single piece of bad news does not necessarily lead to the burst a bubble.
The endogenization of the sources of information onto the decisions of the agents is inspired by the model of Zhou and Sornette (2007), which focuses on herding and on the role of “irrational” mis-attribution of price moves to generate most of the stylized facts observed in financial time series. Similarly to their model as well as many other artificial financial market models investigating the interaction between trading agents, our model is based on the Ising model, one of the simplest models describing the competition between the ordering force of imitation or contagion and the disordering impact of private information or idiosyncratic noise that promotes heterogeneous decisions (McCoy and Wu, 1973).
Our paper is organized into four sections. In Section 2, the detailed working of the model is presented. The results are shown and discussed in section 3 and section 4 concludes.
2 The model
2.1 General set-up
We consider a fixed universe of agents who are trading (buying or selling) a single asset, which can be seen as a stock, the market portfolio or any other exchange traded asset. This asset is traded on an organized market, coordinated by a market maker. At each time step, agents have the possibility to either trade or to remain passive. The trading decision of a given agent is based on her opinion on the future price development.
To form their opinion, agents use information from three different sources: idiosyncratic opinion, global news and their network of acquaintances. In order to adapt their decision making process to the current market situation, they are weighting the different information sources by their respective past predicting performance. Limited to these sources of information, our agents act rationally, i.e., they use all information available to them to maximize their profits. Since they use backward looking adapting strategies with finite time horizons, our agents are boundedly rational, with limited competence, resources and available time.
A limitation of the model is to assume that agents do not have access to more liquidity than their initial wealth and that generated by their investments. Moreover, our universe has a fixed population, so that there is no flux of new “foreign” investors that may be attracted in the later stage of a bubble, and who could inflate it up further (Sornette and Zhou, 2004; Zhou and Sornette, 2006, 2008). We thus purposefully remove one of the mechanisms, namely the increasing credit availability and credit creation (Caginalp et al., 2001), which has often been reported as an important ingredient to inflate historical bubbles (Galbraith, 1997; Sornette, 2003b; Kindleberger and Aliber, 2005). This allows us to focus on the role of decision processes with conflicting pieces of information in the presence of local adaptation.
2.2 Three sources of information
At every time step, agents form anticipations concerning the future price movements based on three sources information.
A first source of information of a given agent is her private information, , which may reflect the unique access to information not available publicly or the idiosyncratic, subjective view of the particular agent on how the stock will perform in the future. The private information is different for every agent, is taken uncorrelated across agents and time: the innovations are normally distributed ( and i.i.d.
A second source is the public information, . Public information includes economic, financial and geopolitical news that may influence the future economic performance of the stock. To capture the idea that the public news, , is fully informational with no redundancy (Chaitin, 1987), we take as a white Gaussian noise with unit variance, uncorrelated with the private information of the agents. Although news are generated as a stationary process, we will see that their impact on the agents evolves because of the adaptive nature of the agents’ strategies.
The third source of information for a given agent is provided by the expected decisions of other agents to whom she is connected in her social and professional network. With limited access to information and finite computing power (bounded rationality), it can be shown to be optimal to imitate others (Orléan, 1986; Roehner and Sornette, 2000). Moreover, there is clear empirical evidence that practitioners do imitate their colleagues (Hong et al., 2005). In our model, agents gather information on the opinions of their neighbors in their social network and incorporate it as an ingredient into their trading decision.
Incorporating agent interaction in the opinion formation process leads to dynamics described by models derived from the Ising model. Many earlier works have already borrowed concepts from the theory of the Ising models and of phase transitions to model social interactions and organization, e.g. (Follmer, 1974; Callen and Shapero, 1974; Montroll and Badger, 1974). In particular, Orléan (Orléan, 1984, 1986, 1989a, 1989b, 1991, 1995) has captured the paradox of combining rational and imitative behavior under the name “mimetic rationality,” by developing models of mimetic contagion of investors in the stock markets which are based on irreversible processes of opinion forming.
2.3 Opinion formation
Using the three sources of information described in the previous section, the opinion of agent at time , , consists of their weighted sum,
| (1) |
where represents the private information of agent , is the public information, is the number of neighbors that agent polls for their opinion and is the expected action of the neighbor estimated by agent at time 111We use a sequential updating mechanism with a random ordering. In this way, when agent polls her neighbors, she has a mix of opinions coming from those who have already updated theirs and those have not yet. This procedure can be thought of as a device to account for the large distribution of reactions times of humans (Vazquez et al., 2006; Crane et al., 2010).. The functional form of expression (1) embodies our hypothesis that an agent forms her opinion based on a combination of different sources of information. This is a standard assumption in the social interaction literature (Bischi et al., 2006; Brock and Durlauf, 2001) and decision making theory (see for instance (Körding, 2006)).
To take into account the heterogeneity in trading style and preferences of traders, we assume that each agent is characterized by a triplet of fixed traits, in the form of the weights she attributes to each of the three pieces of information (social network, news and idiosyncratic). The values for each agent are chosen randomly from three uniform distributions over the respective intervals , and , at the initialization of the system. In section 2.4, we will extend this heterogeneity by allowing for different risk aversions.
In order to adapt to the recent market regime, each agent can modify the weights she attributes to the information from each of her neighbor , via the factor , and to the public news, via the factor . The factors ’s and are updated such as to give more weight to an information source if it was a good predictor in the recent past, and to decrease its influence in the inverse case (more details in sec. 2.7). The idiosyncratic term is not weighted and has a constant impact on agents actions.
Finally, for simplicity, our agents live on a virtual square lattice with neighbors, with periodic boundary conditions. The reported results are not sensitive to this topology, and hold for random as well as complete graphs.
2.4 Trading decision
Until now, we have introduced heterogeneity between agents through their three personal traits (, for ), unique to each agent, on how they combine information to form their opinion. Another important well-documented heterogeneity is that different people have different risk aversions. We capture this trait by assuming that each agent is characterized by a fixed threshold , controlling the triggering of an investment action, given her opinion level . An agent decides to go long (buy a stock) if her conviction is sufficiently positive so as to reach the threshold: . Reversely, she decides to go short (sell a stock) if . Thus, we assume symmetric levels of conviction in order for a trade to occur either on the buy or sell sides. The parameter captures one dimension of the agent’s risk aversion: how much certitude she needs to break her hesitation and move into the market. The larger her threshold , the larger certitude about future price movements the agent requires in order to start trading. Each agent is characterized by a different , drawn randomly from a uniform distribution in the interval .
As previously discussed in section 2.1, our agents are liquidity constrained. The portfolio of an agent at time is the sum of her cash and of the number of the single asset that is traded in our artificial market. When an agent decides to buy, she uses a fixed fraction of her cash. When an agent decides to sell, she sells the same fixed fraction of the value of her stocks. The fact that is much smaller than ensures time diversification. Our main results do not change significantly as long as does not approach . Our agents are not allowed to borrow, because they can only buy a new stock, when they have the cash. Reciprocally, we impose short-sell constraints, in the sense that an agent can only sell a stock she owns. Thus, our model is related to the literature investigating the role of short-sale constraints (Miller, 1977; Chen et al., 2002; Ofek and Richardson, 2003).
These rules can be summarized in terms of the
direction of the trading decision and the volume (in units of
number of stock shares) of the agent :
- if
:
=
(buying)
=
- if
:
=
(selling)
=
,
where is the price of the asset at time .
When an agent is buying assets, her order volume is determined by her available
cash and by the stock share price at the previous time step
(the main results remain unchanged if agents would use the expected instead).
Our agents are submitting market orders, such that
the price to pay to realize an order is the
new price determined by the market maker. This new price
is determined by the price clearing mechanism that aggregates the excess demand after all the
traders have submitted theirs decisions.
2.5 Price clearing condition
Once all the agents have decided on their orders, the new price of the asset is determined by the following equations:
| (2) | |||||
| (3) |
where represents the relative impact of the excess demand upon the price, i.e. the market depth. Similar to (Beja and Goldman, 1980; Wyart and Bouchaud, 2007), we neglect all higher order contributions in expression (2) and use a linear market impact function, as a rough approximation at time scales significantly larger than the tick-per-tick time scales for which nonlinear impact functions are observed (Plerou et al., 2002).
Expressions (2) and (3) can be interpreted in two ways. One is that the trading is performed through a market maker, disposing of an unlimited amount of cash and stocks. Agents submit all their market orders to the market maker, who, after adapting the price to the excess demand, executes all the agents’ trades. Because the market maker adapts the price before he executes the trades, he has a competitive advantage and gets on average a significant positive return for his service.
An alternative interpretation is that the trading style of our agents is midterm to longterm trading, excluding high-frequency traders like hedge-funds and such. Once our agents have absorbed their information and taken a trading decision, the price has already changed due to faster agents using similar trading information.
2.6 Cash and stock positions
2.7 Adaptation
As described above, agents have pre-existing heterogeneous beliefs on the reliability of the three different sources of information, quantified by their three traits . In addition, we assume that agents adapt their belief concerning the credibility of the news and their trust in the advice of their social contacts, according to time-dependent weights and , which take into account their recent past performance. Specifically, an agent estimates the value of a source of information by the correlation between the source’s prediction and the realized return. For their strategy to be adapted to the current market regime, agents prioritize recent data in their calibration of the correlation. This prioritization of recent data is supported, first, by behavioral findings stating that individuals tend to overweight recent information and underweight prior data, second, by practitioners, who calibrate their trading strategies with recent data. The implementation of this prioritization is achieved by a standard auto-regressive update:
| (6) | |||||
| (7) |
Choosing and with 222 is in fact , with and . , the correct prediction of the sign of the realized stock return from a given information source tends to reinforce the trust in that source of information, all the more so, the larger the return (scaled by its volatility ) and the larger the strength of the signal. The time scale sets the memory duration over which past performance continues to impact the adaptive trust coefficients and . The update of and via eq. (6) and (7) is performed at every time step.
3 Results of the model
3.1 General properties
Our model is an idealized “test tube” representation of a financial market and given the simplifications put into the model, we do not aim at reproducing faithful statistical characteristics of realistic price dynamics. Our objective is to obtain an understanding of how the interplay of news, herding and private information can lead to the formation of bubbles and crashes. We first point out a few properties of the model, that derive straightforwardly from our set-up.
Because we model a closed system, with no new influx of money or stocks after the initial endowment of and , there cannot be any money/wealth creation in the long run333Strictly speaking, the model suffers however from a slight money destruction due to the price setting mechanism with the market maker in which the log(price) change is linear in the excess demand. But the number of purchased stocks depends on the real price (=exp(log(price))). Therefore, a rapid increase followed by a slow decrease of the price decreases the total wealth of the system, by the concavity of the logarithmic function. This effect is essentially negligible.. As a consequence, the price trajectory has an upper and lower bound444The upper bound is reached once agents have exhausted all their cash. The lower bound is then the agents are all in cash.. The constraints on cash and stocks tend to push the price back to its initial value, , such that the price performs a mean-reverting random walk555The increments of the walk are however not distributed according to a normal law, but to a distribution with fatter tails (c.f. figure 1) due to the adaptive strategies of the agents. around its initial value, which will be refereed to in the following as the equilibrium price.
The adaptive process of our agents essentially consists in looking for persistent sources of information, which impact on the returns. In more detail: for a trade to be profitable, an agent has to first acquire a number of asset (at time ), then its value has then to increase in the following time step, explaining the offset of one time step between the information source and the realized return in eq. (6) and (7). The return is however influenced by the information sources at time , and not by those at time , on which agents based their prediction of . This means that, for an information source to have some real predicting power, it must have some persistence (c.f. Appendix for a more detailed explanation of this mechanism).
3.2 First results
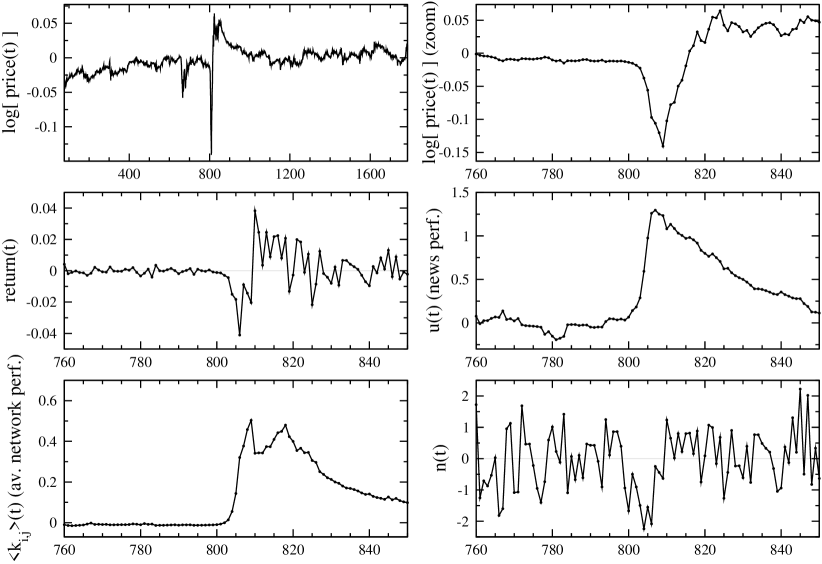
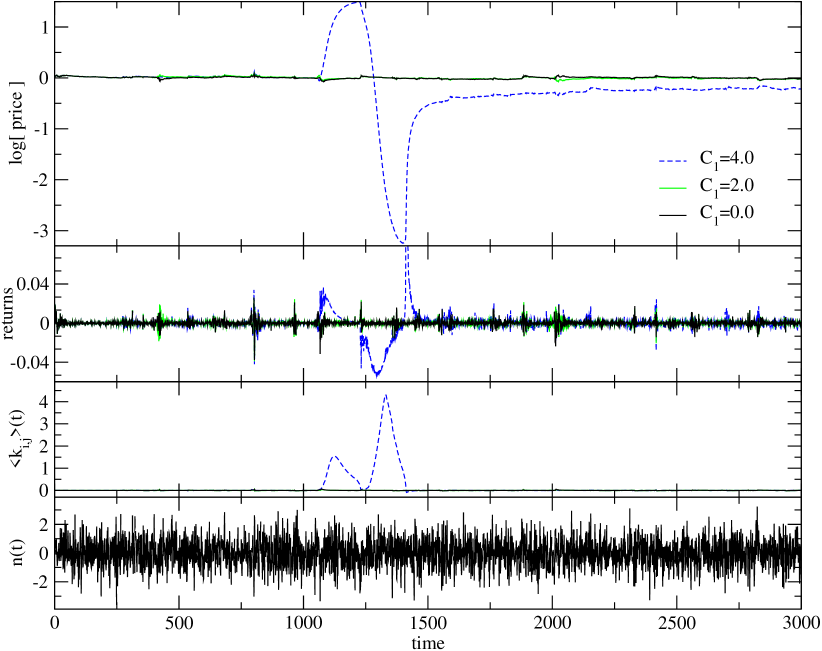
In our simulations, we fix the number of agents in the system to , the market depth to , the maximal individual conviction threshold to , the fraction of their cash or stocks that investors trade per action to , the initial amount of cash and stocks held by each agent to and , and the memory discount factor to , corresponding to a characteristic time of time steps. The news are modeled by i.i.d. Gaussian noise. Setting , figure 1 shows a typical realization of the time evolution of the log-price , the one-time-step return , the prediction performance of the news, and the ensemble average of the prediction performance of the neighbors, . The middle right panel shows the distribution of returns with clear evidence of a non-Gaussian fat tail structure. The lower right panel shows the absence of correlation between returns together with the presence of non-negligible correlation of the volatility (here measured as the absolute value of the returns), which confirms the clear evidence of clustered volatility in the time series of one-time-step returns.
While the perceived predicting power of the news, , fluctuates around its mean value of , it should be noted that it exhibits significant non-zero values, indicating that agents sometimes give a lot of importance to the news. If the agents were fully aware of the i.i.d. properties of the news, they would not use them666Recall that the return is influenced by the news at time on which agents based their prediction of , and not by those at time . Because the news have no true persistence, they can not have true predictive power.. But because of the adaptive nature of their strategy to the current market regime, agents do not use the complete price and news time series to update their trust into the news, but only recent data points777The weight of a data point in the update of decreases exponentially with increasing age with a time scale .. Due to the use of a finite data set, the i.i.d. news may occasionally show persistence888Our agents do not have a PhD in Econometrics and they do not perform proper statistical tests of their hypotheses., leeding to an increase of as consequence. The statistical fluctuations associated with the random patterns that are always presents in genuine noise is misinterpreted by the agents as genuine predictability. It is the local optimization, that makes the agents see causality, where there is only randomness (Taleb, 2008).
The lower left panel of figure 1 shows the average propensity to imitate, which also fluctuates around . But, the amplitude of these fluctuations is much reduced compared to those of . This is because each agent updates individually her propensity to imitate her neighbors according to (7), so that the statistical average is performed over the whole heterogenous population of agents, compared with no average for which is common knowledge to all agents.
The crucial parameters of our model are the parameters , which control the level of heterogeneity and the a priori preference for the three different types of information. Changing these parameters changes the way the agents behave in ways that we now explore systematically.
3.3 -dependence
Each agent is endowed with a fixed individual preference level, , controlling how much she takes into account the information stemming from the actions of their neighbors. This level is different from agent to agent, and is drawn from a uniform distribution in the interval . Thus, the parameter sets the maximal and mean ( ) innate weight, that agents give to their social influences.
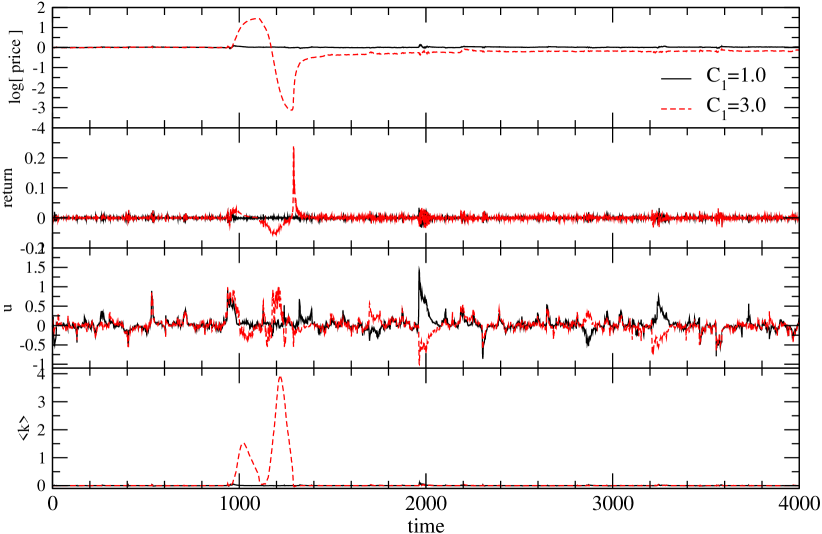
Figure 2, plots the evolution of several variables for three different values of , all other parameters, including the seed of the random number generator, remaining the same. For vanishing propensity to imitate (), some price spikes can be observed, which are generated by the news only, whose influence can be amplified by the positive feedback resulting from adaptation that tends to increase the relevance that investors attribute to news after a lucky run of news of the same signs. For , one can observe that these peaks are amplified due to the imitation now also contributing to the agents’ actions. For , a qualitatively different price evolution appears. For such large values of the maximal susceptibility to their social environment, the price is driven to its extremes, its dynamics being only slowed down by the agents’ finite cash and stock portfolio reaching their boundaries. We show below that this extreme behaviors results from a self-fulfilling prophecy, enabled through social interactions.
To better illustrate the effect of increasing , the third panel in figure 2 shows the average weight factor 999 used by the agents to assess the relevance of the information stemming from their neighbors. By increasing , agents are by definition more susceptible to their neighbors’ opinions, making them more likely to act in the same way if they show some predictive power. Consequently, since the price dynamics is governed by the aggregate demand, herding in opinions leads to persistent returns, creating the very returns agents hoped for, which reinforce the prediction power of their neighbors in a positive feedback loop. With and large, the opinions of the agents are completely shaped by their social component, while the news and their idiosyncratic term are essentially ignored. Due to this positive feedback loop, a small predictive success of some agents can trigger an avalanche of self-fulfilling prophecies, leading to price dynamics completely unrelated to the news and to large price deviations from the assets to its equilibrium value.
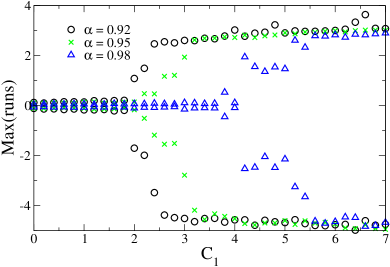
3.4 The existence of two regimes
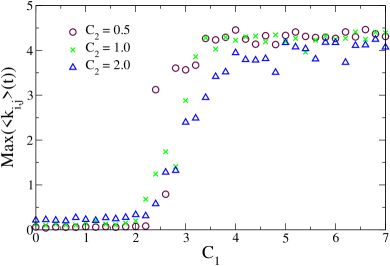
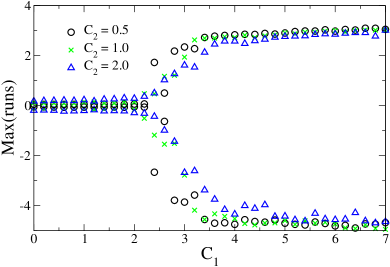
The existence of a bifurcation beyond which a new regime appears is documented in figure 3(left), where the maximum value of , averaged over many realizations and simulated with the same parameters , is plotted as a function of . One can observe a rather abrupt transition occurring at around . This transition is related to the phase transition of the Ising model, on which our model is based. Due to the presence of the adaption induced feedback loops, and with the dynamical character of , the precise nature of this transition can not be asserted. The existence of this change of regime explains the radical difference of properties shown in figure 2 for to . The jump in at is mirrored by a similar transition in the values of the maximal draw-downs (sum of consecutive negative returns) and draw-ups (sum of consecutive positive returns) as a function of in figure 3(right). For , a second regime is revealed where very large price moves occur. These market events are fundamentally different from the price fluctuations in the regime for . These large price changes are reminiscent of the “outliers” documented by Johansen and Sornette (1998, 2001) and Sornette (2003a), and recently extended into the concept of “dragon-kings” (Sornette, 2009).
3.4.1 The efficient regime
For , agents do not attribute sufficient importance to their neighbors in order to trigger the feedback loop that would lead to strong synchronized actions as occurs for large ’s. For small , the market is approximately efficient, in the sense that there is no autocorrelation of returns, as shown in figure 1, and the price fluctuates rather closely around its equilibrium value. While the major source of fluctuations are the news modeled as a Gaussian white noise process, the price fluctuations develop strong non-Gaussian features, as a result of the combined effect of the adaptive process that tends to amplify runs of same signed news and of the propensity to imitate that leads to small but non-negligible collective behaviors.
A first interesting conclusion can be drawn that our model provides a natural setting for rationalizing the excess volatility puzzle (Shiller, 1981), through the adaptive process of our agents. It could be argued that our setting is too simplified and unrealistic. But, how do real investors, traders, fund managers access the value their investment decisions? Necessarily by performing some kind of comparisons between the realized performance and some benchmarks, which can be a market portfolio, the results of competitors, the ex-ante expectations, all the above or others. The adaptive process used by our agents is arguably a simple and straightforward embodiment of the tendency for investors to adjust their strategies on the basis of past recent performance, here on how well the news predicted the market returns. Because measurements are noisy, the resulting estimation leads unavoidably to an amplification of the intrinsic variability of the news into a much strong variability of the prices, i.e., to the excess volatility effect. Somewhat paradoxically, it is the attempt of industrious investors to continuously adapt to the current market situation, which leads to the dramatic amplification of the price volatility. This may be thought of as another embodiment of the “illusion of control” effect, found in the Minority and the Parrondo games (Satinover and Sornette, 2007a, b, 2009), according to which sophisticated strategies are found to under-perform simple ones.
3.4.2 The excitable regime
A population of agents characterized by , represents the situation in which many agents know that their idiosyncratic information and the news are incomplete. In order to compensate for this lack of information, agents tend to imitate the actions of successful acquaintances. Under these conditions, the average propensity to imitate, , exhibits extreme values, resulting in large price deviations from the equilibrium price and periods of persistent returns, as shown in figure 2. In this regime, the market is in an excitable state. By imitating the opinions of recent winners who profited from some departure of the market price from its equilibrium value, our agents tend to amplify this anomaly, further strengthening the attraction of this strategy for other agents, eventually ending in a bubble and crash.
The triggering event responsible for the increasing weight that agents entrust to their neighbors’ opinions is nothing but the random occurrence of a sequence of same signed news. As explained in section 3.2, the weight of the news in their opinions is increased when the agents perceive a pattern of persistence in the news, which also induces persistent returns. Then, the agents reassess their belief and give more importance to the news. Because the pattern of persistence of the news is common knowledge, this tends to align the decisions and actions of the agents. As a consequence, their aggregate impact makes happen the very belief that initially led to their actions, thus increasing the prediction power of the agents’ opinions. As a whole, the agents see that the opinion of their friends is accurate, thus tending to increase their trust. This increase in the propensity to imitate can lead to a cascade of trading activity, resulting in the rise of a bubble, as described in details in the appendix. This scenario is a cartoon representation of the well-documented fact that many bubbles start initially with a change of economic fundamentals. Translated in our agent-based model, this change of economic fundamentals is nothing but the streak of same signed news that tells the story of an increasing market (for positive news). This small positive bias can be sufficient to nucleate a process that eventually blossom into a full-fledged bubble. The corresponding amplification of the news put the price on an unsustainable trajectory. This occurs especially when the system lives in the excitable state, in which the price can easily overshoot the values implied by the good/bad news.
Once such a cascade has begun and the best strategy is to follow the herd, agents are, in the case of a bubble, buying stocks at every time step and pushing the price up till they have no money left to further increase the price. At this point, their predicting power decreases due to they decreasing impact on the returns and the cascade ends. As financial bubbles feed on new money pouring in the market, the lack of new liquidity is a well-known factor of instability for financial bubbles (Kindleberger and Aliber, 2005; Hussam et al., 2008). Following this buying phase, the portfolio of agents consists mainly of stocks, biasing their actions towards selling. Now, some randomly occurring negative news are sufficient to trigger a reverse cascade, the crash, leading to an overshoot of the price below its equilibrium value. This scenario provides a clear distinction between the fundamental cause of the crash (the unstable high position of the price that has dried up all liquidity available) and the triggering proximal factor (a random occurrence of a sequence of negative news). In line with many observations, crashes in our model do not need a dramatic piece of negative information. Only a trickle can trigger a flood once the market as a whole has evolved into an unsustainable unstable position.
Due to the symmetry between buying and selling in our model, the price can, starting from its equilibrium value, depart in either direction, creating either a bubble (over-valuation of the asset over an extended period of time) or an negative bubble (under-valuation of the asset). This deviation will then be ended by either a crash (fast drop in price after a bubble) or a rally (fast appreciation after a negative bubble). In our analysis, we concentrate on the case of bubbles followed by a crash, because this is the more common scenario. The reason for this is twofold. First, in real markets, short-selling can occur, but is not equally available to all market players. The second reason has behavioral origins. In a bullish regime, people are progressively attracted to invest in financial markets, tending to push the price upward. Once invested, their attention is more focused on the financial markets. Fear and greed often lead to over-reactions and possible panics when the sentiments become negative, triggering herd selling which self-fulfills the very fears at their origin (Veldkamp, 2005).
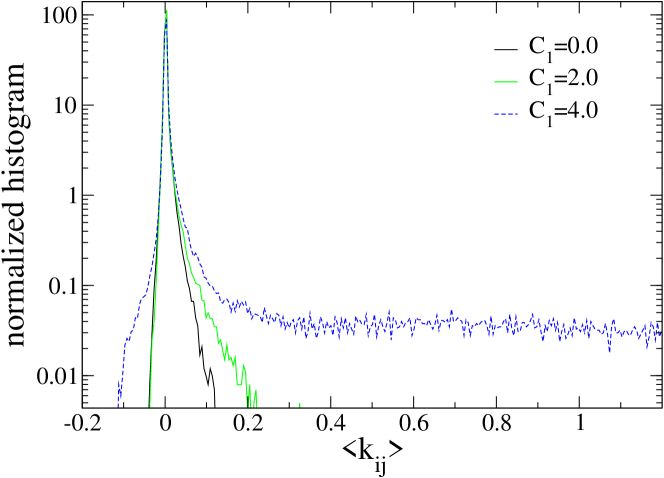
Another interesting characteristic of the herding regime occurring for is that it is very difficult to diagnose this regime from the properties of the price recorded outside those transient episodes of booms or crashes. Indeed, outside these special moments of “exuberance”, the market behaves as if in the regime . Bubbles and crashes do not belong to the normal regular dynamics of the model. They are only experienced when certain conditions are fulfilled, as explained above, that combine to create these transient instabilities. They can thus be considered as “outliers” in the sense of Johansen and Sornette (1998, 2001), or using a better more colorful terminology, they are “dragon-kings” (Sornette, 2009). The statistical analysis of the distribution of f confirms this claim. Figure 5 shows the appearance of an extremely fat tail in the distribution of over the ensemble of different realizations as a function of time for , while its bulk remains approximately identical to the distribution obtained for the smaller values of below the critical threshold . This confirms the existence of a class of transient regimes, the booms and crashes, which coexisting with the normal dynamics of the prices.
The hidden nature of the regime associated with and the random occurrence of triggering news lead to the prediction that advanced diagnostics of bubbles and crashes should lead to numerous false alarms. Consider the study of Kaminsky (1998), who has compiled a large list of indicators of financial crises, suggested by the fundamentalist literature on the period from 1970 to 1995 for 20 countries. Out of the 102 financial crises in her database, she finds that the specificity of the indicators is quite low: only of the ex-ante diagnostics coincided with a crisis, suggesting that fundamental reasons should be expanded by behavioural ones to explain the emergence of crises.
We thus come to our second important conclusion: the present model provides a simple mechanism for the existence of two populations in the distribution of prices, exemplifying the concept that booms and crashes are qualitatively different from the rest of the price moves. The second population of boom-crash (dragon-kings) appears when the innate propensity to herd reaches a threshold above which a self-reinforcing positive feedback loop starts to operate intermittently.
3.5 -dependence
Figures 3 displays the impact of , the a priori importance of the news, onto the transition from the efficient to the excitable regime. Both panels show that the more the agents trust the news, the stronger has to be for the system to become excitable. With increasing -values, we also observe that the transition becomes smoother and the maximum is decreased. This corresponds well to the intuition that, if traders are well informed and believe that the news correctly describe the economy, such drastic over- and under-valuations are less likely to happen and a higher level of panic is needed for a crash to happen.
3.6 -dependence
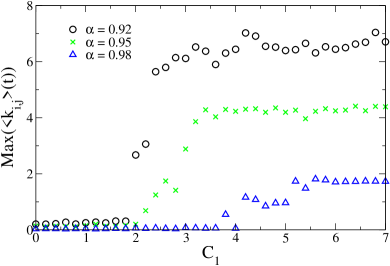
Although the presence of the -parameter is crucial, its specific value (within a certain range below ) has only a minor importance. Recall that sets the time-scale of the market regime, since it controls the length of the time series that is used to estimate the predicting power of the different information sources. The fact that , i.e. that agents’ strategies are designed to identify local market regimes is the reason that makes them possible in the first place. It is the local adaptation, which is the true origin of a bubble and a subsequent crash.
Figure 4 shows the impact of on the transition from the efficient to the excitable regime. The closer is to , the larger the critical for which the system becomes excitable. With a larger memory, the growth of the propensity to imitate is more limited because the agents see now much better the bigger picture and are less easily carried away by a temporal coordination of their neighbors. Changing leaves the maximal drawn-downs and -ups unchanged because, once an coordination of the agents starts, the only way to stop it is via the drying up of their cash/stock-reservoir.
3.7 Alternative clearing condition
We have played with variations of the implementations of the clearing conditions with different market maker’ strategies. For instance, when the market make is adapting the price after (rather than before) the exchange of assets with the agents, we find the same qualitative results and bubbles and crashes occur by the same mechanism. With such an price clearing condition however, news bear real predictive power, destroying the efficiency of the market.
In general, the present model is very robust with respect to changes in the different ingredients. As long as agents can interact and are locally optimizing their strategies, bubbles and crashes do appear.
4 Conclusion
In this paper, we have addressed two major questions:
-
-
Why do bubbles and crashes exist?
-
-
How to they emerge?
We approached these questions by constructing a model of bounded rational, locally optimizing agents, trading a single asset with a very parsimonious strategy. The actions of the agents are determined by their anticipation of the future price changes, which is based on three different sources of information: private information, public information (news) and information from their neighbors in their network of professional acquaintance. Given these information, they try to maximize their usefulness by constantly scanning the market and adjusting the weight of the different sources to their opinion by the recent predicting performance of these sources. In this way, they are always adapting their strategy to the current market regime, such that they can profit from an opportunity if it arises.
We find that two regimes appear, depending on how strong the agents are influenced by their neighbors (controlled by the parameter ). In the regime of small ’s, the low herding/efficient regime, agents are sometimes more influenced by the news and sometimes more by their neighbors, but due to the small level of trust they put into their neighbors by default, they do not get carried away in over-imitating their neighbors if the latter, for a short time interval, seem to be good predictors. The returns are mostly driven by the global and idiosyncratic news. The resulting market is approximately efficient, with the price not deviating much from its equilibrium value.
We find that the return distribution is however quite different from that describing the exogenous news. Our simple agents are able to transform the string of independent normally distributed news (both for the global and idiosyncratic news) into a return distribution with fatter than exponential tails, showing a clear sign of excess volatility. Also clustered volatility and a non-zero autocorrelation in the volatility of the returns are observed while the returns themselves remain uncorrelated, in agreement with absence of arbitrage opportunities (at least at the linear correlation level). These different properties show that our simple model can reproduce some important stylized facts of the stock market, and can motivate the possibility to test its prediction in other market regimes.
By increasing above a certain critical value, the system enters a second regime where the agents give on average more importance to their neighbors’ actions than to the other pieces of information. By increasing the awareness of their neighbors’ actions, agents are more likely to coordinate their actions, which increases the probability that the direction of the return results in the predicted direction, which then again increases their trust in these successful predicting neighbors. Due to this positive feedback loop, the average coefficients (the dynamic trust of agent in agent ) can surpass a critical value and the agents’ opinions are dominated by only this information term, resulting in series of consistently large same-signed returns. Because the agents are always trying to maximize their returns, it is rational for the agents to follow the majority and to “surf” the bubble or the crash. This regime is characterized by large deviations from the equilibrium price resulting from a coordination of the agents’ actions due to their local adaptation of their strategy to the mood of the market. Not only is it rational to follow the herd, we have also showed (in the appendix) that the agents who are early imitators of their successful neighbors in the early stage of a bubble/crash are those who will accumulate the largest wealth among all the agents after the market has returned to its normal regime.
We showed that the origin of these large deviations from the equilibrium price nucleate from the news. A random occurrence of a sequence of same signed news pushes the price in one direction and starts the coordination process of the agents. This situation is reminiscent from the mechanism for the initiation of real world bubbles, where an innovation leads to a period with a majority of positive news, which also move the market. Because the reason of the positive market move is an innovation, the agents are not entirely sure of its intrinsic value and seek advice from some of their professional collegues. If those colleagues tell them that they made large profits with this asset and they trust these colleagues, they will follow their advice, resulting in the same kind of behavior as produced by our model.
By following each other’s actions, the agents push the price up, beyond its equilibrium value, up to an unsustainable level. Once the hype has cooled of and the agents have invested all their cash into the stock, just a little push by negative news can cause the price to collapse, resulting in a crash, without any apparent reason.
By increasing the prior propensity to imitate to a high value, the average behavior and properties of the dynamics of the model is unchanged. Outside of these large price variations occurring during rare bubbles and crashes, the dynamics looks similar to that documented in the low regime, i.e., appears to function like an efficient market. Therefore, attempting to estimate the value of just from the normal price dynamics is essentially impossible. The occurrence of a bubble/crash is an event that has drastically different statistical characteristics than the normal price fluctuations, exemplifying the occurrence of “outliers” (or “dragon-kings”) that have been documented empirically for financial draw-downs (Johansen and Sornette, 1998, 2001; Sornette, 2003a).
Acknowledgments: We would like to thank Wei-Xing Zhou for invaluable discussions during the course of the project and Gilles Daniel and Ryan Woodard for a critical reading of the manuscript.
References
- Abreu and Brunnermeier (2003) Abreu, D., Brunnermeier, M. K., 2003. Bubbles and crashes. Econometrica 71 (1), 173–204.
- Barro et al. (1989) Barro, R., Fama, E., Fischel, D., Meltzer, A., Roll, R., Telser, L., 1989. Black monday and the future of financial markets. edited by R.W. Kamphuis, Jr., R.C. Kormendi and J.W.H. Watson, Mid American Institute for Public Policy Research, Inc. and Dow Jones-Irwin, Inc.
- Beja and Goldman (1980) Beja, A., Goldman, M. B., 1980. On the dynamic behavior of prices in disequilibrium. The Journal of Finance 35 (2), 235–248.
- Bikhchandani et al. (1992) Bikhchandani, S., Hirshleifer, D., Welch, I., 1992. A theory of fads, fashion, custom, and cultural change as informational cascades. The Journal of Political Economy 100 (5), 992–1026.
- Bischi et al. (2006) Bischi, G.-I., Gallegati, M., Gardini, L., Leombruni, R., Palestrini, A., 2006. Herd behavior and nonfundamental asset price fluctuations in financial markets. Macroeconomic Dynamics 10 (04), 502–528.
- Brock and Durlauf (2001) Brock, W. A., Durlauf, S. N., 2001. Discrete choice with social interactions. The Review of Economic Studies 68 (2), 235–260.
- Caginalp et al. (2001) Caginalp, G., Porter, D., Smith, V. L., 2001. Financial Bubbles: Excess Cash, Momentum, and Incomplete Information. The Journal of Psychology and Financial Markets 2(2), 80-99.
- Callen and Shapero (1974) Callen, E., Shapero, D., 1974. A theory of social imitation. Physics Today July, 23–28.
- Chaitin (1987) Chaitin, G. J., 1987. Algorithmic Information Theory, Cambridge Tracts in Theoretical Computer Science. Cambridge University Press.
- Chari and Kehoe (2003) Chari, V. V., Kehoe, P. J., December 2003. Hot money. Journal of Political Economy 111 (6), 1262–1292.
- Chen et al. (2002) Chen, J. S., Hong, H. G., Stein, J. C., 2002. Breadth of ownership and stock returns. Journal of Financial Economics 66, 171–205.
- Crane et al. (2010) Crane, R., Schweitzer, F., Sornette, D., 2010. New power law signature of media exposure in human response waiting time distributions. Physical Review E 81, 056101.
- Cutler et al. (1989) Cutler, D. M., Poterba, J. M., Summers, L. H., July 1989. What moves stock prices? Tech. Rep. 2538, National Bureau of Economic Research.
- Dudley (2010) Dudley, W. C., 2010. Asset bubbles and the implications for central bank policy. Speech by Mr William C Dudley, President and Chief Executive Officer of the Federal Reserve Bank of New York, at the Economic Club of New York, New York City, 7 April 2010, 1–0.
- Follmer (1974) Follmer, H., March 1974. Random economies with many interacting agents. Journal of Mathematical Economics 1 (1), 51–62.
- Galbraith (1997) Galbraith, J., 1997. The great crash, 1929. Boston : Houghton Mifflin Co.
- Hong et al. (2005) Hong, H., Kubik, J. D., Stein, J. C., December 2005. Thy neighbor’s portfolio: Word-of-mouth effects in the holdings and trades of money managers. Journal of Finance 60 (6), 2801–2824.
- Hussam et al. (2008) Hussam, R. N., Porter, D., Smith, V., 2008. Thar she blows: Can bubbles be rekindled with experienced subjects? American Economic Review 98 (3), 924–937.
- Johansen and Sornette (1998) Johansen, A., Sornette, D., February 1998. Stock market crashes are outliers. European Physical Journal B 1 (2), 141–143.
- Johansen and Sornette (2001) Johansen, A., Sornette, D., 2001. Large stock market price drawdowns are outliers. Journal of Risk 4(2), 69–110.
- Kaminsky (1998) Kaminsky, G., December 1998. Currency and banking crises: The early warnings of distress. Social Science Research Network Working Paper Series.
- Kaufman (2001) Kaufman, G. G., 2001. Asset Price Bubbles: Implications Monetary and Regulatory Policies (Research in Financial Services: Private and Public Policy). JAI Press.
- Kindleberger and Aliber (2005) Kindleberger, C. P., Aliber, R., October 2005. Manias, Panics, and Crashes: A History of Financial Crises (Wiley Investment Classics), 5th Edition. Wiley.
- Körding (2006) Körding, K., 2006. Decision theory: What “should” the nervous system do? Science 318, 606–610.
- Lei et al. (2001) Lei, V., Noussair, C. N., Plott, C. R., 2001. Nonspeculative bubbles in experimental asset markets: Lack of common knowledge of rationality vs. actual irrationality. Econometrica 69 (4), 831–859.
- Levine and Zajac (2007) Levine, S. S., Zajac, E. J., 2007. The Institutional Nature of Price Bubbles. SSRN eLibrary.
- Malkiel (1990) Malkiel, B. G., 1990. A random walk down Wall Street. WW Norton & Company, New York.
- McCoy and Wu (1973) McCoy, B. M., Wu, T. T., 1973. The Two-Dimensional Ising Model. Harvard University, Cambridge, Mass.
- Miller (1977) Miller, E. M., 1977. Risk, uncertainty, and divergence of opinion. The Journal of Finance 32 (4), 1151–1168.
- Montroll and Badger (1974) Montroll, E. W., Badger, W. W., 1974. Introduction to Quantitative Aspects of Social Phenomena. Gordon & Breach Science Pub.
- Ofek and Richardson (2003) Ofek, E., Richardson, M., 2003. Dotcom mania: The rise and fall of internet stock prices. Journal of Finance 48, 1113–1137.
- Orléan (1984) Orléan, A., 1984. Mimétisme et anticipations rationnelles: une perspective keynesienne. Recherches Economiques de Louvain 52, 45–66.
- Orléan (1986) Orléan, A., 1986. L’auto-référence dans la théorie keynesienne de la spéculation. Cahiers d’Economie Politique, 14–15.
- Orléan (1989a) Orléan, A., 1989a. Comportements mimétiques et diversité des opinions sur les marchés financiers. Chap. III, in Théorie économique et crises des marchés financiers, Bourguinat, H. and Artus, P., editors (Economica, Paris), 45–65.
- Orléan (1989b) Orléan, A., 1989b. Mimetic contagion and speculative bubbles. Theory and Decision 27, 63–93.
- Orléan (1991) Orléan, A., 1991. Disorder in the stock market (in french). La Recherche 22, 668–672.
- Orléan (1995) Orléan, A., 1995. Bayesian interactions and collective dynamics of opinion - herd behavior and mimetic contagion. Journal of Economic Behavior & Organization 28, 257–274.
- Plerou et al. (2002) Plerou, V., Gopikrishnan, P., Gabaix, X., Stanley, H. E., Aug 2002. Quantifying stock-price response to demand fluctuations. Physical Review E 66 (2), 027104+.
- Roehner and Sornette (2000) Roehner, B. M., Sornette, D., 2000. “thermometers” of speculative frenzy. European Physical Journal B 16, 729.
- Sandroni (1998) Sandroni, A., September 1998. Learning, rare events, and recurrent market crashes in frictionless economies without intrinsic uncertainty. Journal of Economic Theory 82 (1), 1–18.
- Satinover and Sornette (2007a) Satinover, J. B., Sornette, D., December 2007a. Illusion of control in a Brownian game. Physica A 386, 339–344.
- Satinover and Sornette (2007b) Satinover, J. B., Sornette, D., December 2007b. “Illusion of control” in Time-Horizon Minority and Parrondo Games. European Physical Journal B 60, 369–384.
- Satinover and Sornette (2009) Satinover, J. B., Sornette, D., 2009. Illusory versus genuine control in agent-based games. European Physical Journal B 67, 357–367.
- Sheffrin (2005) Sheffrin, H., 2005. A Behavioral Approach to Asset Pricing. Academic Press.
- Shiller (1981) Shiller, R. J., 1981. Do stock prices move too much to be justified by subsequent changes in dividends? The American Economic Review 71 (3), 421–436.
- Shiller (2000) Shiller, R. J., 2000. Irrational Exuberance. Princeton University Press, New York.
- Smith et al. (1988) Smith, V. L., Suchanek, G. L., Williams, A. W., 1988. Bubbles, crashes, and endogenous expectations in experimental spot asset markets. Econometrica 56 (5), 1119–1151.
- Sornette (2003a) Sornette, D., 2003a. Why Stock Markets Crash. Princeton University Press. Princeton, NJ.
- Sornette (2003b) Sornette, D., 2003b. Why Stock Markets Crash, Chapter 3. Princeton University Press. Princeton, NJ.
- Sornette (2009) Sornette, D., 2009. Dragon-kings, black swans and the prediction of crises. International Journal of Terraspace Science and Engineering 2 (1), 1–18.
- Sornette and Zhou (2004) Sornette, D., Zhou, W.-X., 2004. Evidence of Fueling of the 2000 New Economy Bubble by Foreign Capital Inflow: Implications for the Future of the US Economy and its Stock Market. Physica A 332, 412–440.
- Taleb (2008) Taleb, N. N., October 2008. Fooled by Randomness: The Hidden Role of Chance in Life and in the Markets, 2nd Edition. Random House.
- Topol (1991) Topol, R., 1991. Bubbles and volatility of stock prices: Effect of mimetic contagion. The Economic Journal 101 (407), 786–800.
- Trichet (2010) Trichet, J.-C., 2010. What can central banks do in a financial crisis? Speech by Mr Jean-Claude Trichet, President of the European Central Bank, on the occasion of the Susan Bies Lecture, Kellogg Distinguished Lecture Series, Evanston, Illinois, 27 April 2010, 1–12.
- Umpleby (2007) Umpleby, S., 2007. Reflexivity in social systems: The theories of george soros. Systems Research and Behavioral Science 24 (24), 515–522.
- Vazquez et al. (2006) Vazquez, A., J., Oliveira, G., Dezso, Z., Goh, K. I., Kondor, I., , Barabasi, A. L., 2006. Modeling bursts and heavy tails in human dynamics. Physical Review E 73, 036127.
- Veldkamp (2005) Veldkamp, L., October 2005. Slow boom, sudden crash. Journal of Economic Theory 124 (2), 230–257.
- Wyart and Bouchaud (2007) Wyart, M., Bouchaud, J.-P., May 2007. Self-referential behaviour, overreaction and conventions in financial markets. Journal of Economic Behavior & Organization 63 (1), 1–24.
- Zhou and Sornette (2006) Zhou, W.-X., Sornette, D., 2006. Is there a real-estate bubble in the us? Physica A 361, 297–308.
- Zhou and Sornette (2007) Zhou, W.-X., Sornette, D., 2007. Self-fulfilling ising model of financial markets. European Physical Journal B 55, 175–181.
- Zhou and Sornette (2008) Zhou, W.-X., Sornette, D., 2008. Analysis of the real estate market in las vegas: Bubble, seasonal patterns, and prediction of the csw indexes. Physica A 387, 243–260.
Appendix A Detailed analysis of the emergence of a bubble
To clarify the mechanisms leading to the dynamics of the here presented model, we now illustrate some details on the micro-scale dynamics of the model. First we will go step-by-step through an occurrence of increased volatility, shown in figure 6, with the system being in the efficient regime and explain in detail the relationships between the different variables.
Second, we will investigate the emergence of a bubble in the excitable regime and compare it to the dynamics resulting from the same stream of news in the efficient regime in figure 7 and 8.
A.1 Step-by-step description of the dynamics in the efficient regime
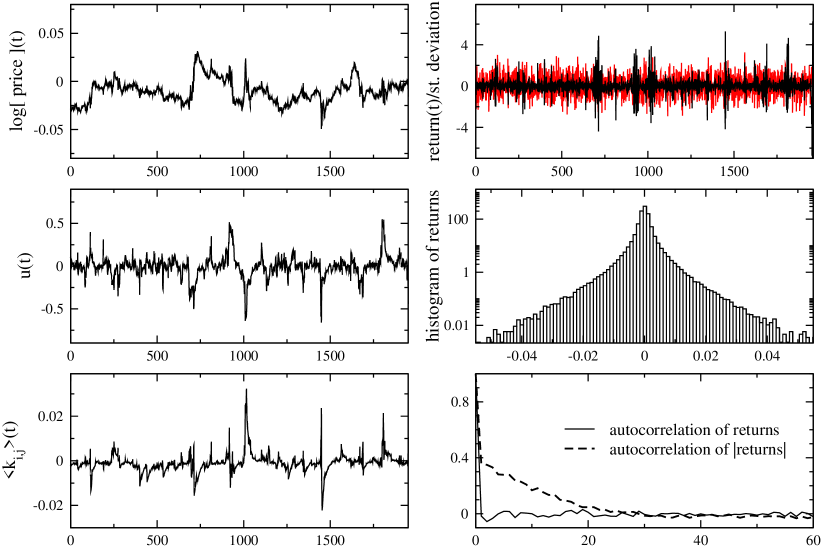
Figure 6 displays the dynamics of the key variables around the time , where the price suddenly, crashes, rebounds and then slowly relaxes to its pre-existing level. An increase of , the news’ performance and , the average weight used by the agents to assess the relevance of the information stemming from their neighbors, is occurring at the same time.
The origin of this burst can be traced back to the random occurrence of a sequence of same signed news, shown in the lower right panel of figure 6. Recall that we assume that the news are independently and identically distributed. Thus the dip structure in the news’ realization is purely “bad luck”, i.e. a stream of small bad news impact the market. The response of the agents to these run of bad news develops as follows. The observation of the news gives the agents an information about the next return ), but in order to profit from this insight, the agents have to act before , i.e. they use to buy or sell at time . Therefore, a burst of activity, which has its origin in the news, can only occur if the sign of the news is, by chance, the same for several time steps as it is the case from to .
Let us report minutely the micro dynamics of the model to better understand this burst of activity. At , the news turns out to be negative, which suggests to the agents that the price may drop from to . To prevent their portfolio from losing in value from time to , some agents reduce their exposure to the market and sell a fraction of their assets at . If enough agents listen to the news, as it is in this case, this selling will result in a negative return from to . Then at , the news is, by chance, again negative resulting again in a negative return from to . This negative return confirms the negative news from , leading agents to increase , the weight they attribute to the news.
The exponential growth of the weight continues as long as the sequence of negative news goes on, further amplifying the impact of the news on the agents’ decision and therefore on the price. Note that the average weight of the propensity to imitate also exhibits a fast acceleration. This is due to the fact that the agents find that imitation is also a good predictor of the returns, since a majority of agents are following the news and are trading into the same direction. By this process, there is an amplification of the response of the whole herd to the exogenous news. When the run of bad news stops, it takes about times steps for to relax back to its previous value. In this example, the maximum of occurs at . At , decreases lightly due to the small amplitude of the news at . Once has reached a certain level, the news completely dominates agents opinion and thus also determines the returns.
At , the sequence of negative news is terminated by positive news, resulting in a large positive return due to the large value of . Furthermore, as the news at predicted a negative return at , the predictive power of the news seems to have decreased, having a a decrease of as consequence. Now that the news resumes its usual random switching signs and it is no longer a good predictor of the return, decreases exponentially.
This case study illustrates that the occurrence of bursts of price variations is nothing but the amplification of runs of same-sign news, which leads to an exponential growth of the news weighting factor , which itself increases dramatically the sensitivity of the agents to all future news. This heightened sensitivity lasts over a characteristic scale determined by the coefficient governing the memory of the adaptation process (eq. 7). The process of agents’ adaptation to the news and information from their neighbors, together with the random lucky or unlucky occurrence of runs of news of the same quality, is at the origin of the occurrence of this period of increase volatility.
A.2 Efficient regime vs excitable regime
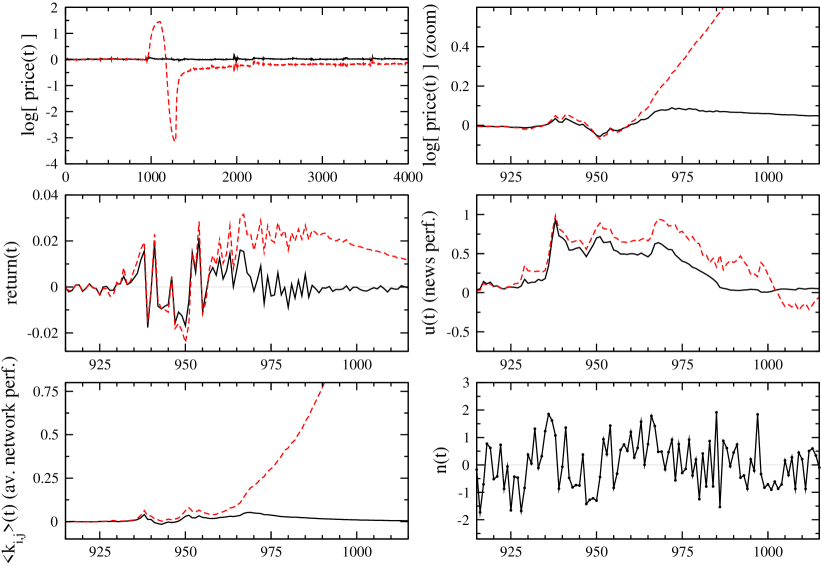
In figure 7, we plot the detailed dynamics during the nucleation of a bubble. The black continuous lines display the evolution of several variables with the system being in the efficient regime, i.e. . The red dashed lines represent the same variables, with all parameters unchanged (including random seed), except that agents susceptibility to their neighbors’ actions is increased () such that the system is in the excitable regime. Figure 7 shows the detailed nucleation of the bubble, whereas figure 8 shows the dynamics on a larger time scale.
In the second panel on the left in figure 7, we plot the evolution of the return and witness a burst of volatility starting around . The origin of this volatility can be attributed to a random occurrence of some ‘persistence’ in the news , as explained in the previous section. This persistence increases the news’ prediction power and, because all agents are subject to the same news, agents’ actions tend to synchronize, inducing an increase of the prediction power of their neighbors, .
Up to , the dynamics of the system in the efficient regime only deviates marginally from those of the excitable regime. After , their differences become apparent. In the excitable regime, where the neighbors’ influence is a stronger factor in the opinion formation, the long string of positive news from to is able to increase the average interaction weight up to a level high enough, such that the opinion of the agents, and therefore also their actions, are dominated by their neighbors’. As a consequence, the price continues to increase even after the positive news sequence has ended. In the efficient regime, on the other hand, the volatility of the returns, and return to their normal values after the ‘luck streak’ of positive news.
In the excitable regime, as a consequence of the strong propensity to interact , once a price rally or a crash is started, the dominating impact of the herd both in the adaption process and in the price impact makes the price trend self-reinforcing and basically independent of the sign of the news. This explains the very large amplitude of the price deviation compared with the price in the efficient regime in figure 7 and 8.