Stellar Populations of Bulges in 14 Cluster Disc Galaxies††thanks: Based on observations made with ESO Telescopes at the La Silla observatory under programmes 70.B-0486 and 71.B-0202.
Abstract
Photometry and long-slit spectroscopy are presented for 14 S0 and spiral galaxies of the Fornax, Eridanus and Pegasus cluster, and NGC 7582 group. The structural parameters of the galaxies are derived from the band images by performing a two-dimensional photometric decomposition of the surface-brightness distribution. This is assumed to be the sum of the contribution of a bulge and disc component characterized by elliptical and concentric isophotes with constant (but possibly different) ellipticity and position angles. The rotation curves and velocity dispersion profiles are measured from the spectra obtained along the major axis of galaxies. The radial profiles of the , Mg, and Fe line-strength indices are presented too. Correlations between the central values of Mg 2, , , and are found. The age, metallicity and Fe enhancement of the stellar population in the center and at the radius where bulge and disc give the same contribution to the total surface brightness are obtained using stellar population models with variable element abundance ratios. Three classes of bulges are identified. The youngest bulges ( Gyr) with ongoing star formation, intermediate-age bulges (4–8 Gyr) have solar metallicity, and old bulges ( Gyr) have high metallicity. Most of the sample bulges display solar Fe enhancement, no gradient in age, and a negative gradient of metallicity. The presence of negative gradient in the metallicity radial profile favors a scenario with bulge formation via dissipative collapse. This implies strong inside-out formation that should give rise to a negative gradient in the /Fe enhancement too. But, no gradient is measured in the [] radial profiles for all the galaxies, except for NGC 1366. In this galaxy there is a kinematically-decoupled component, which is younger than the rest of host bulge. It possibly formed by enriched material probably acquired via interaction or minor merging. The bulge of NGC 1292 is the most reliable pseudobulge of our sample. The properties of its stellar population are consistent with a slow buildup within a scenario of secular evolution.
keywords:
galaxies : abundances – galaxies : bulges – galaxies : evolution – galaxies : stellar content – galaxies : formation – galaxies : Kinematics and Dynamics1 Introduction
The relative importance of the dissipative collapse (Eggen et al., 1962; Sandage, 1990; Gilmore & Wyse, 1998), major and minor merging events (Kauffmann, 1996; Cole et al., 2000; Aguerri et al., 2001), and redistribution of disc material due to the presence of a bar or environmental effects (Kormendy & Kennicutt, 2004) drives the variety of properties observed in bulges.
The bulges of lenticulars and early-type spirals are similar to low-luminosity elliptical galaxies. Their photometric and kinematic properties satisfy the same fundamental plane correlation (FP) found for ellipticals (Bender et al., 1992, 1993; Burstein et al., 1997; Aguerri et al., 2005). The surface-brightness radial profile of big bulges is well described by the de Vaucouleurs law (Andredakis et al., 1995; Carollo et al., 1998; Möllenhoff & Heidt, 2001) even if this could drastically change by taking into account the small-scale inner structures smoothed by the seeing in the ground-base observations (Balcells et al., 2003). Some of them are rotationally-flattened oblate spheroids with little or no anisotropy (Kormendy & Illingworth, 1982; Davies & Illingworth, 1983; Cappellari et al., 2006). But, the intrinsic shape of a large fraction of early-type bulges is triaxial, as shown by the isophotal twisting (Lindblad, 1956; Zaritsky & Lo, 1986), misalignment with respect to disc (Bertola et al., 1991; Mendez-Abreu et al., 2007), and non-circular gas motions (Bertola et al., 1989; Gerhard et al., 1989; Berman, 2001; Corsini et al., 2003; Coccato et al., 2004). The bulk of their stellar population formed between redshift 3 and 5 (12 Gyr) in a short time-scale (Bernardi et al., 1998; Mehlert et al., 2003; Thomas et al., 2005). The enrichment of interstellar medium is strongly related to the time delay between SNII and SNIa, which contributed most of the elements and Iron, respectively (Worthey et al., 1992; Thomas et al., 2003).
On the contrary, the bulges of late-type spiral galaxies are reminiscent of discs. They are flat components (Fathi & Peletier, 2003) with exponential surface-brightness radial profiles (Andredakis & Sanders, 1994; de Jong, 1996; MacArthur et al., 2003) and rotate as fast as discs (Kormendy, 1993; Kormendy et al., 2001). Moreover, the stellar population in late-type bulges is younger than in early-type bulges (Trager et al., 1999; Goudfrooij et al., 1999; Thomas & Davies, 2006). They appear to have lower metallicity (Ganda et al., 2007) and lower Fe enhancement with respect to early type galaxies (Proctor & Sansom, 2002; Peletier et al., 2007; Afanasiev & Sil’chenko, 2005).
In the current paradigm, early-type bulges were formed by rapid collapse and merging events while late-type bulges have been slowly assembled by internal and environmental secular processes (Kormendy & Kennicutt, 2004). But many questions are still open. For instance, the monolithic collapse can not explain the presence in bulges of kinematically-decoupled components (Pizzella et al., 2002; Krajnović & Jaffe, 2004; Emsellem et al., 2004; McDermid et al., 2006). Moreover, the environment plays a role in defining the properties of galaxies (e.g., Dressler, 1980; Coziol et al., 2001; Clemens et al., 2006; Brough et al., 2007). Recent studies of early-type galaxies in different environments (Beuing et al., 2002; Thomas et al., 2005; Thomas & Davies, 2006) have shown that age, metallicity, and Fe enhancement are more correlated with the total mass of the galaxy than local environment.
To investigate the formation and evolution of the bulges, there are two possible approaches: going backward in redshift and look to evolution of galaxies through cosmic times or analyze in detail nearby galaxies to understand the properties of their stellar population in terms of dominant mechanism at the epochs of star formation and mass assembly. In this work, we present a photometric and spectroscopic study of the bulge dominated region of a sample of spiral galaxies in the Fornax and Pegasus clusters. Our aim is to estimate the age and metallicity of the stellar population and the efficiency and timescale of the last episode of star formation to disentangle between early rapid assembly and late slow growing.
The galaxy sample is presented in Sect. 2. The photometric observations are described in Sect. 3.1. The structural parameters of the bulge and disc of the sample galaxies are derived by analyzing their two-dimensional surface brightness distribution in Sect. 3.2. The spectroscopic observations are described in Sect. 4.1. The stellar kinematics and line-strength indices are measured from long-slit spectra in Sect. 4.2. The central values of the line-strength indices are derived in Sect. 5. They are used to estimate the age, metallicity, and Fe-enhancement of the stellar population of the bulge in Sect. 6 . Their gradients in the bulge dominated region are discussed in Sect. 7. The identification of pseudobulges hosted by sample galaxies is performed in Sect. 8. Finally, conclusions are given in Sect. 9.
2 Sample selection
The main goal of this paper is to study the stellar populations in bulges. In order to simplify the interpretation of the results we selected a sample of disc galaxies, which do not show any morphological signature of having undergone a recent interaction event. All the observed galaxies are classified as unbarred or weakly barred galaxies by de Vaucouleurs et al. (1991, hereafter RC3). They are bright (, RC3) and nearby ( , RC3) lenticulars and spirals with a low-to-intermediate inclination (, RC3). 12 of them were identified as member of either the Fornax, Eridanus and Pegasus cluster and 2 are member of the NGC 7582 group (Ferguson, 1989; Fouque et al., 1992; Garcia, 1993; Nishiura et al., 2000). The final sample is formed by 12 disc cluster and 2 group galaxies.
For every galaxy we provide the local galaxy number density using the method of distance to the nearest neighbour (Balogh et al., 2004). The projected galaxy density can be defined by , where is the distance to the nearest neighbour. To this aim we adopted the catalog of galaxies available in the Hyperleda database (Paturel et al., 2003). We considered only galaxies brighter than with systemic velocity in a range between with respect to the velocity of the sample galaxy (to avoid the background/foreground contamination). The sample galaxies reside in a high-density environment. In fact, their is much higher than the typical value of the field galaxies ( Balogh et al., 2004).
The galaxy number density along with an overview of the basic properties of the sample galaxies is given in Table 1.
| Galaxy | Type | T | PA | Cluster | Density | |||||
|---|---|---|---|---|---|---|---|---|---|---|
| (RC3) | (RC3) | (∘) | (arcmin) | (mag) | () | (Mpc) | (mag) | |||
| (1) | (2) | (3) | (4) | (5) | (6) | (7) | (8) | (9) | (10) | (11) |
| ESO 358-50 | SA00? | -2.0 | 173 | 13.87 | 1154 | 17.0 | F | 11.0 | ||
| ESO 548-44 | SA(r)0+: | -1.5 | 60 | 14.53 | 1561 | 22.6 | E | 19.3 | ||
| IC 1993 | (R′)SAB(rs)b | 3.0 | 57 | 12.43 | 877 | 17.0 | F | 6.2 | ||
| IC 5267 | SA(s)0/a | 0.0 | 140 | 11.43 | 1480 | 21.5 | N 7582 | 2.2 | ||
| IC 5309 | Sb | 3.0 | 23 | 14.52 | 3840 | 50.2 | P | 7.6 | ||
| NGC 1292 | SAb(s) | 5.0 | 7 | 11.29 | 1227 | 17.0 | F | 4.0 | ||
| NGC 1351 | SA-pec: | -3.0 | 140 | 12.46 | 1407 | 17.0 | F | 31.3 | ||
| NGC 1366 | S00 | -2.0 | 2 | 11.97 | 1182 | 17.0 | F | 10.1 | ||
| NGC 1425 | SA(s)b | 3.0 | 129 | 11.29 | 1402 | 17.0 | F | 2.1 | ||
| NGC 7515 | S? | 3.0∗ | 15 | 13.16 | 4117 | 50.2 | P | 2.1 | ||
| NGC 7531 | SAB(r)bc | 4.0 | 15 | 12.04 | 1361 | 21.5 | N 7582 | 4.8 | ||
| NGC 7557 | S? | 4.0∗ | 163 | 15.15 | 3366 | 50.2 | P | 2.4 | ||
| NGC 7631 | SA(r)b: | 3.0 | 79 | 13.93 | 3396 | 50.2 | P | 19.1 | ||
| NGC 7643 | S? | 6.0∗ | 45 | 14.12 | 3520 | 50.2 | P | 1.2 |
3 Surface photometry
3.1 Observations and data reduction
The photometric observations of the sample galaxies were carried out in two runs at the European Southern Observatory (ESO) in La Silla (Chile) on December 2002, 9-12 (run 1), September 2003, 26-28 (run 2).
We imaged the galaxies at the ESO 3.6-m Telescope with the ESO Faint Object Spectrograph and Camera 2 (EFOSC2). The detector was the No. 40 Loral/Lesser CCD with pixels of . A pixel binning was adopted giving an effective scale of arcsec pixel-1 with a field of view of arcmin2. The gain and readout noise were set to 1.3 e- ADU-1 and 9 e-, respectively.
We used the No. 642 Bessel -band filter centred at 6431 Å with a FWHM of 1654 Å. For each galaxy we took s images with a offset of few pixels to be able to clean cosmic rays and bad pixels. Every night we observed several fields of standard stars at different air-masses to be used for the flux calibration. For each field we took different exposures ranging from 5 to 15 s to have good signal-to-noise ratio () and well sampled PSF for all the standard stars. The typical value of the seeing FWHM during the galaxy exposures was arcsec as measured by fitting a two-dimensional Gaussian to the field stars.
All images were reduced using standard IRAF111IRAF is distributed by NOAO, which is operated by AURA Inc., under contract with the National Science Foundation. tasks. We first subtracted a bias frame consisting of ten exposures for each night. The images were flat-fielded using sky flats taken at the beginning and/or end of each observing night. The sky background level was removed by fitting a Legendre polynomial (with a degree free to range between 0 and 2) to the regions free of sources in the images. Special care was taken during sky subtraction to reach the outermost parts of the objects. No scattered light was observed in the images, and the adopted polynomial degree was either 0 or 1. Cosmic rays and bad pixels were removed by combining the different exposures using field stars as a reference and adopting a sigma clipping rejection algorithm. Residual cosmic rays and bad pixels were corrected by manually editing the combined image.
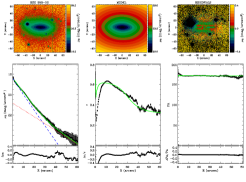
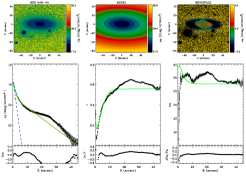
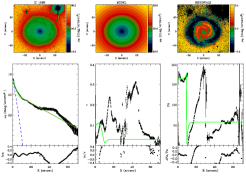
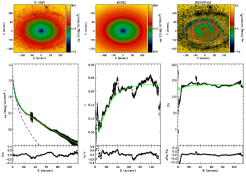
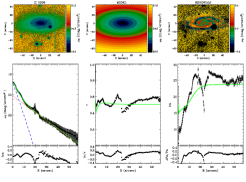
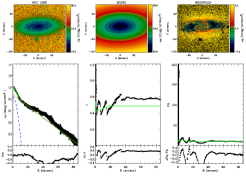
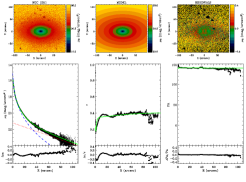
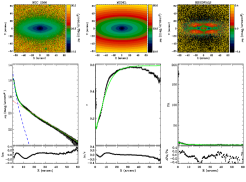
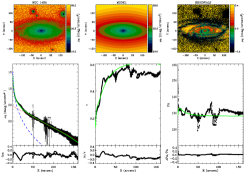
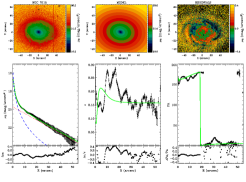
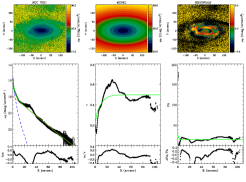
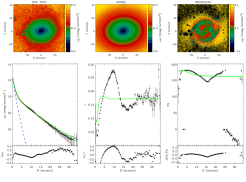
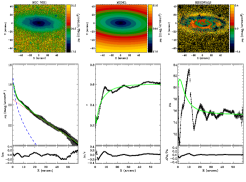
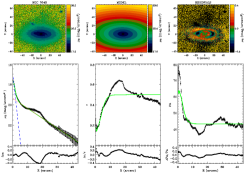
The photometric calibration constant includes only the correction for atmospheric extinction, which is taken from the differential aerosol extinction for ESO (Burki et al., 1995). No color term has been considered and no attempt was made to correct for internal and Galactic extinction. Fig. 1 shows the calibrated -band images of the sample galaxies.
Isophote-fitting with ellipses, after masking foreground stars and residual bad columns, was carried out using the IRAF task ELLIPSE. In all cases, we first fit ellipses allowing their centres to vary. Within the errors, no variation in the ellipse centres was found for all the galaxies studied in this paper. The final ellipse fits were done at fixed ellipse centres. The ellipse-averaged profiles of surface brightness, position angle and ellipticity are shown in Fig. 1 for all the sample galaxies.
3.2 Photometric decomposition
Let be Cartesian coordinates with the origin corresponding to the position of the galaxy surface-brightness peak, the axis parallel to direction of right ascension and pointing westward, the axis parallel to direction of declination and pointing northward, and the axis along the line-of-sight and pointing toward the observer. The plane of the sky is confined to the plane.
We assumed the galaxy surface-brightness distribution to be the sum of the contributions of a bulge and a disc component. Bulge isophotes are ellipses centred on , with constant position angle PAb and constant axial ratio . Disc isophotes are ellipses centred on , with constant position angle PAd and constant axial ratio , implying that the galaxy inclination is . We adopted the Sérsic law (Sersic, 1968) to describe the surface brightness of the bulge component
| (1) |
where , and are respectively the effective radius, surface brightness at , and a shape parameter describing the curvature of the profile. The value of is coupled to so that half of the total flux is always within and can be approximated as (Caon et al., 1993). The radius is given by
| (2) | |||||
For the surface brightness distribution of the disc component we assumed the exponential law (Freeman, 1970)
| (3) |
where and are the scale length and central surface brightness of the disc, respectively. The radius is given by
| (4) | |||||
To derive the photometric parameters of the bulge (, , , PAb, and ) and disc (, , PAd, and ) and the position of the galaxy centre we fitted iteratively a model of the surface brightness to the pixels of the galaxy image using a non-linear least-squares minimization based on the robust Levenberg-Marquardt method by Moré et al. (1980). We adopted the technique for photometric decomposition developed in GASP2D by Mendez-Abreu et al. (2007). The actual computation has been done using the MPFIT222The updated version of this code is available on http://cow.physics.wisc.edu/ craigm/idl/idl.html algorithm implemented by C. B. Markwardt under the IDL333Interactive Data Language environment. Each image pixel has been weighted according to the variance of its total observed photon counts due to the contribution of both the galaxy and sky, and determined assuming photon noise limitation and taking into account for the detector read-out noise. The seeing effects were taken into account by convolving the model image with a circular Gaussian PSF with the FWHM measured from the stars in the galaxy image. The convolution was performed as a product in Fourier domain before the least-squares minimization.
To derive the free parameters of the model surface-brightness distribution, we adopted as initial trial for least-squares minimization the values obtained by performing a standard photometric decomposition with a parametric technique similar to that adopted by Kormendy (1977). The ellipse-averaged surface-brightness profile of the galaxy has been fitted in two steps by considering first separately and then simultaneously the light contributions of the bulge and disc.
We began by fitting an exponential law to the galaxy surface-brightness profile at large radii, where it is dominated by the light contribution of the disc. In this way we derived the values of and . Then we extrapolated the exponential profile to small radii and subtracted it from the galaxy surface-brightness profile. This gave us a first estimate of the light distribution of the bulge. We fitted to this a Sersíc profile by assuming the bulge shape parameter to be … and deriving the corresponding values of and . Finally, for each set of , , , , and we fitted simultaneously both bulge and disc to the galaxy surface-brightness profile and we assumed those giving the best fit as the trial values for the two-dimensional fit, where all the parameters are allowed to vary.
The trial values of PAb and were obtained by interpolating at the ellipse-averaged position-angle and ellipticity profiles, respectively. We assumed the coordinates of the image pixel where the maximum galaxy surface brightness is measured as the trial values of the coordinates of the galaxy centre. The parameters derived for the structural components of the sample galaxies are collected in Table 2. The result of the photometric decomposition of the surface brightness distribution of the sample galaxies is shown in Fig. 1.
The errors given in Table LABEL:tab:phot_para were obtained through a series of Monte Carlo simulations. Due to the formal errors obtained from the minimization method are usually not representative of the real errors in the structural parameters. We have carried out extensive simulations on artificial galaxies in order to give a reliable estimation of these errors.
We generated a set of 2000 images of galaxies with a Sérsic bulge and an exponential disc. The structural parameters of the artificial galaxies were randomly chosen among the following ranges
| (5) |
for the bulges, and
| (6) |
for the discs. The artificial galaxies also satisfy the following conditions
| (7) |
where is the total -band magnitude of the galaxy. The simulated galaxies were assumed to be at a distance of 29 Mpc, which correspond to a scale of 141 pc . The pixel scale used was 0.314 arcsec pixel-1 and the CCD gain and RON were 0.7 e- ADU-1 and 8 e- to mimic the instrumental setup of the observed galaxies. Finally, a background level and a photon noise were added to the resulting images to yield a signal-to-noise ratio similar to that of the observed images.
To estimate the errors associated to the decomposition, the code GASP 2D was applied to the artificial images as if they were real. Then, the relative errors (1- vi/vo) were estimated by comparing the input (vi) and output (vo) values. To assign to every single galaxy the corresponding error for every structural parameter, we divided our catalogue of artificial galaxies in bins of 0.5 magnitudes, we assumed that the errors were normally distributed, with mean and standard deviation corresponding to the systematic and typical error respectively. Then we placed our observed galaxy in its magnitude bin and assigned to every parameter the corresponding error.
4 Long-slit spectroscopy
4.1 Observations and data reduction
The spectroscopic observations of the sample galaxies were carried out in three runs at ESO in La Silla (Chile) on December 2002, 9-12 (run 1), September 2003, 26-28 (run 2), and January 2005, 25 (run 3).
In run 1 and 2 the 3.6-m ESO Telescope mounted the EFOSC2 spectrograph. The grism No. 9 with 600 was used in combination with the 1.0 arcsec 5.0 arcmin slit and the No. 40 Loral/Lesser CCD with pixels of . A pixel binning was adopted. The wavelength range between 4700 and 6770 Å was covered with a reciprocal dispersion of 1.98 Å pixel-1 after pixel binning. This guarantees an adequate oversampling of the instrumental broadening function. Indeed, the instrumental dispersion, obtained by measuring the width of emission lines of a comparison spectrum after the wavelength calibration, was Å (FWHM). This corresponds to at 5735 Å. The spatial scale was arcsec pixel-1 after pixel binning.
In run 3 the New Technology Telescope mounted the ESO Multi-Mode Instrument (EMMI) in red medium-dispersion spectroscopic (REMD) mode. It used the grating No. 6 with 1200 with a 1.0 arcsec 5.5 arcmin slit. The detector was a mosaic of the No. 62 and No. 63 MIT/LL CCDs. Each CCD has pixels of . We adopted a pixel binning. It yielded a wavelength coverage between about 4850 Å and 5490 Å with a reciprocal dispersion of 0.40 after pixel binning. The instrumental dispersion is Å (FWHM) corresponding to at 5170 Å. The spatial scale was arcsec pixel-1 after pixel binning.
| Galaxy | PAb | PAd | ||||||||||
|---|---|---|---|---|---|---|---|---|---|---|---|---|
| (mag/arcsec2) | (arcsec) | (∘) | (mag/arcsec2) | (arcsec) | (∘) | (arcsec) | (mag) | |||||
| (1) | (2) | (3) | (4) | (5) | (6) | (7) | (8) | (9) | (10) | (11) | (12) | (13) |
| ESO 358-50 | ||||||||||||
| ESO 548-44 | ||||||||||||
| IC 1993 | ||||||||||||
| IC 5267 | ||||||||||||
| IC 5309 | ||||||||||||
| NGC 1292 | ||||||||||||
| NGC 1351 | ||||||||||||
| NGC 1366 | ||||||||||||
| NGC 1425 | ||||||||||||
| NGC 7515 | ||||||||||||
| NGC 7531 | ||||||||||||
| NGC 7557 | ||||||||||||
| NGC 7631 | ||||||||||||
| NGC 7643 |
We obtained -minutes spectra for all the sample galaxies in run 1 and 2. In run 3 we obtained new 30-minutes spectra of ESO 358-50, ESO 548-44, NGC 1292, and IC 1993 which turned out to have a central velocity dispersion lower than 100 Ȧt the beginning of each exposure, the slit was positioned on the galaxy nucleus using the guiding camera. Then it was aligned along the galaxy major axis, according to the position angle given in Table 1. During the three observing runs, we took spectra of several giant stars which were selected from Worthey et al. (1994) to be used as templates in measuring the stellar kinematics and line strength indices. In run 1 and 2 we observed HR 296 (K0III-IV), HR 489 (K3III), HR 2429 (K1III), HR 2503 (K4III), HR 2701 (K0III), HR 2970 (K0III), HR 3145 (K2III), HR 3418 (K2III), HR 7149 (K2III), HR 7317 (K3III), and HR 7430 (G9III). In run 3 we observed HR 294 (K0III), HR 510 (G8III), HR 1318 (K3III), and HR 2035 (G8III). Additionally, we observed three spectrophotometrical standard stars in order to flux-calibrate the galaxy and line strength standard stars before the line indices were measured. A spectrum of the comparison helium-argon arc lamp was taken before and/or after each target exposure to allow an accurate wavelength calibration. The value of the seeing FWHM during the galaxy exposures ranged between 0.5 and 1.3 arcsec as measured by fitting a two-dimensional Gaussian to the guide star.
All the spectra were bias subtracted, flat-field corrected, cleaned of cosmic rays, and wavelength calibrated using standard IRAF routines. The bias level was determined from the bias frames obtained during the observing nights to check the CCD status. The flat-field correction was performed by means of both quartz lamp and twilight sky spectra (which were normalized and divided into all the spectra) to correct for pixel-to-pixel sensitivity variations and large-scale illumination patterns due to slit vignetting. Cosmic rays were identified by comparing the counts in each pixel with the local mean and standard deviation (as obtained from Poisson statistics by taking into account the gain and read-out noise of the detector) and then corrected by interpolating over. The residual cosmic rays were corrected by manually editing the spectra. Each spectrum was rebinned using the wavelength solution obtained from the corresponding arc-lamp spectrum. We checked that the wavelength rebinning had been done properly by measuring the difference between the measured and predicted wavelengths for the brightest night-sky emission lines in the observed spectral range (Osterbrock et al., 1996). The resulting accuracy in the wavelength calibration is better than 5 . All the spectra were corrected for CCD misalignment following Bender, Saglia & Gerhard (1994, BSG94). The spectra obtained for the same galaxy in the same run were co-added using the center of the stellar continuum as reference. This allowed to improve the of the resulting two-dimensional spectrum. In such a spectrum, the contribution of the sky was determined by interpolating a one-degree polynomium along the outermost 20 arcsec at the two edges of the slit, where the galaxy light was negligible, and then subtracted. A sky subtraction better than was achieved. A one-dimensional spectrum was obtained for each kinematical template star as well as for each flux standard star. The spectra of the kinematical templates were deredshifted to laboratory wavelengths.
4.2 Measuring stellar kinematics and line-strength indices
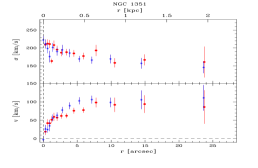
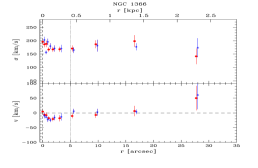
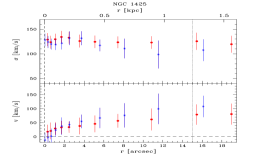
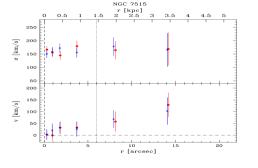
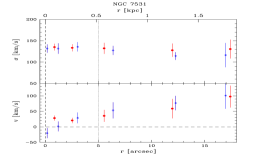
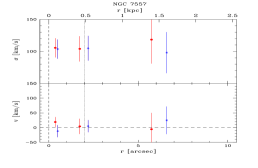
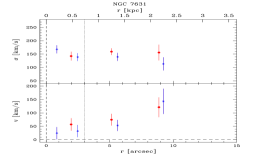
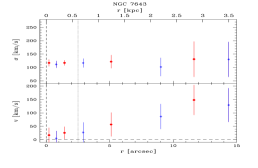
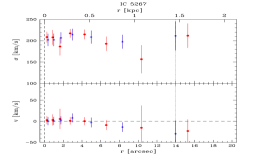
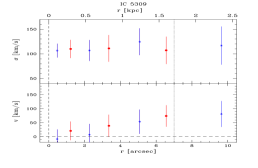
We measured the stellar kinematics from the galaxy absorption features present in the wavelength range and centered on the Mg line triplet ( 5164, 5173, 5184 Å) by applying the Fourier Correlation Quotient method (Bender 1990) as done by BSG94. The spectra were rebinned along the dispersion direction to a natural logarithmic scale, and along the spatial direction to obtain a per resolution element. For run 3 it was necessary to average the whole spectra obtaining a one-dimensional spectrum in order to achieve the desired . In few spectra of run 1 and 2 the decreases to 10 at the outermost radii. To measure the stellar kinematics of the sample galaxies we adopted HR 296, HR 2429, and HR 2701 as kinematical templates for runs 1 and 2 and HR 296 and HR 510 for run 3. We considered the wavelength range 4817-6503 Å in runs 1 and 2 and 5167-5378 Å in run 3 around the redshifted Mg lines of the galaxies. We derived for each galaxy spectrum, the line-of-sight velocity distribution (LOSVD) along the slit and measured the radial velocity and velocity dispersion . At each radius, they have been derived by fitting the LOSVD with a Gaussian. The errors on the LOSVD moments were derived from photon statistics and CCD read-out noise, calibrating them by Monte Carlo simulations as done by BSG94. In general, errors are in the range 5–20 , becoming larger in the outer regions of some galaxies where . These errors do not take into account the possible systematic effects arising from template mismatch. The measured stellar kinematics are plotted in Fig. 19 and given in Tab. LABEL:tab:val_globtot.
| Galaxy | []′ | Mg 2 | Mg b | |||
|---|---|---|---|---|---|---|
| () | (Å) | (Å) | (mag) | (Å) | (Å) | |
| (1) | (2) | (3) | (4) | (5) | (6) | (7) |
| ESO 358-50 | ||||||
| ESO 548-44 | ||||||
| IC 1993 | ||||||
| IC 5267 | ||||||
| IC 5309 | ||||||
| NGC 1292 | ||||||
| NGC 1351 | ||||||
| NGC 1366 | ||||||
| NGC 1425 | ||||||
| NGC 7515 | ||||||
| NGC 7531 | ||||||
| NGC 7557 | ||||||
| NGC 7631 | ||||||
| NGC 7643 |
Detailed measurements of kinematics is not only important to study the dynamical properties of galaxies but also to derive the line strength of the Lick indices. Following Mehlert et al. (2000), we measured the Mg, Fe, and line-strength indices (as defined by Faber et al. 1985 and Worthey et al. 1994) from the flux-calibrated spectra of run 1 and 2. Spectra were rebinned in the dispersion direction as well as in the radial direction as before. We indicate the average Iron index with (Gorgas et al., 1990), and the newly defined Magnesium-Iron index with (Thomas et al., 2003). We convolved all the spectra with a Gaussian with a proper to degrade them to the fixed spectral resolution of the Lick system ( Å). No focus correction was applied because the atmospheric seeing was the dominant effect during observations (see Mehlert et al., 1998, for details). The errors on indices were derived from photon statistics and CCD read-out noise, and calibrated by means of Monte Carlo simulations. We calibrated our measurements to the Lick system using the stars from Worthey et al. (1994) we observed in run 1 and 2. A well known problem when deriving age and metallicity of galaxy stellar populations is the contamination of the index by the emission line. To address this issue we adopted the code GANDALF (Gas AND Absorbtion Line fitting) to fit the galaxy spectra with synthetic population models as done by Sarzi et al. (2006). The models were built with different templates from the stellar libraries by Bruzual & Charlot (2003) and Tremonti et al. (2004). We adopted the Salpeter initial mass function (Salpeter, 1955), ages ranging between 1 Myr and 10 Gyr, and metallicities between 1 and 2.5 . The spectral resolution of the stellar templates (FWHM Å) was degraded to match that our galaxy spectra. We simultaneously fitted the observed spectra using emission lines in addition to the stellar templates. The emission line was detected () in NGC 1292, NGC 7531, NGC 7631, NGC 7643, IC 5267, IC 5309. The equivalent with of emission line was ranging from 0 to 4 Å depending on the galaxy and radius (Tab. LABEL:tab:val_globtot). The emission line was subtracted from the observed spectrum and we measured the line-strength index from the resulting absorption line.
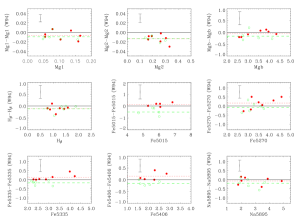
The measured values for the line-strength indices for the stars in common with Worthey et al. (1994) are shown in Fig. 3. The agreement is good within the errors for all the indices and we did not apply any zero-point correction.
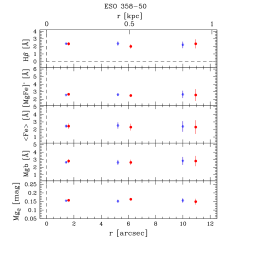
Kuntschner (2000) measured the central velocity dispersion and line-strength indices for NGC 1351 and ESO 358-G50. The comparison is shown in Fig. 4. All the values are consistent with ours within .

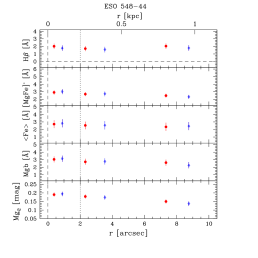
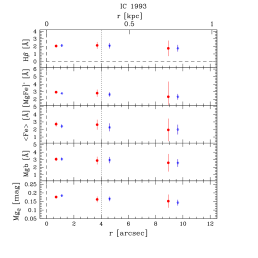
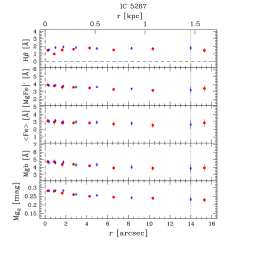
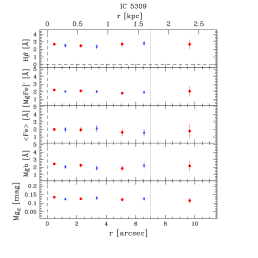
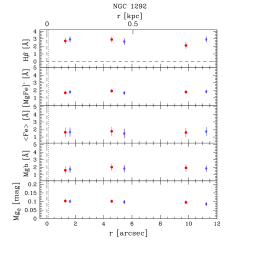
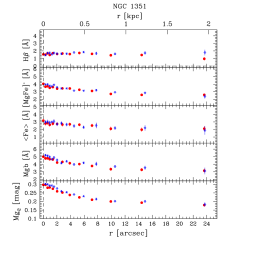
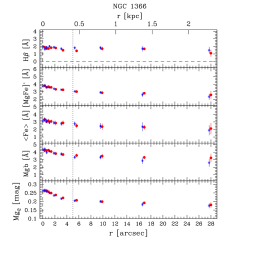
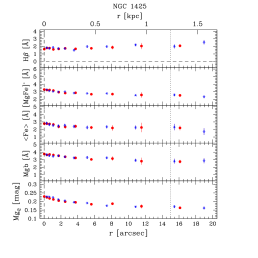
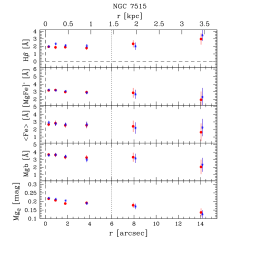
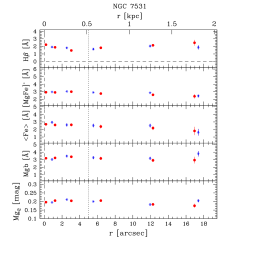
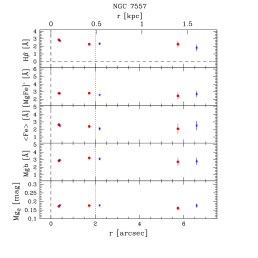
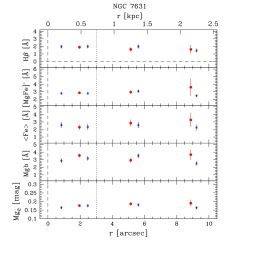
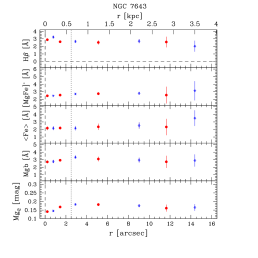
The measured values of , []′, , Mg b, and Mg 2 for all the sample galaxies are plotted in Fig. 5 and listed in Tab. LABEL:tab:val_globtot.
5 Line-strength indices: central values
Central values of velocity dispersion , Mg b, Mg 2, , , and []′ line-strength indices were derived from the major-axis profiles. The data points inside were averaged adopting a relative weight proportional to their . The resulting values are listed in Tab. LABEL:tab:centval_lickind.
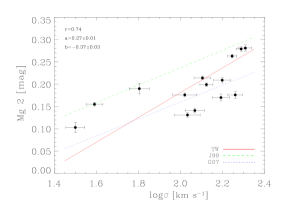
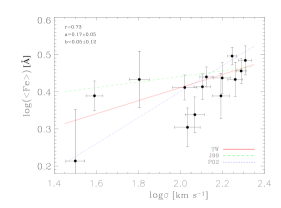
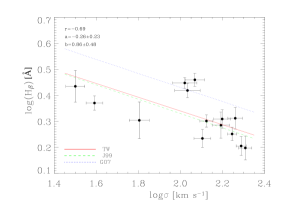
The correlations between the velocity dispersion and Mg 2, , and line-strength indices for the sample galaxies are plotted in Fig. 8. They were extensively studied for early-type galaxies (see Fisher et al., 1996; Bernardi et al., 1998; Jørgensen, 1999a; Kuntschner, 2000; Moore et al., 2002; Mehlert et al., 2003; Rampazzo et al., 2005; Sánchez-Blázquez et al., 2006; Collobert et al., 2006; Annibali et al., 2007). In Fig. 8 we also plotted for comparison the fitted correlations to different sample of elliptical/early-type galaxies and bulges.
The Mg 2 line-strength index is generally adopted as the tracer of the elements giving an estimate of the enrichment, while is related with the gravitational potential. In elliptical and S0 galaxies the Mg 2 correlation shows that more massive galaxies host a more metal rich stellar population (see Idiart et al., 1996; Bernardi et al., 1998; Jørgensen, 1999a; Mehlert et al., 2003). For bulges we measured a similar trend to that found by Jablonka et al. (1996), Prugniel et al. (2001), and Ganda et al. (2007). In agreement with Ganda et al. (2007) we also found that the spirals lie below the Mg 2 relation defined by the elliptical and early-type galaxies (Jørgensen, 1999a).
Although the correlation between and was predicted by models of the dissipative collapse (e.g., Kodama et al., 1998), it was not found to be very tight in early-type galaxies (Fisher et al., 1996; Jørgensen, 1999a; Trager et al., 1998; Mehlert et al., 2003) except for those studied by Kuntschner (2000). On the other hand, the relation is well defined for spiral bulges (Idiart et al., 1996; Prugniel et al., 2001; Proctor & Sansom, 2002). The fitted slope is slightly steeper that the one traced for elliptical/early-type galaxies (Jørgensen, 1999a) and consistent with the relation by Proctor & Sansom (2002).
We also found a tight anti-correlation between and . For large values of our measurements are consistent with previous results by Jørgensen (1999a) and Ganda et al. (2007). At low our fit follows closer the relation by Jørgensen (1999a) due to the presence of S0-Sa galaxies in our sample. Nevertheless, the spiral galaxies are lying on the fitted line of the well selected Sb-Sc sample given by Ganda et al. (2007). The comparison with Jørgensen (1999a) could be affected by the possible contamination of their line-strength indices by the emission line due to the presence of a young stellar component.
Young stellar population is often associated to dusts (e.g., Peletier et al., 2007). The dust structure is clearly visible in the residual maps of the two-dimensional bulge-disc decompositions (Fig. 1). No correlation is found between dust and central values of the line-strength indices. But, the dust is located at larger radii than the regions mapped by the spectra (Fig. 5). Only for NGC 7515 and NGC 7643 the outer radial bins of spectra cover a portion of the dust features observed in the residual maps. The strong emission line detected at these radii is indicating the presence a local young stellar population. But, this is not enough to drive a general conclusion about the correlation of dust and stellar populations in the sample galaxies.
6 Ages, metallicities, and /Fe enhancement:central values
From the central line-strength indices we derived the mean ages, total metallicities, and total Fe enhancements of the stellar populations in the center of the sample bulges by using the stellar population models by Thomas et al. (2003). These models predict the values of the line-strength indices for a single stellar population as function of the age, metallicity and [] ratios.
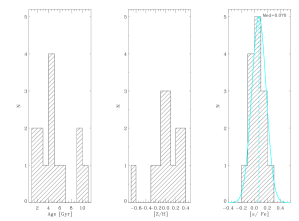
The distribution of the central and []′ with the stellar population models by Thomas et al. (2003) is shown in Fig. 9 (left panel). The models are plotted for two fixed [] ratios (0 and 0.5 dex) corresponding to stellar populations with solar and supersolar Fe enhancements, respectively. In this parameters space the mean age and total metallicity appear to be almost insensitive to the variations of the Fe enhancement. The distribution of the central Mg b and with the stellar population models by Thomas et al. (2003) is shown in Fig. 9 (right panel). The models are plotted for two fixed ages (3 and 12 Gyr) corresponding to intermediate-age and old stellar populations, respectively. In this parameters space the Fe enhancement and total metallicity appear to be almost insensitive to the variations of age. Central age, metallicity and total Fe enhancement of each bulge were derived by a linear interpolation between the model points using the iterative procedure described in Mehlert et al. (2003). The derived values and their corresponding errors are listed in Tab. 4. The histograms of their number distribution are plotted in Fig. 10. Even though the number of galaxies does not allow us to trace a firm statistical conclusion, three classes of objects were identified. according to their age and metallicity. A similar result was found by Moorthy & Holtzman (2006). The young bulges are scattered about an average age of 2 Gyr with hints of star formation as shown by the presence of the emission line in their spectra. The intermediate-age bulges spans the age range between 4 and 8 Gyr. They are characterized by solar metallicity ([] dex). Finally, the old bulges have a narrow distribution in age around 10 Gyr and high metallicity ([] dex). Kuntschner (2000) and Mehlert et al. (2003) found that elliptical galaxies in Fornax and Coma clusters are on average older and more metal rich than S0 galaxies.
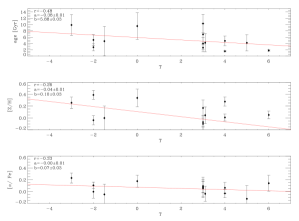
Thomas & Davies (2006) did not observe any correlation between the age and metallicity of the bulge stellar population and galaxy morphology. This was interpreted as an indication of independent evolution of the stellar populations of the bulges and discs. In the sample studied by Peletier et al. (2007) the early-type spirals often show young stellar populations in their central regions, but there are also objects that are as old as the oldest ellipticals. Young central populations are seen in all the late-type spirals of Ganda et al. (2007). The correlation between the morphological type (col. 3, Tab. 1) and the age, metallicity and Fe enhancement of our sample galaxies are shown in Fig. 12. Although the correlations are not statistically very strong (in particular for the Fe enhancement), the elliptical and S0 galaxies () are older and more metal rich than the spirals ().
Most of the sample bulges display Solar Fe enhancements with the median of the distribution at ([]). A few have a central super-solar enhancement ([]). These values are similar to those found for the elliptical galaxies in cluster (Peletier, 1989; Jørgensen, 1999b; Trager et al., 2000; Kuntschner, 2000; Kuntschner et al., 2001) and imply a star-formation timescale ranging from 1 to 5 Gyr.
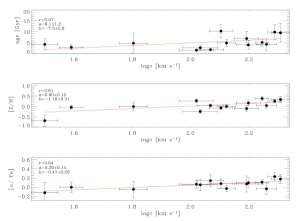
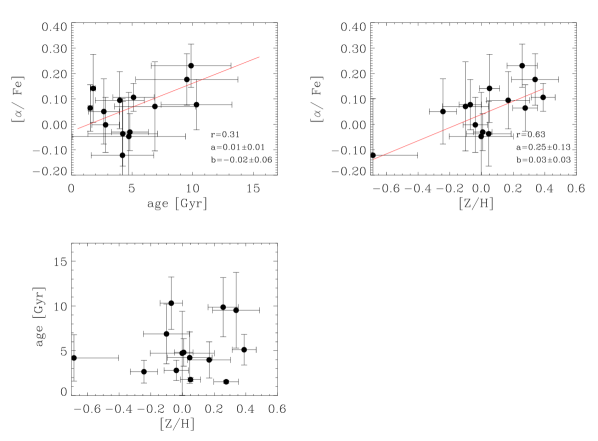
Age, metallicity, and Fe enhancement correlate with velocity dispersion (Fig. 11). In early-type galaxies the metallicity and /Fe enhancement are well correlated with the central velocity dispersion, while the correlation is less evident with age (Mehlert et al., 2003; Sánchez-Blázquez et al., 2006; Denicoló et al., 2005). In our bulges both the metallicity and /Fe enhancement correlate with the velocity dispersion and this is probably driving the correlation observed between the metallicity and /Fe enhancement (Fig. 13). Age is mildly correlated with velocity dispersion (Fig. 11), and /Fe enhancement (Fig.13). Recently, Thomas & Davies (2006) proved that these correlations are tighter when the age estimation is based on bluer Balmer line-strenght indices instead of . We conclude that the more massive bulges of our sample galaxies are older, more metal rich and characterized by a fast star formation. Since we did not found any correlation with galaxy morphology we exclude a strong interplay between the bulge and the disc components.
| Galaxy | [] | Age | [] |
|---|---|---|---|
| [Gyr] | |||
| (1) | (2) | (3) | (4) |
| ESO 358-50 | |||
| ESO 548-44 | |||
| IC 1993 | |||
| IC 5267 | |||
| IC 5309 | |||
| NGC 1292 | |||
| NGC 1351 | |||
| NGC 1366 | |||
| NGC 1425 | |||
| NGC 7515 | |||
| NGC 7531 | |||
| NGC 7557 | |||
| NGC 7631 | |||
| NGC 7643 |


7 Ages, metallicities, and /Fe enhancement: gradients
Different formation scenarios predict different radial trends of age, metallicity, and /Fe enhancement. Therefore the radial gradients of the properties of the stellar populations of bulges are a key information to understand the processes of their formation and evolution.
The total metallicity of a stellar population depends only on the efficiency of the star formation and on the amount of gas transformed in star (Tinsley, 1980). In the monolithic collapse scenario gas dissipation toward the galaxy centre with subsequent occurrence of star formation and blowing of galactic winds produce a steep metallicity gradient (Eggen et al., 1962; Larson, 1974; Arimoto & Yoshii, 1987). A strong gradient in /Fe enhancement is expected too (Ferreras & Silk, 2002). The predictions for bulges forming through a long time-scale processes as dissipation-less secular evolution are more contradictory. In this scenario the bulge is formed by redistribution of disc stars. The gradients eventually present in the progenitor disk, could be either amplified since the resulting bulge has a smaller scale length than the progenitor or erased as a consequence of disc heating (Moorthy & Holtzman, 2006).
An issue in measuring the gradients of age, metallicity and Fe enhancement in bulge, could be the contamination of their stellar population by the light coming from the underlying disc stellar component. This effect is negligible in the galaxy center but it could increase going to the outer regions of the bulge, where the light starts to be dominated by the disc component. In order to reduce the impact of disc contamination and extend as much as possible the region in which deriving gradients, we map them inside , the radius where the bulge and disc give the same contribution to the total surface-brightness. This is a region slightly larger than of the galaxy (Fig. 14). Deriving gradients in the bulge dominated region with this approach, will not remove completely the contamination by the disc stellar population but it will assure always a similar degree of contamination in comparing the gradients of different galaxies.

For each galaxy, we derived the Mg 2, , and line-strength indices at the radius (see Tab. 2). The ages, metallicities and Fe enhancements were derived by using the stellar population models by Thomas et al. (2003) as done for the central values.
The gradients were set as the difference between the values at centre and and their corresponding errors were calculated through Monte Carlo simulations taking into account the errors in the gradients and the logarithmic fit to the adopted indices. For NGC 1292 no gradients were obtained since it was not possible to estimate . The galaxy bulge is fainter than the disc at all radii (Fig. 1). Indeed, the surface-brightness radial profile of the galaxy could be fitted by adopting only an exponential disc (Tab. 2).
The final gradients of age, metallicity and Fe enhancement and their errors are listed in Tab. 5. In Tab. 5 we also report the age, metallicity and Fe enhancement gradients rescaled to a fix radius value of 1 kpc. For two galaxies (ESO 358-G50 and NGC 7531) the small values of combined with the big values of gradients give meaningless values of age extrapolated at 1 kpc and we omit them in the table. The histograms of their number distribution are plotted in Fig. 15.
| Galaxy | ([]) | (Age) | ([]) | ([])kpc | (Age)kpc | ([])kpc |
|---|---|---|---|---|---|---|
| [Gyr] | [Gyr] | |||||
| (1) | (2) | (3) | (4) | (5) | (6) | (7) |
| ESO 358-50 | ||||||
| ESO 548-44 | ||||||
| IC 1993 | ||||||
| IC 5267 | ||||||
| IC 5309 | ||||||
| NGC 1351 | ||||||
| NGC 1366 | ||||||
| NGC 1425 | ||||||
| NGC 7515 | ||||||
| NGC 7531 | ||||||
| NGC 7557 | ||||||
| NGC 7631 | ||||||
| NGC 7643 |
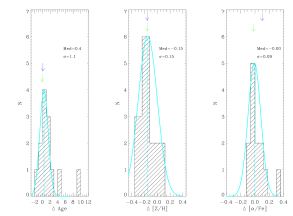
Most of the sample galaxies show no gradient in age (median=0.4), in agreement with the earlier findings by Mehlert et al. (2003) and Sánchez-Blázquez et al. (2006) for the early-type galaxies, and by Jablonka et al. (2007) for bulges. Only NGC 1366 and NGC 7531 display a steep age gradient (see Fig. 15).
Negative gradients of metallicity were observed in the sample bulges. The number distribution show a clear peak at ([]). This was already known for the stellar populations in early-type galaxies (Proctor & Sansom, 2002; Mehlert et al., 2003; Sánchez-Blázquez et al., 2006), and it has been recently found for spiral bulges too by Jablonka et al. (2007). The presence of negative gradient in the metallicity radial profile favors a scenario with bulge formation via dissipative collapse (Larson, 1974).
Dissipative collapse implies strong inside-out formation that should give rise to a negative gradient in the /Fe enhancement too (Ferreras & Silk, 2002). But no gradient was measured in the [] radial profiles for almost all the galaxies. Only 1 object of 14 are out of 3 of distribution (Fig. 15). All the deviations from the median values of the other objects can be explained by their errors only (Tab. 5). The same conclusion has been found by Jablonka et al. (2007) where they state that the changes in /Fe enhancement are small and it is rather constant among their bulges.
The absence of gradients in /Fe enhancement is not in contrast with the presence of a metallicity gradient and could be due to the different enrichment of the material fuelling the star formation.
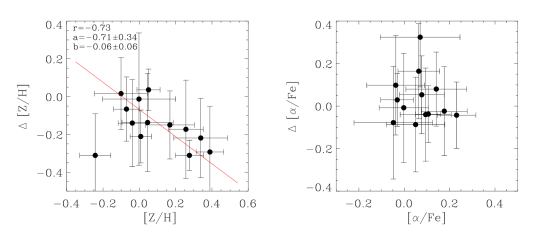
No correlation was found between the central value and gradient of /Fe enhancement as in Reda et al. (2007), while the central value and gradient of metallicity are related in spite of the large error-bars (Fig. 16). All these hints suggest that a pure dissipative collapse is not able to explain formation of bulges and that other phenomena like mergers or acquisition events need to be invoked (Bekki & Shioya, 1999; Kobayashi & Arimoto, 1999).
The peculiar gradients observed for the stellar population of the bulges of NGC 1366 and NGC 7531 suggest they have different characteristic with respect to the rest of the sample. NGC 1366 shows a steep positive age gradient (from about to Gyr) a strong negative metallicity gradient (from about 0.5 to 0 dex) within 5” from the centre. In this region a sharp rotation is measured while immediately further out the galaxy is almost not rotating. Moreover, the rotation in the innermost regions is opposite to that observed at large radii (Fig. 19). Even if a disc-bulge decoupling (Bertola et al., 1999; Sarzi et al., 2000; Matthews & de Grijs, 2004) could give a similar kinematical signature the stellar population analysis is more suggestive of the presence counter-rotating nuclear stellar disc similar to those already observed in both elliptical (e.g., Morelli et al., 2004) and spiral galaxies (e.g., Corsini et al., 1999; Pizzella et al., 2002; Krajnović & Jaffe, 2004; Emsellem et al., 2004; McDermid et al., 2006). The nuclear disc is younger than the rest of host bulge and formed by enriched material probably acquired via interaction or minor merging. The age of the stellar population of NGC 7531 rises from a central value of about 2 Gyr to 12 Gyr at 4 arcsec. Further out it decreases to 2 Gyr at 6 arcsec from the centre. Despite this change, no gradient in both metallicity and Fe enhancement was found. We suggest that this is due to the presence of a component which is corotating but structurally decoupled with respect to the rest of the galaxy (e.g., McDermid et al., 2006).
8 Pseudobulges
The current picture of bulge demography reveals that disc galaxies can host bulges with different photometric and kinematic properties (see Kormendy & Kennicutt, 2004, for a review). Classical bulges are similar to low-luminosity ellipticals and are thought to be formed by mergers and rapid collapse. Pseudobulges are disc or bar components which were slowly assembled by acquired material, efficiently transferred to galaxy centre where it formed stars. Pseudobulges can be identified according to their morphologic, photometric, and kinematic properties, following the list of characteristics compiled by Kormendy & Kennicutt (2004). The more apply, the safer the classification becomes.
The apparent flattening of the bulge is similar to that of the disc in NGC 1292, NGC 1351 (Tab. 2). Moreover, most of the sample bulges have a Sérsic index . Only IC 5267, NGC 1351, NGC 1425, NGC 7515, and NGC 7631 have (Tab. 2).
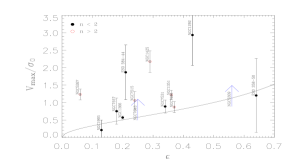
Pseudobulges are expected to be more rotation-dominated than classical bulges which are more rotation-dominated than giant elliptical galaxies (Kormendy & Kennicutt, 2004). We measured the maximum rotation velocity within from the stellar velocity curve and central velocity dispersion from the velocity dispersion profile. The ellipticity of the bulge was measured by the photometric decomposition (Tab. 2). For each galaxy we derived the ratio . In Fig. 17 we compared it to the value predicted for an oblate spheroid with isotropic velocity dispersion and the same observed ellipticity (Binney, 1978, 1980; Binney & Tremaine, 1987). The large error-bars on the are driven by uncertainties on the central velocity dispersion. Most of the sample bulges rotate as fast as both bulges of unbarred (Kormendy, 1982, 1993; Kormendy & Illingworth, 1982) and barred galaxies (Kormendy, 1982; Aguerri et al., 2005). However, the values of measured for NGC 1292, NGC 1425, ESO 548-44, and NGC 5267 are significantly larger than that predicted for the oblate spheroids.
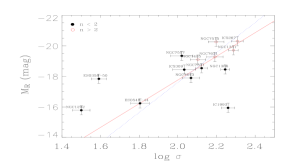
An other characteristic listed by Kormendy & Kennicutt (2004) is the position of pseudobulges with respect to the Faber-Jackson relation. The Faber-Jackson relation (FJ, Faber & Jackson, 1976) relates the luminosity of the elliptical galaxies and early-type bulges to their central velocity dispersion. The pseudobulges fall above the correlation (Kormendy & Kennicutt, 2004). Sample bulges, except for ESO 358-G50 and NGC 1292, are consistent with the band FJ relation we built from Forbes & Ponman (1999, ). They are characterized by a lower velocity dispersion or equivalently a higher luminosity with respect to their early-type counterparts (Fig. 18).
According to the prescriptions by Kormendy & Kennicutt (2004), the bulge of NGC 1292 is the most reliable pseudobulges in our sample. Information about its stellar population give more constraints on its nature and formation process. In fact, the bulge population has a intermediate age (3 Gyr) and low metal content ([] dex). The Fe enhancement is the lowest in our sample ([] dex) suggesting a prolonged star formation history. The presence of emission lines in the spectrum shows that star formation is still ongoing. These properties are consistent with a slow buildup of the bulge of NGC 1292 within a scenario of secular evolution.
9 Conclusions
The structural parameters and properties of the stellar population of the bulges of sample of 14 S0 and spiral galaxies of the Fornax, Eridanus and Pegasus cluster, and NGC 7582 group were investigated to constrain the dominant mechanism at the epoch of their assembly.
-
•
The bulge and disc parameters of the sample galaxies were derived performing a two-dimensional photometric decomposition of their band images. The surface-brightness distribution of the galaxy was assumed to be the sum of the contribution of a Sérsic bulge and an exponential disk. The two components were characterized by elliptical and concentric isophotes with constant (but possibly different) ellipticity and position angles. Most of the bulges have a Sérsic index and for few of them the apparent flattening of the bulge is similar to that of the disc. According to Kormendy & Kennicutt (2004) the disc-like flattening and radial profile are the photometric signature of the pseudobulge.
-
•
The central values of velocity dispersion and Mg b, Mg 2, , , and []′ line-strength indices were derived from the major-axis spectra. Correlations between Mg 2, , , and were found. The Mg 2 and , correlations are steeper than those found for early-type galaxies (e.g., Bernardi et al., 1998; Jørgensen, 1999a; Kuntschner, 2000; Mehlert et al., 2003). The correlation is consistent with previous findings for spiral bulges (Idiart et al., 1996; Prugniel et al., 2001; Proctor & Sansom, 2002).
-
•
The mean ages, total metallicities, and total Fe enhancements in the center of the sample bulges were derived by using the stellar population models by Thomas et al. (2003). The youngest bulges have an average age of 2 Gyr. They are characterized by ongoing star formation. The stellar population of intermediate-age bulges is 4 to 8 Gyr old. It has solar metallicity ([] dex). The older bulges have a narrow distribution in age around 10 Gyr and high metallicity ([] dex). Most of the sample bulges display solar Fe enhancements. A few have a central super-solar enhancement ([]).
-
•
There is no correlation between age, metallicity, and Fe enhancement of bulges with the membership of the host galaxy to different cluster. There is a correlation with the velocity dispersion. The more massive bulges of our sample galaxies are older, more metal rich and characterized by a fast star formation. Since we did not find any correlation with galaxy morphology we exclude a strong interplay between the bulge and disc components.
-
•
Most of the sample galaxies show no gradient in age and a negative gradient of metallicity. This is in agreement with the earlier findings by Mehlert et al. (2003) and Sánchez-Blázquez et al. (2006) for the early-type galaxies, and by Jablonka et al. (2007) for bulges. The presence of negative gradient in the metallicity radial profile favors a scenario with bulge formation via dissipative collapse. This implies strong inside-out formation that should give rise to a negative gradient in the /Fe enhancement too (Ferreras & Silk, 2002). But, no gradient was measured in the [] radial profiles for all the galaxies, except for NGC 1366 and NGC 7531. Moreover, the correlation between the central value and gradient of metallicity can not be built by pure dissipative collapse (Bekki & Shioya, 1999; Kobayashi & Arimoto, 1999) and suggests that mergers or acquisition events need to be invoked during the bulge assembly.
-
•
The peculiar gradients observed for the stellar population of the bulges of NGC 1366 and NGC 7531 suggest they host a substructure. Very interestingly, in NGC 1366 we found the presence of a kinematically-decoupled component. It is younger than the host bulge and formed by enriched material probably acquired via interaction or minor merging.
-
•
According to the prescriptions by Kormendy & Kennicutt (2004) the bulge of NGC 1292 is a pseudobulge. The properties of its stellar population are consistent with a slow buildup within a scenario of secular evolution. Indeed, the bulge of NGC 1292 has a intermediate age (3 Gyr) and low metal content ([] dex). The Fe enhancement is the lowest in our sample ([] dex) suggesting a prolonged star formation history. The presence of emission lines in the spectrum is a signature of ongoing star formation.
Acknowledgments
We thank David Burstein, Stephane Courteau, Reynier Peletier, and Alexandre Vazdekis for useful discussion and suggestions. LM is supported by grant (CPDR061795/06) by Padova University. University. FB, EMC, and AP receive support from grant PRIN2005/32 by Istituto Nazionale di Astrofisica (INAF) and from grant CPDA068415/06 by Padua University. LM and EMC acknowledge the Max-Planck-Institut fuer extraterrestrische Physik for hospitality while this paper was in progress.
References
- Afanasiev & Sil’chenko (2005) Afanasiev V. L., Sil’chenko O. K., 2005, A&A, 429, 825
- Aguerri et al. (2001) Aguerri J. A. L., Balcells M., Peletier R. F., 2001, A&A, 367, 428
- Aguerri et al. (2005) Aguerri J. A. L., Elias-Rosa N., Corsini E. M., Muñoz-Tuñón C., 2005, A&A, 434, 109
- Aguerri et al. (2005) Aguerri J. A. L., Iglesias-Páramo J., Vílchez J. M., Muñoz-Tuñón C., Sánchez-Janssen R., 2005, AJ, 130, 475
- Andredakis et al. (1995) Andredakis Y. C., Peletier R. F., Balcells M., 1995, MNRAS, 275, 874
- Andredakis & Sanders (1994) Andredakis Y. C., Sanders R. H., 1994, MNRAS, 267, 283
- Annibali et al. (2007) Annibali F., Bressan A., Rampazzo R., Zeilinger W. W., Danese L., 2007, A&A, 463, 455
- Arimoto & Yoshii (1987) Arimoto N., Yoshii Y., 1987, A&A, 173, 23
- Balcells et al. (2003) Balcells M., Graham A. W., Domínguez-Palmero L., Peletier R. F., 2003, ApJL, 582, L79
- Balogh et al. (2004) Balogh M., Eke V., Miller C., Lewis I., Bower R., Couch W., Nichol R., Bland-Hawthorn J., Baldry I. K., Baugh C., Bridges T., Cannon R., Cole S., Colless M., Collins C., Cross N., Dalton G., 2004, MNRAS, 348, 1355
- Bekki & Shioya (1999) Bekki K., Shioya Y., 1999, ApJ, 513, 108
- Bender et al. (1992) Bender R., Burstein D., Faber S. M., 1992, ApJ, 399, 462
- Bender et al. (1993) Bender R., Burstein D., Faber S. M., 1993, ApJ, 411, 153
- Berman (2001) Berman S., 2001, A&A, 371, 476
- Bernardi et al. (1998) Bernardi M., Renzini A., da Costa L. N., Wegner G., Alonso M. V., Pellegrini P. S., Rité C., Willmer C. N. A., 1998, ApJL, 508, L143
- Bertola et al. (1999) Bertola F., Corsini E. M., Vega Beltrán J. C., Pizzella A., Sarzi M., Cappellari M., Funes J. G., 1999, ApJL, 519, L127
- Bertola et al. (1991) Bertola F., Vietri M., Zeilinger W. W., 1991, ApJL, 374, L13
- Bertola et al. (1989) Bertola F., Zeilinger W. W., Rubin V. C., 1989, ApJL, 345, L29
- Beuing et al. (2002) Beuing J., Bender R., Mendes de Oliveira C., Thomas D., Maraston C., 2002, A&A, 395, 431
- Binney (1978) Binney J., 1978, MNRAS, 183, 501
- Binney (1980) Binney J., 1980, Royal Society of London Philosophical Transactions Series A, 296, 329
- Binney & Tremaine (1987) Binney J., Tremaine S., 1987, Galactic dynamics. Princeton, NJ, Princeton University Press, 1987, 747 p.
- Brough et al. (2007) Brough S., Proctor R., Forbes D. A., Couch W. J., Collins C. A., Burke D. J., Mann R. G., 2007, MNRAS, 378, 1507
- Bruzual & Charlot (2003) Bruzual G., Charlot S., 2003, MNRAS, 344, 1000
- Burki et al. (1995) Burki G., Rufener F., Burnet M., Richard C., Blecha A., Bratschi P., 1995, A&AS, 112, 383
- Burstein et al. (1997) Burstein D., Bender R., Faber S., Nolthenius R., 1997, AJ, 114, 1365
- Caon et al. (1993) Caon N., Capaccioli M., D’Onofrio M., 1993, MNRAS, 265, 1013
- Cappellari et al. (2006) Cappellari M., Bacon R., Bureau M., Damen M. C., Davies R. L., de Zeeuw P. T., Emsellem E., Falcón-Barroso J., Krajnović D., Kuntschner H., McDermid R. M., Peletier R. F., Sarzi M., van den Bosch R. C. E., van de Ven G., 2006, MNRAS, 366, 1126
- Carollo et al. (1998) Carollo C. M., Stiavelli M., Mack J., 1998, AJ, 116, 68
- Clemens et al. (2006) Clemens M. S., Bressan A., Nikolic B., Alexander P., Annibali F., Rampazzo R., 2006, MNRAS, 370, 702
- Coccato et al. (2004) Coccato L., Corsini E. M., Pizzella A., Morelli L., Funes J. G., Bertola F., 2004, A&A, 416, 507
- Cole et al. (2000) Cole S., Lacey C. G., Baugh C. M., Frenk C. S., 2000, MNRAS, 319, 168
- Collobert et al. (2006) Collobert M., Sarzi M., Davies R. L., Kuntschner H., Colless M., 2006, MNRAS, 370, 1213
- Corsini et al. (2003) Corsini E. M., Pizzella A., Coccato L., Bertola F., 2003, A&A, 408, 873
- Corsini et al. (1999) Corsini E. M., Pizzella A., Sarzi M., Cinzano P., Vega Beltrán J. C., Funes J. G., Bertola F., Persic M., Salucci P., 1999, A&A, 342, 671
- Coziol et al. (2001) Coziol R., Doyon R., Demers S., 2001, MNRAS, 325, 1081
- Davies & Illingworth (1983) Davies R. L., Illingworth G., 1983, ApJ, 266, 516
- de Jong (1996) de Jong R. S., 1996, A&AS, 118, 557
- de Vaucouleurs et al. (1991) de Vaucouleurs G., de Vaucouleurs A., Corwin H. G., Buta R. J., Paturel G., Fouque P., 1991, Third Reference Catalogue of Bright Galaxies. Volume 1-3, XII, 2069 pp. 7 figs.. Springer-Verlag Berlin Heidelberg New York
- Denicoló et al. (2005) Denicoló G., Terlevich R., Terlevich E., Forbes D. A., Terlevich A., 2005, MNRAS, 358, 813
- Dressler (1980) Dressler A., 1980, ApJ, 236, 351
- Eggen et al. (1962) Eggen O. J., Lynden-Bell D., Sandage A. R., 1962, ApJ, 136, 748
- Emsellem et al. (2004) Emsellem E., Cappellari M., Peletier R. F., McDermid R. M., Bacon R., Bureau M., Copin Y., Davies R. L., Krajnović D., Kuntschner H., Miller B. W., Tim de Zeeuw P., 2004, MNRAS, 352, 721
- Faber & Jackson (1976) Faber S. M., Jackson R. E., 1976, ApJ, 204, 668
- Fathi & Peletier (2003) Fathi K., Peletier R. F., 2003, A&A, 407, 61
- Ferguson (1989) Ferguson H. C., 1989, AJ, 98, 367
- Ferreras & Silk (2002) Ferreras I., Silk J., 2002, MNRAS, 336, 1181
- Fisher et al. (1996) Fisher D., Franx M., Illingworth G., 1996, ApJ, 459, 110
- Forbes & Ponman (1999) Forbes D. A., Ponman T. J., 1999, MNRAS, 309, 623
- Fouque et al. (1992) Fouque P., Gourgoulhon E., Chamaraux P., Paturel G., 1992, A&AS, 93, 211
- Freeman (1970) Freeman K. C., 1970, ApJ, 160, 811
- Ganda et al. (2007) Ganda K., Peletier R. F., McDermid R. M., Falcón-Barroso J., de Zeeuw P. T., Bacon R., Cappellari M., Davies R. L., Emsellem E., Krajnović D., Kuntschner H., Sarzi M., van de Ven G., 2007, MNRAS, 380, 506
- Garcia (1993) Garcia A. M., 1993, A&AS, 100, 47
- Gerhard et al. (1989) Gerhard O. E., Vietri M., Kent S. M., 1989, ApJL, 345, L33
- Gilmore & Wyse (1998) Gilmore G., Wyse R. F. G., 1998, AJ, 116, 748
- Gorgas et al. (1990) Gorgas J., Efstathiou G., Salamanca A. A., 1990, MNRAS, 245, 217
- Goudfrooij et al. (1999) Goudfrooij P., Gorgas J., Jablonka P., 1999, Astrophysics and Space Science, 269, 109
- Graham (2001) Graham A. W., 2001, MNRAS, 326, 543
- Idiart et al. (1996) Idiart T. P., de Freitas Pacheco J. A., Costa R. D. D., 1996, AJ, 112, 2541
- Jablonka et al. (2007) Jablonka P., Gorgas J., Goudfrooij P., 2007, ArXiv e-prints, 707
- Jablonka et al. (1996) Jablonka P., Martin P., Arimoto N., 1996, AJ, 112, 1415
- Jørgensen (1999a) Jørgensen I., 1999a, MNRAS, 306, 607
- Jørgensen (1999b) Jørgensen I., 1999b, MNRAS, 306, 607
- Kauffmann (1996) Kauffmann G., 1996, MNRAS, 281, 487
- Kobayashi & Arimoto (1999) Kobayashi C., Arimoto N., 1999, ApJ, 527, 573
- Kodama et al. (1998) Kodama T., Arimoto N., Barger A. J., Arag’on-Salamanca A., 1998, A&A, 334, 99
- Kormendy (1977) Kormendy J., 1977, ApJ, 217, 406
- Kormendy (1982) Kormendy J., 1982, ApJ, 257, 75
- Kormendy (1993) Kormendy J., 1993, in Dejonghe H., Habing H. J., eds, Galactic Bulges Vol. 153 of IAU Symposium, Kinematics of extragalactic bulges: evidence that some bulges are really disks. pp 209–+
- Kormendy et al. (2001) Kormendy J., Gebhardt K., Macchetto F. D., Sparks W. B., 2001, AJ
- Kormendy & Illingworth (1982) Kormendy J., Illingworth G., 1982, ApJ, 256, 460
- Kormendy & Kennicutt (2004) Kormendy J., Kennicutt R. C., 2004, ARA&A, 42, 603
- Krajnović & Jaffe (2004) Krajnović D., Jaffe W., 2004, A&A, 428, 877
- Kuntschner (2000) Kuntschner H., 2000, MNRAS, 315, 184
- Kuntschner et al. (2001) Kuntschner H., Lucey J. R., Smith R. J., Hudson M. J., Davies R. L., 2001, MNRAS, 323, 615
- Larson (1974) Larson R. B., 1974, MNRAS, 166, 585
- Lindblad (1956) Lindblad B., 1956, Vistas in Astronomy, 2, 1711
- MacArthur et al. (2003) MacArthur L. A., Courteau S., Holtzman J. A., 2003, ApJ, 582, 689
- Matthews & de Grijs (2004) Matthews L. D., de Grijs R., 2004, AJ, 128, 137
- McDermid et al. (2006) McDermid R. M., Emsellem E., Shapiro K. L., Bacon R., Bureau M., Cappellari M., Davies R. L., de Zeeuw T., Falcón-Barroso J., Krajnović D., Kuntschner H., Peletier R. F., Sarzi M., 2006, MNRAS, 373, 906
- Mehlert et al. (1998) Mehlert D., Saglia R. P., Bender R., Wegner G., 1998, A&A, 332, 33
- Mehlert et al. (2000) Mehlert D., Saglia R. P., Bender R., Wegner G., 2000, A&AS, 141, 449
- Mehlert et al. (2003) Mehlert D., Thomas D., Saglia R. P., Bender R., Wegner G., 2003, A&A, 407, 423
- Mendez-Abreu et al. (2007) Mendez-Abreu J., Aguerri J. A. L., Corsini E. M., Simonneau E., 2007, ArXiv e-prints, 710
- Möllenhoff & Heidt (2001) Möllenhoff C., Heidt J., 2001, A&A, 368, 16
- Moore et al. (2002) Moore S. A. W., Lucey J. R., Kuntschner H., Colless M., 2002, MNRAS, 336, 382
- Moorthy & Holtzman (2006) Moorthy B. K., Holtzman J. A., 2006, MNRAS, 371, 583
- Moré et al. (1980) Moré J. J., Garbow B. S., Hillstrom K. E., 1980, Argonne National Laboratory Report ANL-80-74
- Morelli et al. (2004) Morelli L., Halliday C., Corsini E. M., Pizzella A., Thomas D., Saglia R. P., Davies R. L., Bender R., Birkinshaw M., Bertola F., 2004, MNRAS, 354, 753
- Nishiura et al. (2000) Nishiura S., Shimada M., Ohyama Y., Murayama T., Taniguchi Y., 2000, AJ, 120, 1691
- Osterbrock et al. (1996) Osterbrock D. E., Fulbright J. P., Martel A. R., Keane M. J., Trager S. C., Basri G., 1996, PASP, 108, 277
- Paturel et al. (2003) Paturel G., Petit C., Prugniel P., Theureau G., Rousseau J., Brouty M., Dubois P., Cambrésy L., 2003, A&A, 412, 45
- Peletier (1989) Peletier R. F., 1989, PhD thesis, University of Groningen
- Peletier et al. (2007) Peletier R. F., Falcón-Barroso J., Bacon R., Cappellari M., Davies R. L., de Zeeuw P. T., Emsellem E., Ganda K., Krajnović D., Kuntschner H., McDermid R. M., Sarzi M., van de Ven G., 2007, MNRAS, 379, 445
- Pizzella et al. (2002) Pizzella A., Corsini E. M., Morelli L., Sarzi M., Scarlata C., Stiavelli M., Bertola F., 2002, ApJ, 573, 131
- Proctor & Sansom (2002) Proctor R. N., Sansom A. E., 2002, MNRAS, 333, 517
- Prugniel et al. (2001) Prugniel P., Maubon G., Simien F., 2001, A&A, 366, 68
- Rampazzo et al. (2005) Rampazzo R., Annibali F., Bressan A., Longhetti M., Padoan F., Zeilinger W. W., 2005, A&A, 433, 497
- Reda et al. (2007) Reda F. M., Proctor R. N., Forbes D. A., Hau G. K. T., Larsen S. S., 2007, MNRAS, 377, 1772
- Salpeter (1955) Salpeter E. E., 1955, ApJ, 121, 161
- Sánchez-Blázquez et al. (2006) Sánchez-Blázquez P., Gorgas J., Cardiel N., 2006, A&A, 457, 823
- Sánchez-Blázquez et al. (2006) Sánchez-Blázquez P., Gorgas J., Cardiel N., González J. J., 2006, A&A, 457, 809
- Sandage (1990) Sandage A., 1990, JARSC, 84, 70
- Sarzi et al. (2000) Sarzi M., Corsini E. M., Pizzella A., Vega Beltrán J. C., Cappellari M., Funes J. G., Bertola F., 2000, A&A, 360, 439
- Sarzi et al. (2006) Sarzi M., Falcón-Barroso J., Davies R. L., Bacon R., Bureau M., Cappellari M., de Zeeuw P. T., Emsellem E., Fathi K., Krajnović D., Kuntschner H., McDermid R. M., Peletier R. F., 2006, MNRAS, 366, 1151
- Sersic (1968) Sersic J. L., 1968, Atlas de galaxias australes. Cordoba, Argentina: Observatorio Astronomico, 1968
- Thomas & Davies (2006) Thomas D., Davies R. L., 2006, MNRAS, 366, 510
- Thomas et al. (2003) Thomas D., Maraston C., Bender R., 2003, MNRAS, 339, 897
- Thomas et al. (2005) Thomas D., Maraston C., Bender R., Mendes de Oliveira C., 2005, ApJ, 621, 673
- Tinsley (1980) Tinsley B. M., 1980, Fundamentals of Cosmic Physics, 5, 287
- Trager et al. (1999) Trager S. C., Dalcanton J. J., Weiner B. J., 1999, in The Formation of Galactic Bulges Integrated Stellar Populations of Bulges: First Results. pp 42–+
- Trager et al. (2000) Trager S. C., Faber S. M., Worthey G., González J. J., 2000, AJ, 119, 1645
- Trager et al. (1998) Trager S. C., Worthey G., Faber S. M., Burstein D., Gonzalez J. J., 1998, ApJS, 116, 1
- Tremonti et al. (2004) Tremonti C. A., Heckman T. M., Kauffmann G., Brinchmann J., Charlot S., White S. D. M., Seibert M., Peng E. W., Schlegel D. J., Uomoto A., Fukugita M., Brinkmann J., 2004, ApJ, 613, 898
- Worthey et al. (1992) Worthey G., Faber S. M., Gonzalez J. J., 1992, ApJ, 398, 69
- Worthey et al. (1994) Worthey G., Faber S. M., Gonzalez J. J., Burstein D., 1994, ApJS, 94, 687
- Zaritsky & Lo (1986) Zaritsky D., Lo K. Y., 1986, ApJ, 303, 66
Appendix A Kinematics results
Appendix B Stellar kinematic and line strength indices.
| r | Mg 2 | Mg b | Fe5270 | Fe5335 | ||||
| (arcsec) | () | () | (mag) | (Å) | (Å) | (Å) | (Å) | (Å) |
| (1) | (2) | (3) | (4) | (5) | (6) | (7) | (8) | (9) |
| ESO 358-50 | ||||||||
| 0.00 | ||||||||
| 0.00 | ||||||||
| 0.00 | ||||||||
| 0.00 | ||||||||
| 0.00 | ||||||||
| 0.00 | ||||||||
| ESO 548-44 | ||||||||
| 0.00 | ||||||||
| 0.00 | ||||||||
| 0.00 | ||||||||
| 0.00 | ||||||||
| 0.00 | ||||||||
| 0.00 | ||||||||
| IC 1993 | ||||||||
| 0.00 | ||||||||
| 0.00 | ||||||||
| 0.00 | ||||||||
| 0.00 | ||||||||
| 0.00 | ||||||||
| 0.00 | ||||||||
| IC 5267 | ||||||||
| IC 5309 | ||||||||
| (1) | (2) | (3) | (4) | (5) | (6) | (7) | (8) | (9) |
| NGC 1292 | ||||||||
| NGC 1351 | ||||||||
| 0.00 | ||||||||
| 0.00 | ||||||||
| 0.00 | ||||||||
| 0.00 | ||||||||
| 0.00 | ||||||||
| 0.00 | ||||||||
| 0.00 | ||||||||
| 0.00 | ||||||||
| 0.00 | ||||||||
| 0.00 | ||||||||
| 0.00 | ||||||||
| 0.00 | ||||||||
| 0.00 | ||||||||
| 0.00 | ||||||||
| 0.00 | ||||||||
| 0.00 | ||||||||
| 0.00 | ||||||||
| 0.00 | ||||||||
| 0.00 | ||||||||
| 0.00 | ||||||||
| 0.00 | ||||||||
| 0.00 | ||||||||
| 0.00 | ||||||||
| 0.00 | ||||||||
| 0.00 | ||||||||
| 0.00 | ||||||||
| 0.00 | ||||||||
| NGC 1366 | ||||||||
| 0.00 | ||||||||
| 0.00 | ||||||||
| 0.00 | ||||||||
| 0.00 | ||||||||
| 0.00 | ||||||||
| 0.00 | ||||||||
| 0.00 | ||||||||
| 0.00 | ||||||||
| 0.00 | ||||||||
| 0.00 | ||||||||
| 0.00 | ||||||||
| 0.00 | ||||||||
| 0.00 | ||||||||
| 0.00 | ||||||||
| 0.00 | ||||||||
| 0.00 | ||||||||
| 0.00 | ||||||||
| 0.00 | ||||||||
| 0.00 | ||||||||
| 0.00 |
| (1) | (2) | (3) | (4) | (5) | (6) | (7) | (8) | (9) |
| NGC 1425 | ||||||||
| 0.00 | ||||||||
| 0.00 | ||||||||
| 0.00 | ||||||||
| 0.00 | ||||||||
| 0.00 | ||||||||
| 0.00 | ||||||||
| 0.00 | ||||||||
| 0.00 | ||||||||
| 0.00 | ||||||||
| 0.00 | ||||||||
| 0.00 | ||||||||
| 0.00 | ||||||||
| 0.00 | ||||||||
| 0.00 | ||||||||
| 0.00 | ||||||||
| 0.00 | ||||||||
| 0.00 | ||||||||
| 0.00 | ||||||||
| 0.00 | ||||||||
| 0.00 | ||||||||
| 0.00 | ||||||||
| 0.00 | ||||||||
| NGC 7515 | ||||||||
| NGC 7531 | ||||||||
| NGC 7557 | ||||||||
| 0.00 | ||||||||
| 0.00 | ||||||||
| 0.00 | ||||||||
| 0.00 | ||||||||
| 0.00 | ||||||||
| 0.00 |
| (1) | (2) | (3) | (4) | (5) | (6) | (7) | (8) | (9) |
| NGC 7631 | ||||||||
| NGC 7643 | ||||||||